Radhika Swarnkar | Harikrishnan R*
© 2021 IIETA. This article is published by IIETA and is licensed under the CC BY 4.0 license (http://creativecommons.org/licenses/by/4.0/).
OPEN ACCESS
Renewable energy is a solution for electricity generation for cleaner and green energy. The aim of this paper is to find the energy potential of India in terms of sources, per-capita energy consumption and the main potential consumers. Comparing consumption of fossil fuels and Renewable energy sources (RES) of India in 2019 and 2020 and finally to find whether there is any change in energy generation of two solar power plants in different geographical location of India with the help of independent t-test statistics. In this paper two statistical analysis are proposed. One is the statistical analysis of installed capacity, generation and consumption of fossil fuels and renewable energy in India. Other one is the statistical analysis of two solar power plants located at different geographical locations in India. From the statistical analysis it is found that, installed capacity of coal, RES and hydro is increased in 2020 as compared to 2019. Total demand in January 2020 is 2,77,140.33 MW whereas total installed capacity is 3,71,126 MW, this means that installed capacity is more but are not in running condition. From the statistical analysis of two independent solar power plants it is found that solar power plant-1 generates more energy but with high conversion loss hence poor efficiency.
solar power plant, statistical analysis, descriptive statistics, independent t-test, renewable energy sources
India is a country which is having different cultures, festivals, and religion. India is a densely populated country after China. Change in economy leads to change in lifestyle and living standard. As population increases, demand of energy also increases. Change in economy leads to change in lifestyle and living standard. Automation which is the core of Industrial Revolution 4.0 demanded more electricity by 24*7. Internet of things leads to automation and two-way communication between everything. Fossil fuels like coal, crude oil, etc. are depleting nowadays. Power plants and industries mostly use these fossil fuels as primary source of energy production. This leads to pollution of air, water, and environment. Air Quality Index of the world became poorer and lead to global warming, melting of glaciers and breathing problem. Renewable energy sources (RES) like solar, wind, hydro, geothermal, tidal energy, etc. are having advantages and disadvantages. The disadvantage of the renewable energy sources is that they are varying throughout the day, so it is difficult to harness these energies with improved efficiency, to mitigate the energy demand. The advantages of renewable energy sources are the energy is cleaner, greener, available as pure form of energy and available in abundant and free of cost. Different variety of solar panels tracker based on control system applied, driver, and based on degree of freedom of the movement of the system are discussed in Awasthi et al. [1] paper. For efficient tracking of solar energy some parameters have to be taken into consideration such as date, time, sensors, latitude and longitude.
India signed MoU with other countries for renewable energy production, expansion, and usage. In COP 21, Shri Narendra Modi honourable P.M. of India said that India and France have make decisive action to make International Solar Alliance (ISA). Nations committed in Paris agreement to reduce GHG emission of their GDP, 33-35% by 2030 discussed in livemint.com website [2]. The main objective of this alliance is to work for efficient consumption of solar energy to reduce dependence on fossil fuels. Various programs, events and subsidy are provided to aware people for solar mission. Problem in electricity generation by solar PV system is less conversion efficiency, so instead of traditional panel, solar concentrator has to be used for better conversion efficiency gain. Policies, subsidy and GDP on solar energy for Indian scenario are discussed in Raina et al. [3] paper. South Asian countries energy polices, institutions and installed capacity of solar, wind, LPG, oil, and petroleum statistical analysis are done in Ul-Haq et al. [4].
The need of this research is to know how much available installed and generation potential of India and who are the key consumers consuming most of the energy. And also need to know is there any effect of change of geographical location in solar energy generation. Based on the statistical analysis, finding how much India is primarily dependent on fossil fuel for energy generation and which consumer needs to focus more on RES installation to fulfil their base load requirement. Based on two independent solar power plants at different geographical locations will leads to change in solar power generation or not. And finding which solar power plant has more efficiency and low conversion loss. The dataset for survey of Installed capacity, generation and consumption are taken from CAE govt. website. And the two solar power plant at different locations of India are taken from Kaggle dataset.
As compared to wind power-plant, solar power-plant requires low maintenance and low installation cost therefore gains popularity. Satellite based solar energy (GHI and DNI datasets) at a particular region of southern part of India is analysed for better energy planning and knowing energy potential at which location is high Kumar [5], solar forecasting case study based on four different models. Random Forest gives better result for solar irradiation forecast than CART model Srivastava et al. [6]. CSP based parabolic trough, heliostat tower and Fresnel reflector categories are compared. Heliostat tower plant is low cost and highly efficient and can be used in flat as well as terrain hill surface. Statistical analysis of the three solar thermal power plant and countries are performed and concluded there is no efficiency difference between the three plants Sueyoshi et al. [7]. The paper consists of 6 sections. In section 2, basic terminologies and key concept related to statistics, test and RES are discussed. In section 3, statistical analysis of installed capacity of fossil fuels and RES in India is discussed. In section 4, dataset of two solar power plant is analysed. Section 5 deals with conclusion.
2.1 Renewable energy sources
In developing countries like India, charcoal and dry wood are available at cheap cost and used for heating, cooking and melting of products. Burning of fossil fuels cause air pollution, breathing problem, melting of glacier and various skin disease when direct sunlight reaches to humans. RES are abundant in nature and no harmful emission while producing energy. Solar energy is extracted from solar PV panel. When irradiation falls on the surface of panel, light energy is converted into electrical energy due to photoelectric effect. Various researches have been done in the field of solar photovoltaic system. In order to boost the research in the area of solar photovoltaic and other renewable energy sources, the Ministry of New and Renewable Energy (MNRE), was formed in India. This MNRE is responsible for drafting and implementing policies in the field of RES. Initially subsidy was also provided by the government to boost this solar mission plan.
2.2 Statistical analysis
Statistical analysis is a process of gathering data, sorting it and finding relevant data, and then analyzing and summarizing it. Statistical analysis can be done by data collection, data preprocessing, data cleaning, and formulation of alternate hypothesis. Then on the basis of hypothesis t-test is chosen accordingly. Based on the statistical analysis of wind speed, distribution of power to BESS is calculated easily in Yao [8], Li et al. [9]. Terminologies that have to be known before doing statistical analysis are population, sample, sampling, mean, median, mode, range, quartiles, percentile, correlation, variance, standard deviation, types of data, and various types of tests.
Population: Population is the large amount of dataset.
Sample: It is a subset of population which is having small amount of data from population.
Sampling: Sampling is a process of collecting data and performing analysis on it.
Mean: Average of the sample data is called mean. It is denoted by sigma.
Median: It is the middle of the ascending order arranged data set.
Mode: It indicates most frequent data points. The data which occurs most number of times in sample is called mode data.
Range: Range is the difference between highest and lowest value of our dataset. Range is helpful for smaller dataset where outliers not present.
Quartile: It is generally used to break the data into parts so as to find better spread of data which is less influenced by outliers.
Percentile: Percentiles are scores used to describe value below which some observation fall.
Correlation: It is used to measure the degree of linear bonding between two quantitative variables. Correlation ranges from +1 to -1.
Variance: It is the measure of how much a group of numbers are spread out from their mean value.
Standard Deviation: It is the square root of variance. It is used to express the magnitude by which group of members differ from mean value.
Types of data: Data is a collection of information. Majorly data is classified into two types namely quantitative data and qualitative data. Qualitative data also known as categorical data whereas quantitative data is also known as numerical data. Data can be further categorized into continuous and discrete data.
Various types of tests: Test is performed to analyze the data and inference made from it. There are various types of tests namely one sample t-test, two sample t-test, Z-test, two sample independent t-test, chi-square test, one way ANNOVA test, spearman’s rank correlation test and Wilcoxon rank-sum test. Students t-test is used in many applications like for determining which MOSFET category has better electrical performance by Peruzzi et al. [10].
2.3 Independent t-test
Two sample independent t-test is also known as independent t-test. Unpaired two or more than two independent groups from each other datasets are taken for performing this test. Alternate hypothesis is formulated. Always null hypothesis represented in equal sign, mean of two independent solar power plant data. Then in JASP software which is an open source software, Independent t-test analysis of dataset is done. If p-value is less than alpha value which means rejecting null hypothesis and accepting alternate hypothesis. And if p-value is greater than alpha value which means accepting the null hypothesis and rejecting the alternate hypothesis. Whichever comes is the final result finding.
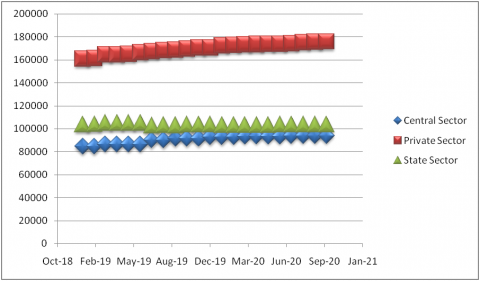
Country wise USA tops the clean energy investment by making an investment of 447.642 million dollar (from 2004-2014) and total installed capacity of USA is 224.788MW whereas India invested 72.828 million dollar for clean energy in 2004-2014 and 23.014MW installed capacity in 2014 by Khan et al. [11]. The dataset of installed capacity of India is taken from CEA government website [12] for statistical analysis. Installed capacity of India in 2019-20 in terms of sector-wise is shown in Figure 1. In 1974, major contribution in installing power plant was made by central and state government. But now major contribution is done by private players. BHEL, Power Grid, NTPC are central government power sectors, whereas TATA power, ABB, DELTA electronics India are the private power sector by Raina et al. [3]. Major contribution in capacity installation is done by private sector (1,75,891.26 MW), then followed by state sector (1,03,617.4 MW) and central sector (93,926.93 MW).
Figure 1. Sector wise power plant capacity installed in 2019-20
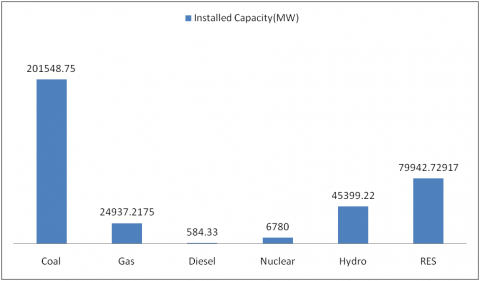
Installed capacity in 2019 in terms of source-wise is shown in Figure 2. Coal, gas, diesel and nuclear are non-renewable source of energy whereas RES like bio-mass, solar, wind, bio-gas and hydro are renewable source of energy. Maximum installed energy is from coal then followed by RES.
Figure 2. Installed capacity in 2019 in terms of source-wise
The statistical analysis is performed in JASP software. Table 1 shows descriptive analysis of source based installed capacity in 2019. Maximum installed capacity in 2019 is 2,01,548.75 MW from coal and minimum installed capacity is 584.33 MW from diesel and total installed capacity in 2019 is 3,59,192.25 MW and the average installed capacity is 59,865.37 MW.
Table 1. Descriptive analysis of source based installed capacity in 2019
|
|
Installed Capacity(MW) |
|
Valid |
6 |
|
Missing |
0 |
|
Mean |
59865.374 |
|
Std. Deviation |
75151.612 |
|
Minimum |
584.330 |
|
Maximum |
201548.750 |
|
Sum |
359192.247 |
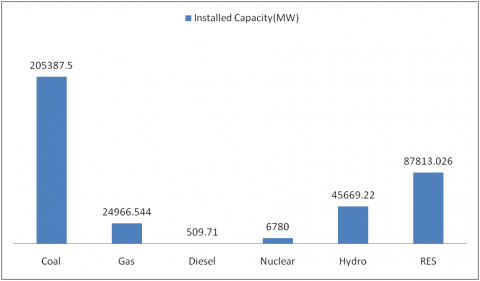
Installed capacity of India in 2020 in terms of Source-wise is shown in Figure 3. From Figure 2 and Figure 3 installed capacity of coal, RES and hydro is increased 1.9%, 9.8% and 0.59% respectively. Whereas diesel and gas installed capacity is decreased 12.7% and 0.12% respectively.
Figure 3. Installed capacity in 2020 in terms of source-wise
Table 2 shows descriptive analysis of installed capacity in 2020. Total installed capacity in 2020 is 3,71,126 MW. Average or mean installed capacity in 2020 is 61,854.33 MW. Total capacity and Maximum installed capacity are increased due to increase in coal, hydro and RES installation.
Table 2. Descriptive analysis of source based installed capacity in 2020
|
|
Installed Capacity(MW) |
|
Valid |
6 |
|
Missing |
0 |
|
Mean |
61854.333 |
|
Std. Deviation |
77064.435 |
|
Minimum |
509.710 |
|
Maximum |
205387.500 |
|
Sum |
371126.000 |
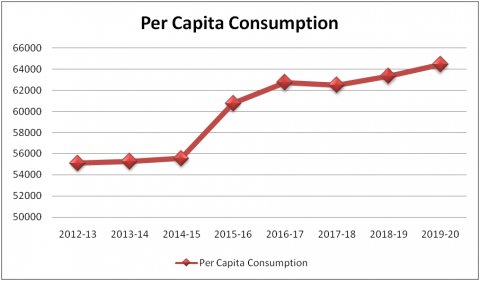
Per capita energy consumption increases year-by-year is shown in Figure 4. In 2012-13, per capita consumption was 55,112.06 kWh. As the year passes electrical energy requirement increases. Now in 2019-20 per capita consumption is 64,432.34 kWh which shows 16.9% increment from 2012-13.
Figure 4. Per capita energy consumption from 2012 to 2020
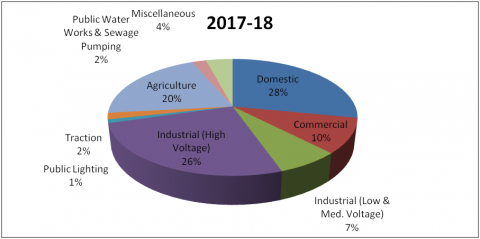
In January 2020, energy demand is 1,05,548.16 MU whereas energy availability is 1,05,158.01 MU. Peak power demand in January 2020 is 1,71,592.17 MW whereas peak met is 1,70,976.08 MW. Total demand in January 2020 is 2,77,140.33 MW and from Table 2 total installed capacity is 3,71,126 MW, this means that installed capacity is more but are not in running condition. Figure 5 shows sector-wise load contribution in 2017-18. Maximum consumption by domestic users that is 28% followed by industrial (HV) 26% then agriculture sector 20%. Very less energy consumption by public lighting, traction, public water work and sewage pumping that is 1% to 2%.
Figure 5. Sector-wise load contribution in 2017-18
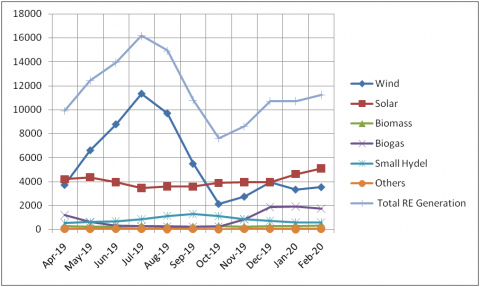
Figure 6 shows individual renewable energy contribution from 2019 to 2020. Maximum contribution in energy generation in the year 2020 is by solar that is 5085.175 MU then followed by wind that is 3518.88 MU. Minimum contribution in energy generation is by others and biomass in the year 2020.
Figure 6. Individual renewable energy contribution from 2019 to 2020
Here Kaggle data set is taken for the survey analysis of two solar power plant at different locations in India [13]. Two solar power plants at different locations in India are taken and statistical analysis is performed. During the summer time in May-June 2020, 34days with 15 min. interval data were taken and sensor data and inverter data analysis is performed. For analysis, 22 inverter data are taken. The survey of two solar power plants at different geographical location of India are done in order to find is there any difference in the power generation between the two plants through statistical test. Through this statistical analysis, also find which solar power plant is more efficient in energy conversion. From the survey data of two solar power plants, weather forecasting and power estimation in the near future can be done.
4.1 Descriptive analysis of solar power plant-1
The statistical analysis is performed in JASP software. JASP is an open source software for statistical analysis. It is simple and easy to use and analyse data in both classical and Bayesian analysis forms by Kovari [14]. Table 3 shows that mean DC power from solar panel-1for all the days and hours is 3147.43W whereas output of inverter is AC power which comes out to be 307.8W as mean, but this is not the actual average power of day. For actual average power of a day is calculated by Eq. (1) as shown below.
Actual average power of $a$ day $=\frac{\text { Total power }}{\text { no. of days }}$ (1)
By substituting the parameters values in Equation 1 and solving following values are derived:
Actual average DC power = $\frac{2.165 \times 10^{8}}{34}$ = 6.35$\times 10^{6}$W,
Actual average AC power = $\frac{2.117 \times 10^{7}}{34}=6.23 \times 10^{5} \mathrm{~W}$.
This shows that actual average DC power is greater than actual average AC power which means power conversion in inverter has maximum loss and less efficient.
Table 3. Analysis of generation of solar power plant-1
|
DC_POWER |
AC_POWER |
|
|
Valid |
68778 |
68778 |
|
Missing |
0 |
0 |
|
Mean |
3147.426 |
307.803 |
|
Median |
429.000 |
41.494 |
|
Std. Deviation |
4036.457 |
394.396 |
|
Minimum |
0.000 |
0.000 |
|
Maximum |
14471.125 |
1410.950 |
|
Sum |
2.165e +8 |
2.117e +7 |
Average irradiation of each day=$\frac{\text { Total irradiation }}{\text { no.of days }}=\frac{726.5}{34}$= 21.36 kWh/m2.
Table 4. Analysis of weather condition of solar power plant-1
|
|
AMBIENT_TEMP |
MODULE_TEMP |
IRRADIATION |
|
Valid |
3182 |
3182 |
3182 |
|
Missing |
0 |
0 |
0 |
|
Mean |
25.532 |
31.091 |
0.228 |
|
Median |
24.614 |
24.618 |
0.025 |
|
Std. Deviation |
3.355 |
12.261 |
0.301 |
|
Minimum |
20.399 |
18.140 |
0.000 |
|
Maximum |
35.252 |
65.546 |
1.222 |
|
Sum |
81241.569 |
98931.611 |
726.491 |
Table 5 shows correlation between ambient temperature, module temperature and irradiation. Lower positive diagonal elements shows that they are positively correlated. Correlation value is 0.962 which shows module temperature and irradiation are highly correlated. Correlation value of 0.8 shows module temperature and ambient temperature are also highly correlated, this shows that module temperature is dependent on ambient temperature. P value is less than 0.001 which shows that probability of one out of thousand value may be wrong.
Table 5. Correlation between ambient temperature, module temperature and irradiation
|
Variable |
|
AMBIENT_TEMP |
MODULE_TEMP |
IRRADIATION |
|
1. AMBIENT_TEMP |
Pearson's r |
— |
|
|
|
|
p-value |
— |
|
|
|
2. MODULE_TEMP |
Pearson's r |
0.854 |
— |
|
|
|
p-value |
< .001 |
— |
|
|
3. IRRADIATION |
Pearson's r |
0.723 |
0.962 |
— |
|
|
p-value |
< .001 |
< .001 |
— |
4.2 Descriptive analysis of solar power plant-2
Table 6 shows mean DC power from solar panel-2 for all the days and hours is 246.702 W whereas output of inverter is AC power which comes out to be 241.278 Was mean, but this is not the actual average power of day. For actual average power of a day is calculated by Eq. (1).
Actual average DC power $=\frac{1.67 \times 10^{7}}{34}=4.9 \times 10^{5} \mathrm{~W}$
Actual average $\mathrm{AC}$ power $=\frac{1.63 \times 10^{7}}{34}=4.79 \times 10^{5} \mathrm{~W}$
This shows that actual average DC power is equal to actual average AC power which means inverter works properly with 99% efficiency and there is minimum loss in power conversion.
Table 6. Analysis of generation of solar power plant-2
|
|
DC_POWER |
AC_POWER |
|
Valid |
67698 |
67698 |
|
Missing |
0 |
0 |
|
Mean |
246.702 |
241.278 |
|
Median |
0.000 |
0.000 |
|
Std. Deviation |
370.570 |
362.112 |
|
Minimum |
0.000 |
0.000 |
|
Maximum |
1420.933 |
1385.420 |
|
Sum |
1.670e +7 |
1.633e +7 |
Table 7. Analysis of weather condition of solar power plant-2
|
|
AMBIENT_TEMP |
MODULE_TEMP |
IRRADIATION |
|
Valid |
3259 |
3259 |
3259 |
|
Missing |
0 |
0 |
0 |
|
Mean |
28.069 |
32.772 |
0.233 |
|
Median |
26.981 |
27.535 |
0.019 |
|
Std. Deviation |
4.062 |
11.344 |
0.313 |
|
Minimum |
20.942 |
20.265 |
0.000 |
|
Maximum |
39.182 |
66.636 |
1.099 |
|
Sum |
91478.174 |
106805.277 |
758.490 |
Weather condition for solar power plant-2 is analysed in Table 7. Minimum and maximum ambient temperature throughout all these days is 21℃ and 39℃ respectively. Minimum and maximum module temperature is 20℃ and 67℃ respectively as shown in Table 7.
Average irradiation of each day = $\frac{\text { Total irradiation }}{\text { no.of days }}=\frac{758.5}{34}$ = 22.3 kWh/m2.
Pearson correlation for weather analysis of solar power plant-2 is same as solar power plant-1. Irradiation is highly correlated to module temperature and module temperature is also highly correlated to ambient temperature.
4.3 Hypothetical analysis of solar power plant-1 and 2
Hypothesis is the initial stage of investigation. It helps in verifying the observation. It helps in directing the experiment going in right direction or not.
Null Hypothesis (H0): Both the solar power plant generate the same DC power. There is no difference.
Alternate Hypothesis (H1): There is difference in DC power generation of both the solar power plants.
Here, Independent sample t-test is used for analysing two group (solar power plant at different location) and two datasets (DC power). For two tailed tests, alpha is 0.05. From Table 8 and Table 10 Degree of freedom, df = N1+N2 -2 = 14999 +14999-2= 29996. Table 8 shows group descriptive of both the solar power plant. Here 14999 no. of samples are taken from 67698 no. of population data. Mean dc power of plant 1 and plant 2 are 3135W and 274W respectively.
Table 8. Group descriptive of solar power plants
|
|
Group |
N |
Mean |
SD |
SE |
|
DC_POWER |
Solar_plant1 |
14999 |
3134.930 |
3966.780 |
32.390 |
|
|
Solar_plant2 |
14999 |
273.946 |
406.128 |
3.316 |
Figure 7 shows descriptive plot of both the solar power plants. In this Figure the line is tilted shows there is a huge variation in both the groups.
Figure 7. Descriptive plot of both the groups
In Table 9 assumption check has been taken into consideration. Levene’s test is performed for equality of variance check and p- value comes out to be less than 0.001 means significant. P-value is less than 0.05 this means hypothesis of equal variance is rejected.
Table 9. Assumption check for variance
|
|
F |
df |
p |
|
DC_POWER |
39095.485 |
1 |
<.001 |
Table 10. Independent samples t- test analysis
|
|
t |
df |
p |
Mean Difference |
SE Difference |
Cohen's d |
|
DC_POWER |
87.871 |
29996 |
< .001 |
2860.984 |
32.559 |
1.015 |
Table 10 shows statistical analysis of Independent sample t- test. Here p-value is less than alpha value which means rejecting null hypothesis and accepting alternate hypothesis. This means there is a difference between both the DC power generation of the solar power plants.
Based on irradiation and module temperature, generation of output power differs. There is a difference in the generation of two solar power plants is proven by independent t- test. Generation of solar power plant-1 is more as compared to solar power plant-2 but power conversion loss is more on solar power plant-1.
In this paper two different works has been done. First one is the statistical analysis of fossil fuel and renewable energy sources. The focus of this analysis is to quantify the solar energy potential in India. From this analysis it is understood that installed capacity of RES is increased by 9.8% from 2019 to 2020. Maximum contribution of RES in terms of energy generation is by solar that is 5085.175 MU then followed by wind that is 3518.88 MU. In January 2020, energy demand is 1,05,548.16 MU whereas energy available is 1,05,158.01 MU. Peak power demand in January 2020 is 1,71,592.17 MW whereas peak met is 1,70,976.08 MW. Therefore, the total electrical energy demand in January 2020 is 2,77,140.33 MW and total installed capacity in 2020 is 3,71,126 MW. This means that installed capacity is more but are not in running condition. So, from this installed capacity analysis, energy demand and consumption analysis conclude that there is a need to increase the generation in order to meet the sufficient energy demand. Maximum consumption of energy is 28% by the domestic load.
Second is the comparative statistical analysis of two solar power plants that are in two different locations of India. Independent t-test results show that there is a difference in the DC power generation of both the plants. The dc power generation of solar power plant-1 is better than solar power plant-2 but power conversion loss is more in solar power plant-1 which is known from descriptive analysis. As a future scope, the statistical analysis for weather forecasting, load forecasting, predictive maintenance, power quality balance and energy management can be carried out.
The author is thankful to Central Electricity Authority (CAE) for providing renewable energy data through open archive datasets.
[1] Awasthi, A., Shukla, A.K., SR, M.M., Dondariya, C., Shukla, K.N., Porwal, D., Richhariya, G. (2020). Review on sun tracking technology in solar PV system. Energy Reports, 6: 392-405. https://doi.org/10.1016/j.egyr.2020.02.004
[2] India to achieve most of COP 21 climate change goals in next 18 months: Modi. (2019). https://www.livemint.com/news/india/india-to-achieve-most-of-cop-21-climate-change-goals-in-next-18-months-modi-1566580252116.html, accessed on Jan.20, 2021.
[3] Raina, G., Sinha, S. (2019). Outlook on the Indian scenario of solar energy strategies: Policies and challenges. Energy Strategy Reviews, 24: 331-341. https://doi.org/ 10.1016/j.esr.2019.04.005
[4] Ul-Haq, A., Jalal, M., Sindi, H.F., Ahmad, S. (2020). Energy scenario in south asia: Analytical assessment and policy implications. IEEE Access, 8: 156190-156207. https://doi.org/10.1109/access.2020.3019648
[5] Kumar, D. (2020). Satellite-based solar energy potential analysis for southern states of India. Energy Reports, 6: 1487-1500. https://doi.org/ 10.1016/j.egyr.2020.05.028
[6] Srivastava, R., Tiwari, A.N., Giri, V.K. (2019). Solar radiation forecasting using MARS, CART, M5, and random forest model: A case study for India. Heliyon, 5(10): e02692. https://doi.org/10.1016/j.heliyon.2019.e02692
[7] Sueyoshi, T., Goto, M. (2019). Comparison among three groups of solar thermal power stations by data envelopment analysis. Energies, 12(13): 2454. https://doi.org/ 10.3390/en12132454
[8] Yao, D.L., Choi, S.S., Tseng, K.J., Lie, T.T. (2009). A statistical approach to the design of a dispatchable wind power-battery energy storage system. IEEE Transactions on Energy Conversion, 24(4): 916-925. https://doi.org/10.1109/tec.2009.2025331
[9] Li, P., Dargaville, R., Liu, F., Xia, J., Song, Y.D. (2015). Data-based statistical property analyzing and storage sizing for hybrid renewable energy systems. IEEE Transactions on Industrial Electronics, 62(11): 6996-7008. https://doi.org/10.1109/tie.2015.2438052
[10] Peruzzi, V.V., da Silva, G.A., Renaux, C., Flandre, D., Gimenez, S.P. (2018). Using statistical student’s t-test to qualify the electrical performance of the diamond MOSFETs. In 2018 33rd Symposium on Microelectronics Technology and Devices (SBMicro), pp. 1-4. https://doi.org/ 10.1109/sbmicro.2018.8511495
[11] Khan, K.S., Ali, S.M., Ullah, Z., Sami, I., Khan, B., Mehmood, C.A. (2020). Statistical energy information and analysis of Pakistan economic corridor based on strengths, availabilities, and future roadmap. IEEE Access, 8: 169701-169739. https://doi.org/10.1109/access.2020.3023647
[12] Central Electricity Authority. https://cea.nic.in/?lang=en, accessed on Jan.10, 2021.
[13] Kannal A. kaggle dataset, https://www.kaggle.com/anikannal/solar-power-generation-data, accessed on Dec. 20, 2020.
[14] Kovari, A. (2018). Using JASP in statistical evaluation based on an eye-tracking analysis. In 2018 9th IEEE International Conference on Cognitive Infocommunications (CogInfoCom), pp. 000237-000240. https://doi.org/10.1109/coginfocom.2018.8639885