Tareq Aziz Dawood![]() | Ramzi Raphael Ibraheem Barwari
| Ramzi Raphael Ibraheem Barwari![]() | Abdulrazzak Akroot*
| Abdulrazzak Akroot*![]()
© 2023 IIETA. This article is published by IIETA and is licensed under the CC BY 4.0 license (http://creativecommons.org/licenses/by/4.0/).
OPEN ACCESS
As an alternative to fossil fuels to protect the environment from harmful Pollutants and because of the negative impact of fossil fuels on the environment, the renewable energies necessary to use in the production of electrical energy have been studied. This inquiry focuses mostly on the use of solar power as new technology for electricity production. As part of this research, an investigation has been conducted to establish the quantity of solar radiation that hits the solar panels, the efficiency of these panels, and the factors affecting their performance. In addition to covering the entire surface with water and analyzing how well it performs during a rainstorm. The maximum production of electrical energy from the panels was obtained when the weather was clear at a rate of 237.5 kilowatts / square meter/month. The effect of temperature change and radiation on photovoltaic cells was studied. It was found that the highest current occurred at a temperature of 55℃. The effect of atmospheric humidity was studied and the effect of the productivity of solar panels. It was found that with increased humidity, the cells lose 30% of the total efficiency of electrical energy. The effect of dust accumulation on the panels was studied and it was found that the efficiency of the system decreases when the dust is increased on the solar panels. As for the effect of wind speed, it explained its impact in detail and its effect on solar panels. It also showed the effect of solar radiation and time on the voltage efficiency of solar cells. This study dealt with a simulation of solar cell efficiency to evaluate solar cell performance in different conditions and factors via MATLAB. This study concluded that maintaining the highest performance of solar cells and their durability is through maintaining the cleanliness of the panels and continuing their periodic maintenance. A comparison between the experimental and model simulation results confirmed the reality of the results, and indicate the validity of the exact model. These distinguished results of the study indicate that solar panels are the energy of the future., A comparison between the experimental and model simulation results confirmed the reality of the results, and indicate the validity of the exact model.
solar energy, renewable energy, PV, energy source, solar collectors, solar cells
Renewable energy is a natural resource that can replace it- self quickly and reliably. It has many abundant and sustainable sources. It is also environmentally friendly and has given the inhabitants of our planet a great choice! It is the opposite of the energy that we get from using fuel. It differs from the others in that its sources are perpetually renewed they cannot be altered, and utilization levels have no bearing on its supply.
In contrast, the energy generated from fuels such as (oil, coal, and others will have a specific life and be implemented while renewable energy is its source, Renewable energy is described as any form of energy that is swiftly provided by a different cycle, such as solar or wind energy and the vast majority of sources of energy that never run out, as opposed to geothermal and flowing energy, which are ultimately composed of the sun. Some structures do not include sun-dependent energy, such as rain and wind energy, which we consider to be transient solar energy. Yet, the energy accumulates in biomass over months, such as in straw, or for many years, as it does in wood. However, this cannot be obtained from the energy that is environmentally friendly through plants, creatures, and people, which leads to the depletion of resources over time, although non-renewable energy sources do not run out, assuming this is forever. Yet, its continuous use at specific rates will be exhausted in the present or the future. We can use renewable energy sources directly or create more suitable energy forms [1, 2].
Iraq, and especially the Kurdistan region, depends mainly on fossil fuels in all daily activities. Where the impact of this use was negatively reflected on the environment of the region in terms of affecting drinking water, sewage water, or the air system in general, so it became necessary to have radical solutions. The concept of renewable energies was considered an exclusive concept for the production of electric energy in a clean and safer manner. Where solar, wind or water energy can be used in general to produce electric energy in a sustainable manner. The Kurdistan region in general has a strategic location that is bordered by mountain ranges from the north, and it has a mild climate in summer and cold in winter, in addition to being a vital and excellent region for developing sustainable energies. Table 1 presents Kurdistan’s average monthly solar [3].
Table 1. Kurdistan’s average monthly solar [3]
|
Month Average |
Monthly Sunshine (h/month) |
Average Monthly Solar Radiation (Kwh/m2/month) |
|
Jan |
158.10 |
77.21 |
|
Feb |
160.79 |
91.03 |
|
Mar |
208.22 |
134.26 |
|
Apr |
209.00 |
154.51 |
|
May |
303.80 |
207.53 |
|
Jun |
375.00 |
237.22 |
|
Jul |
360.12 |
231.50 |
|
Aug |
360.12 |
219.73 |
|
Sep |
301.00 |
173.06 |
|
Nov |
255.49 |
131.97 |
|
Oct |
175.50 |
84.31 |
|
Dec |
112.38 |
60.78 |
|
Total |
2979.5 hr/year |
1803.09 kwh/m2/year |
|
Average |
8.16 h/day |
4.94 kwh/m2/d |
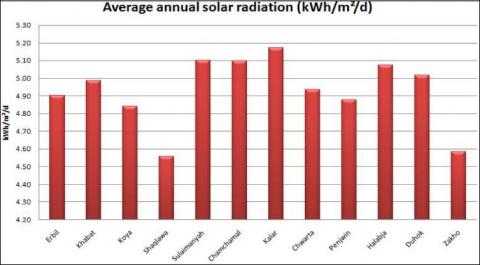
Solar Energy in Kurdistan and the average yearly solar radiation based on the areas where agro-meteorological stations are located. Figure 2 shows that the solar irradiance recorded by all the stations is relatively close except for Shaqlawa also Zakho because these two cities are located on the mountain's south side, and the solar irradiance is relatively low. The loss factor decreases solar radiation. Solar energy is abundant and well-distributed in Kurdistan (see Figure 3, the rate of heat distribution that distinguishes the Kurdistan region from the rest of the regions in the summer), but this enormous energy source has been neglected in the past while people have suffered from a drastic scarcity of energy sources.
This research dealt specifically with the study of solar cells as an alternative energy for the production of electrical energy from the sun. And studying the factors and variables affecting the panels, such as studying the effect of temperature, humidity, dust, wind speed and solar radiation time on the efficiency of electric energy production. In addition to studying the simulation of several variables of the factors of electric energy production on the MATLAB program and clarifying the effect of these variables on the productivity efficiency of solar cells for electric energy.
2.1 PV cell equivalent circuit model
Figure 4 depicts the ideal PV circuit concept. As a consequence, it consists of a (single diode D) that serves as the (PN) junction in a (PV) cell and a photo-generated current source (Iph) in parallel.
Figure 1 and Figure 2 depict, respectively, the period of insolation and the average yearly solar radiation based on Eq. (1) of the areas where agro-meteorological stations are located. Where Id is the diode current, ish is the shunt current, I is the terminal current, is diode saturation current, Vt thermal voltage, n quality factor, Rush shunt resistance, and Rs series.
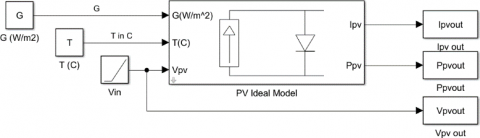
Figure 5, The PV voltage Vpv, temperature T, and solar irradiance G are the inputs to the MATLAB/Simulink model, and the (PV) current Ipv and power Ppv are the outputs. The simulated (I-V) curve of our (PV) cell (Table 2) is shown in Figure 6 using MATLAB. The maximum power point (MPP), where the PV outputs its maximum power, is indicated by the circle. The PV's open-circuit voltage (V), which is the voltage at 0 A of PV current, is indicated in (Figure 6). The short-circuit current, abbreviated ISC, is the current present when the PV voltage is 0.
Figure 1. The length of daylight in each region of Kurdistan
Figure 2. Yearly mean solar radiation [3]
Figure 3. Map of sun radiation across Kurdistan
Figure 4. A Perfect PV cell's electrical circuit schematic
Figure 5. MATLAB/Simulink model of a (PV) cell or panel with solar irradiance (G) and then Tempe (T) as inputs
Figure 6. (I-V) curve for a typical PV cell with (G = 1000 W/m2) and (T = 25℃); VOC stands for open-circuit voltage and ISC for short-circuit current
Table 2. The monthly values of solar radiation (March-April)
|
Time (hr) |
Solar radiation (w/m2) in March |
Solar radiation (w/m2) in April |
||||||
|
|
15 Mar |
20 Mar |
25 Mar |
30 Mar |
5 Apr |
10 Apr |
20 Apr |
25 Apr |
|
8:00 |
148 |
153 |
214 |
142 |
270 |
314 |
150 |
330 |
|
9:00 |
270 |
292 |
231 |
193 |
484 |
425 |
98 |
560 |
|
10:00 |
336 |
386 |
175 |
321 |
658 |
536 |
460 |
780 |
|
11:00 |
443 |
473 |
264 |
92 |
731 |
768 |
298 |
810 |
|
12:00 |
543 |
584 |
598 |
219 |
743 |
776 |
397 |
850 |
|
13:00 |
506 |
620 |
535 |
347 |
846 |
872 |
187 |
776 |
|
14:00 |
491 |
603 |
486 |
532 |
642 |
556 |
236 |
634 |
|
15:00 |
410 |
476 |
247 |
483 |
527 |
356 |
429 |
551 |
|
16:00 |
290 |
312 |
201 |
294 |
411 |
380 |
157 |
470 |
|
17:00 |
170 |
184 |
150 |
126 |
322 |
194 |
93 |
329 |
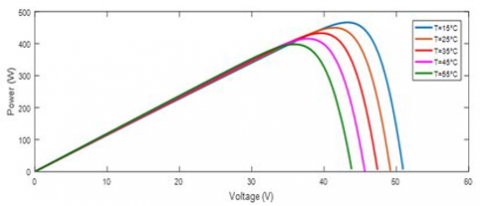
Figure 7. For instance, the power-voltage curve for a PV cell operating in a specific constant irradiance and temperate condition (i.e., G = 1000 W/m2) and (T = 25℃); (VOC: open-circuit voltage)
The power-voltage curve can be derived from the (I-V) curve of a (PV) cell or panel. Figure 7 depicts the power voltage curve for the I-V curve shown in Figure 6, with a star indicating the MPP, or maximum point of the curve. The (I-V) and power-voltage curves shown are based on a specific irradiance and temperature condition. Throughout the day, the irradiance and temperature will fluctuate, sometimes gradually, (from minutes to hours) and sometimes abruptly (from seconds to minutes), as when clouds pass by. Consider the I-V curves to be characteristics of a single point in time.
$I=I_{p h}-I_s\left(e^{\frac{V+I R_s}{N V_t}}-1\right)-\frac{V+I R_s}{R_p}$ (1)
3.1 Effect of temperature and irradiance variation on PV
The (PV) cells are temperature-sensitive. The dark saturation current increases as the cell temperature rise; additionally, the band gap narrows as less bond energy is required to form electron-hole sets, resulting in a decrease in Voc [4]. This implies that as cell Temp increases, the PV cell the current (ISC) increases significantly, as shown in Figure 8. Using Eq. (1) to solve for Voc, the following equation describes the linear relationship between Tempe and Voc [5].
$V_{o c}=\frac{n K T}{q} \ln \frac{I_{p h}}{I_0}$ (2)
In Figure 8, used a variety of irradiance and temperature values. There have been 25 simulations with multiple parameter changes. What is visible is the photovoltaic array's typical behavior. The power output increases as the irradiance (the amount of light) increase and decreases as the temperature rises. So there is a trade-off to consider: the lighter that hits the PV panel produces more power, which means more current is produced, which heats the PV panel and reduces its performance. Of course, there is a balance that optimizes all of these parameters and ensures that we are using the maximum amount of power for each amount of irradiance. Also, notice how the voltage at maximum power varies with irradiance.
Figure 8. The impact of multiple parameters on PV cell performance
3.2 Effect of humidity
In most cities with high humidity, where the average ranges between (401-781%), clouds and land masses absorb or reflect about 30% of the total solar energy that the sun emits. The solar energy that strikes the solar cell experiences energy losses (absorption and reflection), and these losses are in the range of (15-30%) of the energy [6]. Since humidity reduce solar radiation; energy is used by about 5% of solar cells. Only 70% of the total energy is used [7].
This difference appears to be non-linear. This effect will lead to a slight change in the magnitude of the Open circuit voltage (VOC) and a substantial variance in the short circuit current (ISC).
The effect of humidity on radiation and ISC is apparent, and this, in turn, will lead to a decrease in performance efficiency according to the following equation:
$\eta=\frac{V O C_{\max }. I S C_{\max }}{A C(\text { irradiance level })}$ (3)
Even though the test was designed to determine, the effect of relative humidity on the performance of three different types of photovoltaic cells: (Silicon) Monocrystalline, Polycrystalline, and Amorphous). The test results show that as relative humidity decreases, the generated current, voltage, and energy all increase, implying that the power efficiency of the solar cell must be high when relative humidity is low; that is, relative humidity reduction generally increases or increases the solar energy efficiency of the cell or photovoltaic system [8, 9].
3.3 Effect of dust accumulation
Sand dust damages solar photovoltaic (PV) applications in arid regions of the world. Particle accumulation on a photovoltaic (PV) module surface reduces illumination because the particles scatter, reflect, and absorb incoming light. Depending on their size, type, density, and length of settling, dust particles cause interference [9]. Particles fall due to gravitational, mechanical, or electrostatic forces (raindrops or an airstream). Once they have gathered, the effects of interface energy, also known as the fluctuating surface electrical field potential, and the forces of gravity and electrostatics confine them. Ariel dust is present in almost all ecosystems, but the type and size of the particles varies according on the region. Some areas have a drier climate that is more severe.
Many Iraqi researchers have investigated the effects of dust storms on the total rate of solar radiation in Kurdistan's cities. A study was conducted on a dust storm that occurred in Iraq, and the effect on the rate of solar radiation was significant. This storm caused a significant decrease in the rate of solar radiation compared to normal rates, resulting in a decrease in the performance efficiency of solar cells [10, 11].
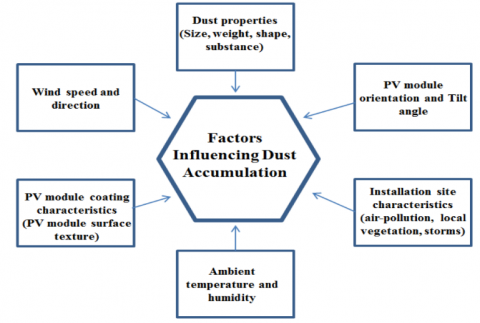
A variety of factors are said to influence dust deposition, including wind speed, electrostatic charges, gravitational forces, and surface moisture [12, 13].
Figure 9. Dust accumulation modifying variables [14]
Non-uniform dust deposition on the PV cell/module glass cover may result in the formation of layers with varying dust concentrations. The dust thickness and position of these layers vary, resulting in variable light transmission into the PV cell or module.
Figure 9 depicts the factors that influence the assimilation and deposition of dust [14]. Because there are so many things that can cause dust to build up, it is clear that it is hard to control and understand how dust builds up.
3.4 Wind effect
Wind energy is a globally successful alternative energy generation method, but wind velocity has an impact on the performance of PV systems. Indirectly, the sun is also responsible for wind energy and its effect on the efficiency of PV performance [15]. Because wind has a varying effect on photovoltaic cells, PV modules and systems are exposed to environmental influences, particularly wind, throughout the day.
The amount of effort required to force the wind can cause significant structural damage to the photovoltaic panel. If the wind speed is reduced by a maximum of 20%, the value of the structural costs of solar cells is found to fall by approximately 20%. Reduced wind speed, on the other hand, will have an effect on the performance of the system and should be carefully considered. Limiting airflow, as previously stated, may limit panel cooling, lowering photovoltaic cell performance.
Wind can irritate sand and dust in the air, causing it to settle and accumulate on photovoltaic cell surfaces. As a result, the overall effect lowers performance efficiency [16, 17]. Heat transfer is related to the direct or indirect effect of wind on.
3.5 Measurement of solar radiation over time
Weather has a great influence on the solar radiation value, so it is necessary to carry out statistical analysis and calculate by means of average or characteristic value. Installing it vertically with the sunrays and calculating the readings for every hour in a row, we start the measurement at exactly eight in the morning and continue until five in the evening. On 3/15/2022, the weather will be moderate, but on 3/25/2022, the weather will be uneven as there will be some clouds and intermittent periods in the morning that affect the values of solar radiation.
On the day of May 10–4, 2022, due to the weather being clear and no clouds scattering solar radiation, the value of solar radiation rises. The impact of solar radiation on the solar cell Because of the presence of clouds and intermittent rainfall on April 20, 2022, the value of solar radiation will vary.
Several trials were conducted to determine the efficiency of solar panels in various circumstances, as well as the effect of these conditions on the effectiveness and performance of solar panels. We can calculate the output of the solar panels for various amounts of dust and water by measuring solar radiation over time and joining these values into a MATLAB model. Then can be seen how these parameters affect the efficiency of the solar panels.
4.1 Theoretical model
Figure 10. Solar radiation component on a tilted surface
Figure 10 depicts the components of global solar radiation impacting an inclined surface for a tilted PV panel. Solar radiation is classified as direct (GB), diffuse (GD), or reflected (GR). These components can be articulated using [18, 19]
$G_{T, \beta}=G_{B, \beta}+G_{D, \beta}+G_R$ (4)
Eq. (4) on a horizontal surface, solar energy components may be rewritten as follows:
$G_{T, \beta}=G_B R_B+G_D R_D+G_T \rho R_R$ (5)
When (RB, RD, and RR) are coefficients, so is the Aledo constant. The global solar energy on a horizontal surface divided by global solar energy on an inclined surface is represented by (RB). (RD) represents the ratio of diffuse solar energy on a horizontal surface to diffuse solar energy on an inclined surface, and (RD) represents the factor of diffuse solar energy reflected on an inclined surface (RR). Using Eq. (5) The key to identifying solar energy components on an inclined surface is the coefficients RB, RD, and RR. The Liu and Jordan model is the most commonly used method for calculating RB. [20, 21] in which RB is defined as:
$R_B=\frac{\cos (L-\beta) \cos \delta \sin \omega_{S S}+\omega_{S S} \sin (L-\beta) \sin \delta}{\cos L \cos \delta \sin \omega_{S S}+\omega_{S S} \sin L \sin \delta}$ (6)
The most recommended equation for RR is given by
$R_R=\frac{1-\cos \beta}{2}$ (7)
Isotropic solar models are based on the assumption that the intensity of isotropic radiation remains constant regardless of observation direction, and that an isotropic field exerts the same force on a test particle regardless of its orientation. An isotropic radiator is a point source that emits equal amounts of radiation in all directions. One of the most popular isotropic diffuse solar models is the Liu and Jordan model, with RD defined as follows [22]:
$\mathrm{R}_{\mathrm{D}}=\frac{1+\cos \beta}{2}$ (8)
To study the factors affecting a solar panel, solar radiation with time is measured, and then MATLAB is implemented.
5.1 The results of measuring solar radiation with time
Table 2 also Figure 11 shows the values of solar radiation falling on a solar panel at different times. A solar radiation intensity meter (SM 206 SOLAR POWER METER) has been utilized. The intensity of solar radiation had measured on 15/3/2022.The amount of solar radiation measured at eight a.m. back then was (148 W/m2), while the intensity of solar radiation was (153 W/m2) on 20/3/2022 at the same time, and solar radiation continues to increase to reach more people. Its maximum value is in the afternoon when the radiation intensity is (543 W/m2), but on 20/3/2022, it will be around one o'clock in the afternoon when the solar radiation intensity is (620 W/m2). Then it begins to gradually decrease to reach the intensity of solar radiation to about (184 Watts/m2) at five o'clock in the evening. On 20/3/2022, while the strength of the solar radiation reaches about (170 Watts/m2) at five o'clock in the evening, the decrease in the value of the solar radiation continues. Until the intensity of solar radiation becomes zero at sunset for both. The explanation behind the variance in solar radiation values for both days is that the Earth is on an elliptical path and because the angle of the sun with the Earth is constantly changing, the value of the incident solar radiation will vary daily with a different angle of the sun [20].
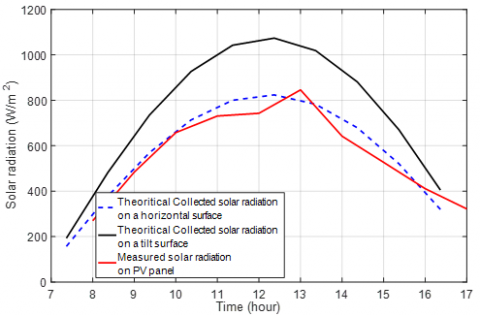
Figure 12 depicts the results of theoretical models supported by practical data for the global radiation on the horizontal plane of the hybrid solar collector under clear sky conditions. Therefore, can be seen that the theoretical calculation of solar irradiation on an inclined surface and the experimental data agree perfectly.
Figure 11. The change of solar radiation with time for the day (2022)
Figure 12. Monthly solar irradiance estimation utilizing the Liu and Jordan model
5.2 The result of the factors affecting the efficiency of the solar cell
5.2.1 Numerical simulation for the effect of dust on the PV panel
Firstly, we need a fitting equation of the solar irradiation to implement it in the Simulink model. It was collected as a sample on March 20, 2022. Two terms of the Fourier series have been taken as a fitting equation:
$\begin{gathered}\mathrm{I}_{\mathrm{r}}=\mathrm{a}_0+\mathrm{a}_1 \cos (\omega t)+\mathrm{b}_1 \sin (\omega t)+\mathrm{a}_2 \cos (2 \omega t)+ \mathrm{b}_2 \sin (2 \omega t)\end{gathered}$ (9)
The following coefficients have been found
|
a0 |
380.7 |
|
a1 |
135.5 |
|
b1 |
205.1 |
|
a2 |
-22.71 |
|
b2 |
-18.97 |
|
ω |
0.5679 |
The negative value for b2 means that the second harmonic component (2ωt) of the waveform has a phase shift of π radians or 180 degrees with respect to the reference cosine wave. This means that when the reference cosine wave is at its maximum, the second harmonic sinusoidal wave will be at its minimum, and vice versa. The negative value for a2 means that the amplitude of the second harmonic component (2ωt) of the waveform is equal to the amplitude of the reference cosine wave, but with a phase shift of π radians or 180 degrees. This means that when the reference cosine wave is at its maximum, the second harmonic cosine wave will be at its minimum, and vice versa. Alternatively, one could say that the second harmonic component has been inverted or flipped about the horizontal axis. a negative value for a2 means that this component has been inverted or flipped about the horizontal axis. Physically, this could represent a system or signal in which certain frequency components are attenuated or inverted relative to others, resulting in a waveform with a complex and perhaps non-sinusoidal shape. For example, this could occur in a nonlinear electrical circuit. negative value for b2 means that this component is shifted in phase by π radians or 180 degrees relative to the reference cosine wave. Physically, this could represent a system or signal in which certain frequency components have a different phase relationship than others, resulting in a waveform with a complex and perhaps non-sinusoidal shape. For example, this could occur in a system with multiple modes of vibration or resonance. The correlation coefficient between the data and the analytical function is 0.9955.
Figure 13 Solar irradiance fitted with Eq. (9) exhibits the experimental data as well as the fitting curve.
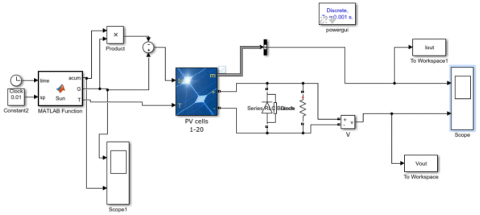
The following Simulink model (Figure 14) calculates the effect of dust accumulation utilizing Eq. (9). We suspected a build-up of linear dust on the PV panel.
The voltage versus time curves for the dusty and reference (PV) panels are shown in (Figure 15) to assess the electrical performance of the dusty (PV) panel in comparison to the reference (PV) panel. It has already been determined that for a dust collection rate of 0.01, the average loss in output voltage relative to the reference PV panel is around 14%. The dusty PV panel was found to have a lower total wattage potential than the reference PV panel.
As a result of the findings from (Figure 15), it has been observed that there is a reduction in the unit's voltage and output power. When dust particles accumulate on the solar cell's surface, it will lead to a decrease in its output energy, depending on the accumulated dust masses and their type.
Through the above experiments, we note that the cleaner the solar cell is, the higher the efficiency of its performance. Conversely, the greater the amount of dust deposited on it, the lower its performance.
Figure 13. Solar irradiance fitted with Eq. (9)
Figure 14. The MATLAB Simulink model for analysis of different dust accumulation speeds on PV pane. L
Figure 15. Dusty & reference PV panel contours
5.2.2 The results of performance efficiency when the amount of dust is low
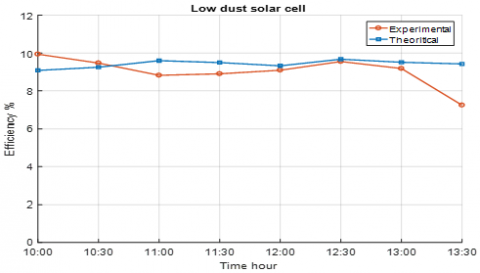
For the case where the dust density on the solar cell surface was low and the weather was clear, a MATLAB Simulink was advanced.
From Figure 16, we see that the experimental and theoretical calculations of the effectiveness of the solar cell will decrease by less than when the cell is clean, because of dust particle deposition and adhesion to the solar cell surface. Therefore, the permeability of the glass surface of the cell will also decrease, which will result in a decline in both efficiency and capacity, and this is consistent with previous studies in this matter.
Figure 16. Experimental and theoretical of the cell efficiency with time when the amount of dust is low
5.2.3 The results of performance efficiency when the dust density is high
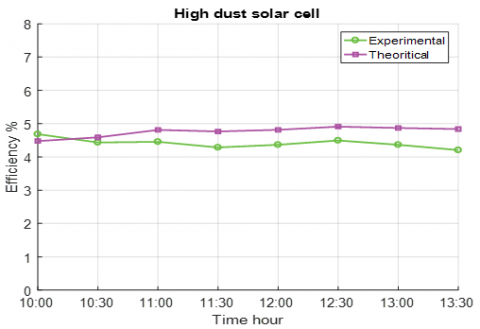
Figure 17 demonstrates how both experimental and theoretical efficiency has decreased dramatically, nearly to their value when the solar cell is clean (i.e., the amount of dust is zero). The reason for this is that the dust density has increased. As a result, the transmittance decreases resulting in the solar cell blocking some of the incoming solar radiation. The greater the dust density, the lower the transmittance of the glass to the passage of sunlight, and this was mentioned in previous studies as well. The principle of curve continuity, also known as the law of curve change, is a fundamental mathematical concept that asserts that a smooth curve should have a gradual change in direction without any sudden breaks or changes. This principle is widely used in calculus and other mathematical disciplines to describe and analyze the behavior of curves and functions. Moreover, in computer graphics and modeling, creating visually appealing and realistic shapes often requires the use of smooth and continuous curves, making the principle of curve continuity a vital component in these fields. Practically speaking, the principle also suggests that when two or more curves intersect, they should do so smoothly and without sudden changes in direction, ensuring that the resulting shape is visually pleasing and behaves predictably.
Figure 17. The change of experimental and theoretical cell efficiency with time when the amount of dust is high (MATLAB)
If the amount of dust increases and covers the entire surface of the cell in a very high amount, then the efficiency of the cell does not exceed 1%, which is the lowest value, because the high amount of dust prevents the transmittance of radiation completely. After all, the dust formed on the cell surface will scatter and reflect solar radiation.
Through the above experiments, we note that the cleaner the solar cell is, the higher the efficiency of its performance. Conversely, the greater the amount of dust deposited on it, the lower its performance for it.
5.2.4 The results when the weather is overcast, and the surface of the solar cell is immersed
From Figure 18, we find that the greatest value for efficiency and capacity when the surface of the panels is immersed in rainwater is (5.26%), (27.89wattst), and the lowest value is (3.88%), (27.4wattstt).
Figure 18. Experimental and theoretical change of cell efficiency with time due to rainy and cloudy weather
Through the above, we note that the greatest efficiency of the solar panel in cloudy weather is when its surface is dry, as it is greater than the maximum value of the efficiency of the same cell when its surface is flooded with rainwater. The reason for this is that rainwater is impure because it contains impurities or atmospheric plankton, which causes them to be deposited on the cell's surface and thus block a large part of the solar rays. As for the lowest value for efficiency, we find that it is for the dry solar panel as well. The reason for this is the difference in the density of the clouds present, as it is greater for a solar cell with a dry surface compared to a cell with a dry surface. The surface is flooded with water, so the decrease in solar radiation will be greater as the intensity increases. It will prevent the majority of solar radiation from trying to reach the solar cell.
5.2.5 Partial shading effects
The neighboring towering buildings and weather circumstances such as stormy weather and shifting clouds produce partial shadowing. It was discovered that an unshaded module [21] produced more energy than a shaded module. Due to its cascade connection, the current traveling through various modules inside a module is the same. This results in darkened cells carrying more power than their short-circuit ratings allow. This creates a voltage with the appropriate polarity on the shaded cells. Consequently, there is an overall decrease in system voltage. These cells reduce the system's power loss and function as though a new load has been introduced. The current in a cascaded connection of cells cannot exceed the current through the cell with the highest amount of shading, and the power loss in shaded cells has a detrimental impact on neighboring cells. The loss of power in darkened cells leads to the establishment of hotspots, leading to the failure of the complete PV array.
Figure 19: Visible on the PV and VI curves of the cascaded solar panels is the variation of voltage and power caused by shading or varying solar radiation availability.
Figure 19. PV and VI curves as a result of partial shading
Based on this solar radiation analysis, we conclude that Iraqi Kurdistan have adequate exposure.
Dust accumulation on solar panel surfaces reduces efficiency, which is inversely proportional to dust density, the greater the dust accumulation, the lower the efficiency.
Rain reduces solar panel efficiency, which has been observed to decrease when it rains. The rainfall and the number of planktons in the air at the time establish this loss.
Based on MATLAB simulation, it is found that the worst efficiency is obtained in these cases:
The amount of dust is high.
The weather is cloudy and the cell surface is flooded with rain.
|
n |
ideality factor |
|
ω |
Hour angle |
|
ωss,sr |
Sunrise and sunset hour angles |
|
vt |
Thermal voltage |
|
η |
The efficiency |
|
Rsh |
Shunt resistor |
|
Rs |
Series resistance |
|
G |
Irradiance |
|
T |
Temperature |
|
Ppv |
Power of photovoltaic cell |
|
Vpv |
Voltage of photovoltaic cell |
|
Ipv |
Current of photovoltaic cell |
|
Isc |
Short-circuit current |
|
Voc |
Open-circuit voltage |
|
Imp |
Maximum power current |
|
K |
Boltzmann constant |
|
q |
Electron charge |
|
Ac |
Area of a solar cell unit |
|
GB,β |
direct solar radiation |
|
GD,β |
diffused solar radiation |
|
GR |
reflected solar radiation |
|
RB |
ratio between global solar energy on a horizontal surface and global solar energy on a tilted surface |
|
RD |
ratio between diffuse solar energy on a horizontal surface and diffuse solar energy on a tilted surface |
|
RR |
factor of reflected solar energy on a tilted surface |
|
L |
Longitude |
|
Greek symbols |
|
|
β |
Angle of PV panel with ground |
|
$\delta$ |
Solar declination angle |
|
θ |
Azimuth angle |
The Matlab Simulink model was used to analyze the effects of various variables on the performance of solar cells. The outputs of the panels (grid current, grid voltage, and grid power) are derived by entering the irradiation and temperature values into the model and accounting for the dust coefficient. The other components also go through the same processes.
Figure (A-1). The PV Matlab system is depicted to calculate PV current while taking dust into account
[1] Ahmed, O.K., Mohammed, Z.A. (2017). Influence of porous media on the performance of hybrid PV/Thermal collector. Renewable Energy, 112: 378-387. https://doi.org/10.1016/j.renene.2017.05.061
[2] Bollinger, J.D. (2007). Applications of solar energy to power stand-alone area and street lighting. Master theses. University of Missouri—Rolla.
[3] Husami, M.S. (2007). Energy crisis in Kurdistan and the impact of renewable energy. University of Strathclyde. Glasgow.
[4] Luque, A., Hegedus, S. (Eds.). (2011). Handbook of Photovoltaic Science and Engineering. John Wiley & Sons.
[5] Vergura, S. (2016). A complete and simplified datasheet-based model of PV cells in variable environmental conditions for circuit simulation. Energies, 9(5): 326. https://doi.org/10.3390/en9050326
[6] Han, X., Wang, Y., Zhu, L., Xiang, H., Zhang, H. (2012). Mechanism study of the electrical performance change of silicon concentrator solar cells immersed in de-ionized water. Energy conversion and management, 53(1): 1-10. https://doi.org/10.1016/j.enconman.2011.08.011
[7] Panjwani, M.K., Narejo, G.B. (2014). Effect of humidity on the efficiency of solar cell (photovoltaic). International Journal of Engineering Research and General Science, 2(4): 499-503.
[8] Darwish, Z.A., Kazem, H.A., Sopian, K., Alghoul, M.A., Chaichan, M.T. (2013). Impact of some environmental variables with dust on solar photovoltaic (PV) performance: review and research status. International Journal of Energy and Environment, 7(4): 152-159.
[9] Kazem, H.A., Chaichan, M.T., Al-Shezawi, I.M., Al-Saidi, H.S., Al-Rubkhi, H.S., Al-Sinani, J.K., Al-Waeli, A.H. (2012). Effect of Humidity on the PV Performance in Oman. Asian Transactions on Engineering, 2(4): 29-32.
[10] Salim Akhter, M., Madany, I.M. (1993). Heavy metals in street and house dust in Bahrain. Water, Air, and Soil Pollution, 66: 111-119. https://doi.org/10.1007/BF00477063
[11] Draxler, R.R., Gillette, D.A., Kirkpatrick, J.S., Heller, J. (2001). Estimating PM10 air concentrations from dust storms in Iraq, Kuwait and Saudi Arabia. Atmospheric Environment, 35(25): 4315-4330. https://doi.org/10.1016/S1352-2310(01)00159-5
[12] Mani, M., Pillai, R. (2010). Impact of dust on solar photovoltaic (PV) performance: Research status, challenges and recommendations. Renewable and Sustainable Energy Reviews, 14(9): 3124-3131. https://doi.org/10.1016/j.rser.2010.07.065
[13] Goossens, D., Van Kerschaever, E. (1999). Aeolian dust deposition on photovoltaic solar cells: the effects of wind velocity and airborne dust concentration on cell performance. Solar Energy, 66(4): 277-289. https://doi.org/10.1016/S0038-092X(99)00028-6
[14] Maghami, M., Hizam, H., Gomes, C., Hajighorbani, S., Rezaei, N. (2015). Evaluation of the 2013 southeast asian haze on solar generation performance. PloS One, 10(8): e0135118. https://doi.org/10.1371/journal.pone.0135118
[15] Ettah, E.B., Eno, E.E., Udoimuk, A.B. (2009). The effects of Solar panel temperature on the power output efficiency in Calabar, Nigeria. The Effects of Solar Panel Temperature on the Power Output Efficiency in Calabar, Nigeria, 23: 1-7. https://doi.org/10.48153/jrrs//2009/IAXK8286
[16] Abd‐almohi, H.H., Alismaeel, Z.T., M‐Ridha, M.J. (2022). Broad‐ranging review: Configurations, membrane types, governing equations, and influencing factors on microbial desalination cell technology. Journal of Chemical Technology & Biotechnology, 97(12): 3241-3270. https://doi.org/10.1002/jctb.7176
[17] Kannan, N., Vakeesan, D. (2016). Solar energy for future world: - A review. Renewable and Sustainable Energy Reviews, 62: 1092-1105. https://doi.org/10.1016/j.rser.2016.05.022
[18] Abd-almohi, H.H., Alismaeel, Z.T., M-Ridha, M.J. (2022). Study of microbial desalination cell performance; Power generation and desalination efficiency using pure oxygen in a cathode chamber. Al-Khwarizmi Engineering Journal, 18(3): 37-47. https://doi.org/10.22153/kej
[19] Meinel, A.B., Meinel, M.P. (1977). Applied solar energy: an introduction. NASA STI/Recon Technical Report A, 77: 33445.
[20] Schwingshackl, C., Petitta, M., Wagner, J.E., Belluardo, G., Moser, D., Castelli, M., Zebisch, M., Tetzlaff, A. (2013). Wind effect on PV module temperature: Analysis of different techniques for an accurate estimation. Energy Procedia, 40: 77-86. https://doi.org/10.1016/j.egypro.2013.08.010
[21] Liu, B.Y., Jordan, R.C. (1960). The interrelationship and characteristic distribution of direct, diffuse and total solar radiation. Solar Energy, 4(3): 1-19. https://doi.org/10.1016/0038-092X(60)90062-1
[22] Pan, C.A., Dinter, F. (2017). Combination of PV and central receiver CSP plants for base load power generation in South Africa. Solar Energy, 146: 379-388. https://doi.org/10.1016/j.solener.2017.02.052