Dina Limbong Pamuttu![]() | Muh. Akbar*
| Muh. Akbar*![]() | Adik Putra Andika
| Adik Putra Andika![]() | Hariyanto Hariyanto
| Hariyanto Hariyanto![]()
© 2023 IIETA. This article is published by IIETA and is licensed under the CC BY 4.0 license (http://creativecommons.org/licenses/by/4.0/).
OPEN ACCESS
The potential for hybrid combinations using solar and wind energy can be found in several places, one of which is on the highway. Highways are open areas exposed to direct sunlight and wind can blow forming natural wind tunnels. In addition, vehicles that pass on the road also generate wind which can then be used as an energy source. The purpose of this study is to find out how significant the potential for hybrid energy is by utilizing a combination of solar energy and wind energy obtained from utilizing traffic flow. The method used in this study is an experimental method by testing how much energy is obtained from sunlight by using a solar cell 50 Wp and wind energy by using a technological innovation Veritkal Axis Wind Turbine (VAWTs) 300 watts as a producer of electric power on the highway by utilizing two types of wind at once, namely atmospheric scale wind that blows naturally and wind from vehicle traffic on the highway. Current, voltage, and power measurements are then measured using a digital watt meter. The study's results found that the combined potential of solar energy and wind energy obtained from utilizing traffic flow was 552.11 watts, greater than just using a naturally blowing engine with a power of only 498.67 watts. This energy difference occurs due to an increase in wind frequency generated by traffic flow by 22%.
renewable energy potential, hybrid renewable energy, traffic flow
Energy needs are currently increasing in both developed and developing countries such as Indonesia. This increasing need for energy is due to population growth, economic growth, and very free energy consumption patterns [1, 2]. Most of the energy we use now comes from petroleum, it is non-renewable and will run out if we use it continuously. Currently, petroleum accounts for 45% of all energy produced worldwide and are the fuel that fulfills 96% of the needs of the world's mobilization sector [3]. Oil is also the glue that holds the global economy together, which causes the economies of countries in the world to mutually influence each other. In 2019 more than 66% of oil is traded internationally [4, 5]. A slight shift in oil prices could impact activity around the world. Starting from this, it is necessary to look for other alternatives, namely empowering and utilizing renewable energy sources [6, 7].
Renewable energy can be affected by the geographic location of a region. Indonesia which is on the equator should be able to take advantage of the potential of existing renewable energies such as solar energy, wind energy, water energy, wave energy, and geothermal energy as alternative energy [8]. Renewable energy sources are expected to have an active role in future energy diversification scenarios because they are friendly to the environment and have reserves that never run out [9]. For example, the potential for solar energy in Indonesia reaches around 4.8 KWh/m2 or the equivalent of 112,000 GWp, while wind energy has a potential of 978 MW [8, 10]. This potential can be used as an alternative energy source and its availability is also very adequate. Even so, its use is still relatively small, namely under 5% [11]. The development of these two alternative energy sources is strongly influenced by the climate and contours of an area, for this reason innovation and the latest technology are needed to optimize this energy [12, 13].
The management of the energy sector needs to be improved and reformed following the latest technological trends, namely using a combined renewable energy system (hybrid system) [14, 15]. One of the strategies for optimizing hybrid energy is by investigating the potential of hybrid renewable energy. In this study, it is known that the combination of solar and wind energy is the best energy combination based on a comparison of the value of the Net Present Cost (NPC) reaching USD 696,083 [16]. Another advantage is also because the wind has a close relationship with sunlight. Areas exposed to a lot of sun exposure will have higher temperatures and lower air pressure than other areas around them, causing airflow [17]. This is evident when during the day the wind moves faster than at night. The analysis review suggests that the potential for a combination of solar energy and wind energy is superior in hybrid energy compared to other energy combinations [17, 18].
The potential combination of solar and wind energy can be found in several places, one of which is on the highway. The highway is an open area exposed to direct sunlight and the wind can blow to form a natural wind tunnel with a speed of 3-4 m/s with an average frequency of 5%. This speed meets the requirements in the utilization of wind energy, namely ≥2.5 m/s [19]. There have been many studies on the utilization of wind on an atmospheric scale and show the results that this atmospheric scale wind can produce energy on a small scale [20-22]. Still, not many studies have been conducted on how to increase and maximize the utilization of wind energy by utilizing traffic flows. vehicles passing on a road.
This study will examine the increase in wind energy by testing the average wind speed frequency by utilizing wind energy generated by traffic flow. This is caused by the movement of the vehicle which pushes the air around it to move elsewhere. The volume and speed of traffic flow greatly affect the speed and frequency of the resulting wind in generating energy [1, 23]. The advantage of this research is to examine the potential of hybrid energy with a combination of two types of wind energy at once, namely atmospheric wind and wind effect of vehicle traffic flow which is then paired with solar energy.
Research on the utilization of traffic as wind energy combined with solar energy is still very limited. Only a small amount of scientific literature includes this study. Therefore this research is very important to do and is expected to be a scientific reference contribution and usefulness for the Vertical Axis Wind Turbine (VAWTs) technology as a source of electrical energy found on the highway.
This research starts by analyzing the number of vehicles that pass on the road for 12 hours starting at 06.00 to 17.00 EIT [24]. This volume is taken to determine the peak hours of vehicles passing on one day. Peak hours are used to compare the effect of vehicle volume and vehicle speed on traffic winds [25]. A sampling of vehicle speed is carried out simultaneously with data collection of wind energy generated by passing vehicles. At the same time data collection of solar energy generated through solar cells on the road was also carried out. As for wind energy on an atmospheric scale, it is carried out in open spaces around the road. This is because the atmospheric scale wind energy data obtained is not disturbed by wind displacements caused by traffic movements and is still relevant because the sample locations are still within an adjacent radius [26]. After this data is obtained, an analysis of hybrid energy calculations is carried out which is obtained from solar energy and wind energy that utilizes traffic flow. The average frequency of wind speed is a variable that will determine the effect of traffic on the hybrid energy potential on the highway.
The purpose of this study is to find out how big the potential for hybrid energy is by utilizing a combination of solar energy and wind energy obtained from utilizing traffic flow.
This study is very useful for the development of knowledge about the use of renewable energy. With the potential for hybrid energy on the road, it is hoped that it can support hybrid renewable energy using Vertical Axis Wind Turbines (VAWTs) and solar cell technology [27].
The structure of the article consists of an initial introduction, research motivation, and potential and goals of hybrid energy by utilizing traffic flow. The second part describes the method, implementation time, place of the research and data collection techniques. The third section shows the results and the discussion of each finding in the form of potential solar and wind energy generated in detail through graphs and tables. The last section shows the conclusion in the form of the potential magnitude of hybrid technology that utilizes traffic flow.
This study uses an experimental method, namely testing the potential of solar energy and wind energy to be measured as potential hybrid renewable energy sources. The analysis was carried out in three stages, namely wind speed data collection and solar energy potential data collection by measuring the voltage and currently taken from the output of the solar panel [19].
2.1 Time and place of research
This research was conducted from January - June 2022. The research location is on Jalan Raya Mandala which is an urban area with a primary arterial road function classification. Jalan Raya Mandala is the main road in Merauke Regency, Papua Province in Indonesia. This road is quite busy with the highest traffic generation in Merauke Regency. Research time division using the international time zone Greenwich Mean Time (GMT) +9 or Eastern Indonesia Time (EIT).
2.2 Data collection
2.2.1 Traffic flow data
Analysis of traffic data using the Road Capacity Manual in Indonesia (MKJI) method which was carried out on Jalan Raya Mandala, Merauke City, included a traffic volume survey (Traffic Counting), which divided all types of vehicles that passed through this road including heavy vehicles, light vehicles and motorcycle [28]. The survey was carried out for 7 days on weekdays and weekend with sunny weather [29, 30]. Observations were carried out for 12 hours starting at 06:00–17:00 EIT. The Traffic volume data collection is not carried out at night due to decreased activity in Merauke at that time, which the city is only one of the small cities in Indonesia. In addition to traffic volume data, vehicle speed data is also measured using a speed gun and speed maximization is formulated through an analysis of the free flow of light vehicles on MKJI. Traffic flow data is then used as a reference for the influence of wind data.
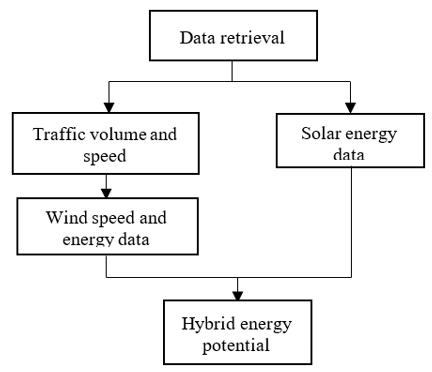
The research of hybrid energy potential scheme can be seen in the flowchart according to Figure 1 as follow:
Figure 1. Hybrid energy potential scheme
2.2.2 Solar and wind data
The solar panel used is a capacity of 50Wp. Parameters observed included measurements of current and voltage magnitudes periodically for 12 hours, namely at 06:00–17:00 EIT. These parameters are recorded once every hour on the measuring instrument used in the test. Generally, the measurement of electric charge in solar cells is used by ammeters and voltmeters to measure voltage (v) and current (a), but in this study, a digital watt meter measuring device is used which functions to simultaneously measure voltage (v), current (a), power (w), charge (ah) and energy (wh) generated in the measurement renewal period of 400mS [31].
Data Wind speed data was measured using an anemometer for 12 hours, namely at 06:00 - 17:00 EIT. In addition to measuring wind speed, measurement of wind energy output is also carried out using a vertical axis wind turbine (VAWT) with three blades at the same time. This turbine is equipped with a 300-watt DC generator which is then connected to a power measuring device, namely a digital watt meter [32, 33]. his measurement is taken in two places, namely on the median of the road as wind data that utilizes traffic flow and on open yards around the road as atmospheric wind data.
3.1 Analysis of traffic flow and vehicle speed
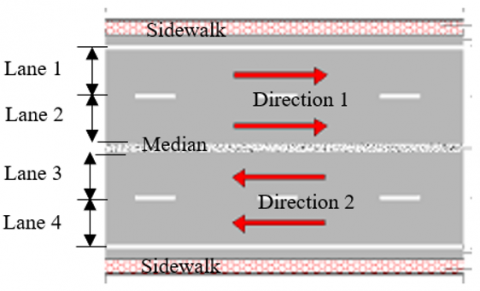
This measurement was carried out according to MKJI guidelines. The type of lane configuration on Jalan Raya Mandala is 4/2 D, which is a four-lane-two-way road category with a road median whose depiction can be seen in Figure 2.
Figure 2. Mandala highway lane configuration
The road profile is the width of the 1st direction = 7.3 meters, the 2nd direction = 7.3 meters wide, the median road width = 1 meter, and the sidewalk width = 1.5 meters.
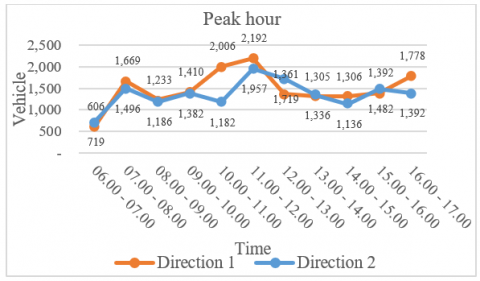
The process of collecting vehicle volume data is assessed every 1 hour starting at 06:00 – 17:00 EIT with sunny weather which aims to get the peak hour value of the vehicle. The Traffic volume data collection is not carried out at night due to decreased activity in Merauke at that time, which the city is only one of the small cities in Indonesia. The results of the analysis of peak hour data and traffic volume are as follows:
Figure 3. Vehicle peak hours
Direction 1 is the Merauke City route towards the Airport which is shown by the blue line, while direction 2, or the opposite direction is the Merauke City route towards the Harbor which is shown by the blue line. Figure 3 shows peak average vehicle traffic volume for 7 days that the peak hour for Jalan Raya Mandala traffic occurs for 1 hour in each time division. Peak hours in the morning are 07:00 – 08:00 EIT, during the day at 11:00 – 12:00 EIT, and in the afternoon at 16:00 – 17:00 EIT. These two directions have different traffic volumes where direction 1 has the highest number of vehicles at 2,192 vehicles/hour during the noon peak hours at 11:00-12:00 EIT and direction 2 has the same peak hours, namely at 11:00 a.m. 00-12:00 EIT with a relatively lower number of vehicles, namely 1,957 vehicles/hours.
Processing of vehicle volume data is taken for 7 days and calculations are carried out using the MKJI method with units of vehicles per hour (vhc/hr) which can be seen in full in table 1 as follows:
Table 1. Average traffic volume data in one week
|
Day |
Heavy Vehicle (HV) |
Light Vehicles (LV) |
Motorcycle (MC) |
Total |
|
vhc/hr |
vhc/hr |
vhc/hr |
vhc/hr |
|
|
Monday |
42 |
524 |
2,612 |
3,178 |
|
Tuesday |
44 |
544 |
2,526 |
3,114 |
|
Wednesday |
39 |
560 |
2,605 |
3,204 |
|
Thursday |
39 |
573 |
2,491 |
3,103 |
|
Friday |
37 |
570 |
2,593 |
3,200 |
|
Saturday |
35 |
579 |
2,613 |
3,227 |
|
Sunday |
49 |
423 |
2,416 |
2,888 |
|
Average |
41 |
539 |
2,551 |
3,131 |
Table 1 shows the results of the survey's average traffic volume for 7 days, reaching 3,131 vehicles/hours. Based on the passenger car unit value (pcu/hour), the average number of vehicles will be multiplied based on the vehicle type coefficient value. For heavy vehicles, the coefficient value according to traffic volume is 1.2, while for light vehicles it is 1.0 and for motorbikes, it is 0.25. The calculations can be seen in Table 2:
Table 2. Average traffic volume in passenger car units per hour (smp/hours)
|
Day |
Heavy Vehicle (HV) |
Light Vehicles (LV) |
Motorcycle (MC) |
Total |
|
Emp 1.20 |
Emp 1.00 |
Emp 0.25 |
smp/hours |
|
|
smp/hours |
smp/hours |
smp/hours |
||
|
Monday |
50 |
524 |
653 |
1,227 |
|
Tuesday |
53 |
544 |
631 |
1,228 |
|
Wednesday |
47 |
560 |
651 |
1,258 |
|
Thursday |
47 |
573 |
623 |
1,242 |
|
Friday |
45 |
570 |
648 |
1,263 |
|
Saturday |
42 |
579 |
653 |
1,274 |
|
Sunday |
59 |
423 |
604 |
1,086 |
|
Average |
49 |
539 |
638 |
1,226 |
Table 2 shows the difference in the number of statistical data between weekdays (Monday-Thursday) and weekends (Saturday-Sunday). The difference occurs because the activities are carried out differently where Monday to Friday is a routine as a working day with an average traffic volume between 1,227 – 1,263 smp/hours. Yet, the average peak traffic volume actually occurs during the weekend. on Saturday, which increased by 1,274 smp/hours. This happens due to the large number of people who do mobility for vacation simultaneously.
Further analysis needs to be done to determine the level of traffic density. Are the thousands of vehicles classified as dense traffic so that vehicle speed decreases and does not have the potential to generate wind energy or is the traffic still under control so that vehicles are still free to determine their vehicle speed? This analysis can be seen in the calculation of the value of the degree of saturation (DS) of traffic using the MKJI method.
3.1.1 Free flow speed of light vehicles
Basic free flow speed (FV0) = 57 km/hours
The adjustment factor for lane width (FVW) = 1.2 km/ hours
Side resistance (FFVSF) = 0.97
City size (FFVCS) = 0.97
So, the free flow speed of light vehicles (FV)
FV = (FV0 + FVW) x FFVSF x FFVCS
= (57 + 1.2) x 0.97 x 0.93
= 53 km/ hours
3.1.2 Capacity
Base Capacity (Co) = 4 x 1,650 lane/ hours
= 6,600 smp/ hours
Effective Path Width Factor (FCW) = 1.02
Directional Separating Factor (FCSP) = 1.00
Side Resistance Factor (FCSF) = 0.95
City Size Factor (FCCS) = 0.90
Then, Road Capacity (C) = (C0 x FCW x FCSP x FCSF x FCCS)
= (6,600 x 1.02 x 1.0 x 0.90 x 0.93)
= 5,755.86 ≈ 5,756 smp/ hours
Total flow (Q) average/day = 1,226 smp/hours
Road capacity (C) = 5,756 smp/ hours
Then, DS = Q/C
=1,226 /5,756
= 0.21 ≈ B
Table 3. Average vehicle speed data in one week
|
Day |
Heavy Vehicle (HV) |
Light Vehicles (LV) |
Motorcycle (MC) |
Average |
|
vhc/hr |
vhc/hr |
vhc/hr |
vhc/hr |
|
|
Monday |
42 |
39 |
35 |
38 |
|
Tuesday |
43 |
40 |
35 |
39 |
|
Wednesday |
43 |
41 |
34 |
39 |
|
Thursday |
41 |
39 |
34 |
38 |
|
Friday |
41 |
40 |
35 |
39 |
|
Saturday |
42 |
40 |
35 |
39 |
|
Sunday |
42 |
40 |
35 |
39 |
|
Average |
42 |
40 |
35 |
39 |
From the MKJI analysis, the value of the degree of saturation (DS) of traffic on Jalan Raya Mandala is B, which means that the traffic flow is stable and allows vehicle drivers to have sufficient freedom to choose their speed. These results also indicate that passing vehicles have the potential to generate wind effects that can be utilized as wind energy. Measuring vehicle speed data can be an illustration of how fast vehicles are passing on Jalan Raya Mandala. Vehicle speed data was taken for 7 days using a speed gun which was carried out at the same time as measuring traffic volume by taking a sample of 30 vehicles for each type of vehicle. The vehicle speed data has been converted from mph units to km/h units, the details of which can be seen in Table 3.
The average speed data obtained based on measurements using a speed gun can then be maximized by adjusting the speed chart according to the MKJI guidelines which are based on the degree of saturation data and the free flow speed data for light vehicles. The adjustments can be seen in Figure 4.
With a maximized speed, it increases the chance of increasing the wind speed obtained from the effects of passing vehicles.
Figure 4. Traffic speed adjustment
3.2 Potential of wind energy
Based on the graph of peak vehicle hours in Figure 3, it is known that there are 3 peak hours, namely morning, afternoon, and evening, each of which has 1 peak hour with a value of the degree of saturation (Q/C) of 0.21 or equivalent to the level of service B which indicates that traffic is still under control so that vehicles are still free to determine their vehicle speed and at that speed, the flow of vehicle traffic has the potential to produce wind effects when passing.
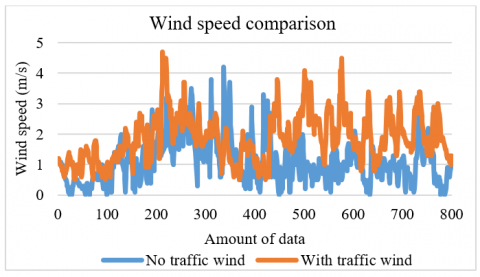
Wind speed was measured using an anemometer positioned in the median of the road. In addition, the anemometer is also placed in an open yard around the road as atmospheric wind data. The results of measurement data can be seen in Figure 5 below:
Figure 5. Comparison of atmospheric wind speed and wind effect of passing vehicles
Data The measurement data shown in Figure 4 produces 800 data samples which show that there is a difference in wind speed between the atmospheric wind and the wind effect of passing vehicles. The frequency of occurrence of wind with wind speed ≥2.5 m/s (minimum limit of wind speed that can generate electrical energy) caused by the effect of passing vehicles is 22%, which is known to be higher than the atmospheric wind speed of 5%. These results show that the wind from the effect of passing vehicles raises at least 4 times the atmospheric scale wind that blows in an open yard.
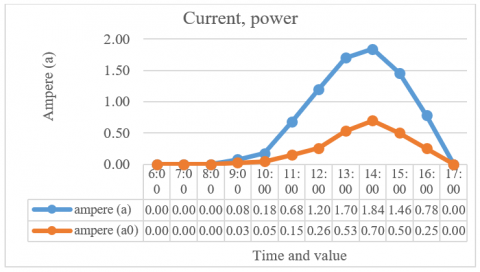
Measuring energy yields uses a vertical axis wind turbine (VAWT) turbine with 3 blades with a 150-watt generator using a digital-watt meter to determine the current, voltage, and power produced. The measurement results are carried out at 2 different places at the same time, namely on the median of the road indicated by the notation (a), (v), (w) to obtain the value of the effect of wind effects produced by passing vehicles and on open yards in the surrounding area street with current notations (a0), (v0), (w0) which can be seen in the following Figure:
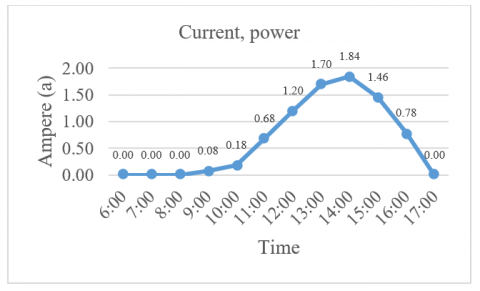
Figure 6. Generator current based on time
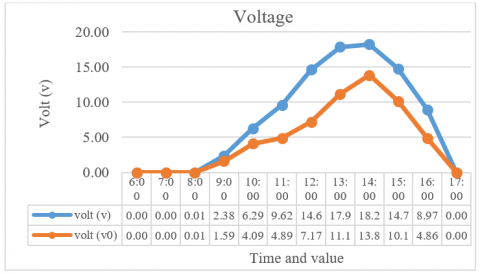
Figure 7. Generator voltage based on time
Based on Figure 6 and Figure 7, shows that there is a peak time equation between the maximum current and maximum voltage of the electric power generated by the generator. In Figure 6, the maximum current will occur at 14:00 EIT, namely 0.92 amperes for (a) and 0.70 amperes for (a0). While the largest increase in current occurred according to traffic volume data, namely during the day at 10:00 - 13:00, which was an increase of 3 amperes and at 12:00 it rose to 5 amperes. The maximum voltage also occurs at 14:00, namely 18.26 volts for (v) and 13.85 for (v0). This graph also shows that in the morning the current and voltage are lower than in the afternoon.
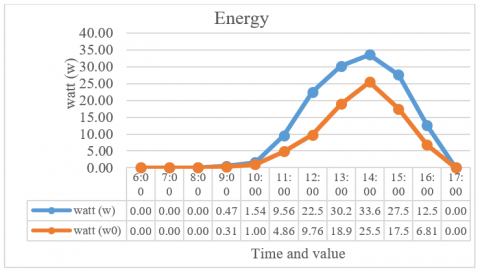
In addition to data flow and voltage data, there is also the power generated by the solar cell for 12 hours, which can be seen in full in Figure 8.
The peak power gain obtained was 33.62 watts for (w) and 25.50 watts for (w0) which occurred at 14:00 EIT. This indicates the similarity between peak power times and current and voltage peak times. In addition to peak times, the similarity also occurs in the graphic pattern, namely, the number of watts increases more significantly from noon to evening compared to the processing of the number of watts in the morning.
Figure 8. Generator power based on time
3.3 Energy potential of solar cells
In this study, the solar panel used was a 50wp solar cell with a monocrystalline panel type with high efficiency compared to the polycrystalline panel type. Solar cell measurements are carried out without any energy load being used. Measurements using a digital watt meter make it possible to get a more complete type of data. The measurement results can be seen in the following table:
Figure 9. Solar cell current based on time
Figure 10. Solar cell voltage based on time
Based on Figure 9 and Figure 10, shows that there is a peak time difference between the maximum current and maximum voltage of the electric power generated by the solar cell. In Figure 9, the maximum current will occur at 10:00 EIT, which is 4.51 amperes, while the maximum voltage will occur at 13:00 EIT, which is 20.05 volts. This graph also shows that in the morning the current and voltage are greater than in the afternoon.
In addition to data current and voltage data, there is also the power generated by the solar cell for 12 hours, which can be seen in full in Figure 11.
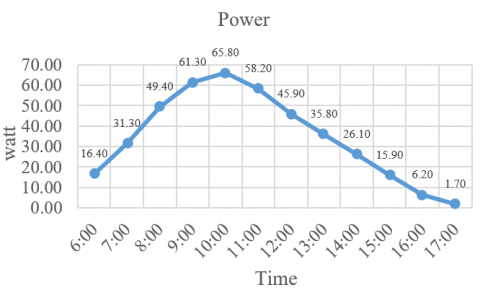
Figure 11. Solar cell power based on time
The peak power gain that was obtained was 65.8 watts which occurred at 10:00 EIT. This indicates the similarity between peak power times and current peak times. In addition to peak times, the similarity also occurs in the graphic pattern, namely, the number of watts increases more significantly in the morning compared to the processing of the number of watts in the afternoon.
The accumulated current and power for 12 hours have also been mapped in measurements without a solar cell load using a watt meter. The hourly current and hourly power can be seen in Figure 12.
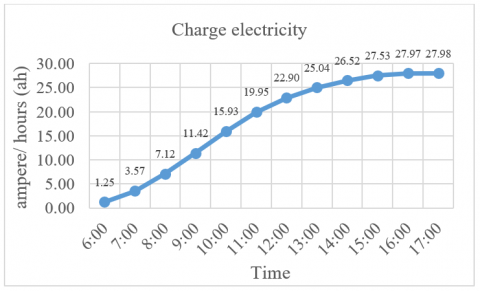
Figure 12. Solar cell current accumulation based on time
In the charging process for 12 hours, the total current per hour is 27.98 ah. This amount is obtained from the sum of the incoming currents every 1 hour as shown in Figure 12. The electricity charge chart also shows that the highest charges occur for 4 hours, namely at 8:00 – 11:00 EIT with charging above 3 amperes per hour.
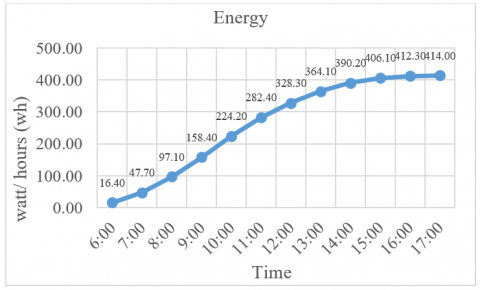
The accumulation process in Figure 13 is the same as the accumulation graph in Figure 12. The total power is done every 1 hour based on the power obtained for 12 hours. What is different between the energy graph and the electricity charge graph is that the greatest amount of incoming power occurs for 5 hours, namely at 08:00 – 12:00 with a total power above 40 watts per hour.
Figure 13. Accumulation of solar cell power based on time
3.4 Hybrid energy potential
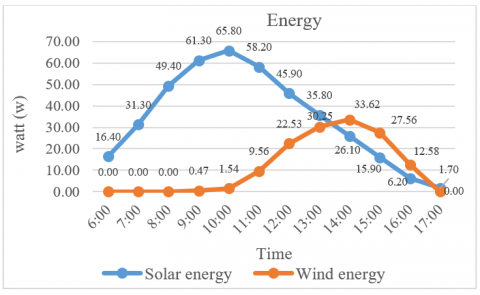
The potential for hybrid energy obtained from solar energy and wind energy by utilizing traffic flow is an energy potential that can be used as a solution to perfect a hybrid renewable energy power plant that only utilizes solar energy and wind energy on an atmospheric scale. The power potential that can be generated by solar energy and wind energy that utilizes traffic flow for 12 hours can be seen in Figure 14.
Figure 14. The power potential of solar energy and wind energy
Based on the energy potential graph of solar energy and wind energy in Figure 14, it is known that this hybrid energy is complementary, that is, solar energy will get the greatest increase in power from morning to noon and weaken in the afternoon with a total energy of 414 watts, while wind energy with taking advantage of traffic flow to get an increase in energy from noon to evening and weak in the morning with an energy of 138.11 watts. In testing wind energy, it was also found that the potential for wind energy on an atmospheric scale only amounted to 84.67 watts.
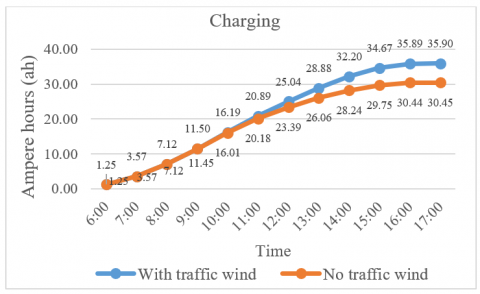
The power content obtained from this hybrid energy is known that wind energy which utilizes the effect of the wind on the flow of moving vehicle traffic is far greater when compared to only utilizing wind energy on an atmospheric scale. This can be shown on the charging chart in Figure 15.
There is a difference in the accumulated amount of charging between hybrid power plants that use traffic winds and those that do not use traffic winds or rely only on atmospheric winds in open spaces. This difference reveals that by taking advantage of the traffic flow wind, the charging will be much more at 5.45 ah.
Figure 15. Accumulated charging potential of the hybrid
The potential combination of solar energy and wind energy obtained from utilizing traffic flow is 552.11 watts. The potential for this hybrid energy can also cover each other's weaknesses between solar energy which is only superior from morning to noon and wind energy which is only superior from noon to evening. Another advantage is also found from the greater number of charging because it utilizes wind energy from traffic flow with an advantage difference of 5.45 ah. This energy combination can also support hybrid renewable energy using vertical axis wind turbine (VAWT) technology and solar cells because the wind frequency generated from vehicle volume and speed increases from 5% to 22%. This is because the traffic flow is at level B, which means the traffic flow is stable and allows vehicle drivers to have sufficient freedom to choose their speed.
The authors would like to thank the Directorate of Research and Community Service (DRPM) for funding and supporting this research and publication. On this occasion, the authors also thank Universitas Musamus for the support and motivation given in completing our research and publication.
[1] Razmjoo, A., Kaigutha, L.G., Rad, M.A.V., Marzband, M., Davarpanah, A., Denai, M. (2021). A Technical analysis investigating energy sustainability utilizing reliable renewable energy sources to reduce CO2 emissions in a high potential area. Renew Energy, 164: 46-57. http://dx.doi.org/10.1016/j.renene.2020.09.042
[2] Papadis, E., Tsatsaronis, G. (2020). Challenges in the decarbonization of the energy sector. Energy, 205: 118025. http://dx.doi.org/10.1016/j.energy.2020.118025
[3] Maniatis, K., Chiaramonti, D., van den Heuvel, E. (2021). Post COVID-19 recovery and 2050 climate change targets: Changing the emphasis from promotion of renewables to mandated curtailment of fossil fuels in the EU policies. Energies (Basel), 14(5): 1347. http://dx.doi.org/10.3390/en14051347
[4] Cariou, P., Lindstad, E., Jia, H. (2021). The impact of an EU maritime emissions trading system on oil trades. Transp Res D Transp Environ, 99: 102992. http://dx.doi.org/10.1016/j.trd.2021.102992
[5] Dong, G.G., Qing, T., Du, R.J., Wang, C., Li, R.Q., Wang, M.G., Tian, L.X., Chen, L., Vilela, A.L.M., Eugene Stanley, H. (2020). Complex network approach for the structural optimization of global crude oil trade system. J Clean Prod, 251: 119366. http://dx.doi.org/10.1016/j.jclepro.2019.119366
[6] Qin, M., Zhang, Y.C., Su, C.W. (2020). The essential role of pandemics: A fresh insight into the oil market. Energy Research Letters, 1(1): 13166. http://dx.doi.org/10.46557/001c.13166
[7] Hoan, A.T., Nižetić, S., Olcer, A.I., Ong, H.C., Chen, W.H., Chong, C.T., Thomas, S., Bandh, S.A., Nguyen, X.P. (2021). Impacts of COVID-19 pandemic on the global energy system and the shift progress to renewable energy: Opportunities, challenges, and policy implications. Energy Policy, 154: 112322. http://dx.doi.org/10.1016/j.enpol.2021.112322
[8] Langer, J., Quist, J., Blok, K. (2021). Review of renewable energy potentials in Indonesia and their contribution to a 100% renewable electricity system. Energies (Basel), 14(21): 7033. http://dx.doi.org/10.3390/en14217033
[9] Huang, X., Huang, P.X., Huang, T.X. (2020). Multi-objective optimization of digital management for renewable energies in smart cities. Journal Européen des Systèmes Automatisés, 53(6): 893-902. https://doi.org/10.18280/jesa.530615
[10] Reyseliani, N., Purwanto, W.W. (2021). Pathway towards 100% renewable energy in Indonesia power system by 2050. Renew Energy, 176: 305-321. http://dx.doi.org/10.1016/j.renene.2021.05.118
[11] Vakulchuk, R., Overland, I., Scholten, D. (2020). Renewable energy and geopolitics: A review. Renewable and Sustainable Energy Reviews, 122: 109547. http://dx.doi.org/10.1016/j.rser.2019.109547
[12] Gernaat, D.E.H.J., de Boer, H.S., Daioglou, V., Yalew, S.G., Müller, C., van Vuuren, D.P. (2021). Climate change impacts on renewable energy supply. Nat Clim Chang, 11(2): 119-125. http://dx.doi.org/10.1038/s41558-020-00949-9
[13] Agyekum, E.B., Amjad, F., Mohsin, M., Ansah, M.N.S. (2021). A bird’s eye view of Ghana’s renewable energy sector environment: A Multi-Criteria Decision-Making approach. Util Policy, 70: 101219. http://dx.doi.org/10.1016/j.jup.2021.101219
[14] Gupta, P., Swarnkar, P. (2020). A new approach towards integration of multi-frequency, multi-voltage intertied hybrid power system. European Journal of Electrical Engineering, 22(3): 241-253. https://doi.org/10.18280/ejee.220305
[15] Sweeney, C., Bessa, R.J., Browell, J., Pinson, P. (2020). The future of forecasting for renewable energy. Wiley Interdiscip Rev Energy Environ, 9(2): e365. http://dx.doi.org/10.1002/wene.365
[16] Khamis, A., Khatib, T., Yosliza, N.A.H.M., Azmi, A.N. (2020). Optimal selection of renewable energy installation site in remote areas using segmentation and regional technique: A case study of Sarawak, Malaysia. Sustainable Energy Technologies and Assessments, 42: 100858. http://dx.doi.org/10.1016/j.seta.2020.100858
[17] Qadir, Z., Khan, S.I., Khalaji, E., Munawar, H.S., Al-Turjman, F., Parvez Mahmud, M.A., Kouzani, A.Z., Le, K. (2021). Predicting the energy output of hybrid PV–wind renewable energy system using feature selection technique for smart grids. Energy Reports, 7: 8465-8475. https://doi.org/10.1016/j.egyr.2021.01.018
[18] Østergaard, P.A., Duic, N., Noorollahi, Y., Mikulcic, H., Kalogirou, S. (2020). Sustainable development using renewable energy technology. Renew Energy, 146: 2430-2437. https://doi.org/10.1016/j.renene.2019.08.094
[19] Tian, W.L., Song, B.W., Mao, Z.Y. (2020). Numerical investigation of wind turbines and turbine arrays on highways. Renew Energy, 147: 384-398. https://doi.org/10.1016/j.renene.2019.08.123
[20] Škvorc, P., Kozmar, H. (2021). Wind energy harnessing on tall buildings in urban environments. Renewable and Sustainable Energy Reviews, 152: 111662. https://doi.org/10.1016/j.rser.2021.111662
[21] Mostafaeipour, A., Rezaei, M., Jahangiri, M., Qolipour, M. (2019). Feasibility analysis of a new tree-shaped wind turbine for urban application: A case study. Energy & Environment, 31(7): 1230-1256. http://dx.doi.org/10.3390/en14165140
[22] Rajpar, A.H., Ali, I., Eladwi, A.E., Bashir, M.B. (2021). Recent development in the design of wind deflectors for vertical axis wind turbine: A review. Energies, 14(16): 5140. http://dx.doi.org/10.3390/en14165140
[23] Rajamohan, S., Vinod, A., Aditya, M.P.V.S., Vadivudaiyanayaki, H.G., Nguyen, V.N., Arıcı, M., Le, S.N., Thai, T., Hidayat, R., Nguyen, D.T. (2022). Approaches in performance and structural analysis of wind turbines – A review. Sustainable Energy Technologies and Assessments, 53: 102570. https://doi.org/10.1016/j.seta.2022.102570
[24] Akbar, M., Utary, C., Kakerissa, Y., Asmal, S. (2019). Priorities of road network development to support national food flows in Merauke District with SWOT and AHP methods. IOP Conf Ser Earth Environ Sci., 343(1). http://dx.doi.org/10.1088/1755-1315/343/1/012185
[25] Akbar, M., Paresa, J., Pamuttu, D.L. (2021). Analysis of the effect of parking on road bodies on road service levels. IOP Conference Series: Materials Science and Engineering, 1125(1): 12014. http://dx.doi.org/10.1088/1757-899X/1125/1/012014
[26] Toudarbari, S., Maghrebi, M.J., Hashemzadeh, A. (2021). Evaluation of Darrieus wind turbine for different highway settings using CFD simulation. Sustainable Energy Technologies and Assessments, 45: 101077. https://doi.org/10.1016/j.seta.2021.101077
[27] Kumar Rathore, M., Agrawal, M., Baredar, P. (2021). Energy production potential from the wake of moving traffic vehicles on a highway by the array of low economic VAWT. Mater Today Proc, 46: 5272-5277. https://doi.org/10.1016/j.matpr.2020.08.638
[28] Bång, K.L., Bergh, T., Marler, N., Mertasudira, S. (2021). Indonesian highway capacity manual. Highway Capacity and Level of Service, Routledge, 35-40. http://dx.doi.org/10.1201/9780203751916-3
[29] Abdul, G., Zulfikar, A., Sarbin, F., Aditya, N., Aminah, A.S. (2021). Road service levels analysis at the economic centers of archipelago regions during the COVID-19 pandemic. E3S Web of Conferences, 328: 10021. http://dx.doi.org/10.1051/e3sconf/202132810021
[30] Akbar, M., Paresa, J., Pamuttu, D.L. (2021). Analysis of the effect of parking on road bodies on road service levels. IOP Conference Series: Materials Science and Engineering, 1125(1): 012014. http://dx.doi.org/10.1088/1757-899X/1125/1/012014
[31] Gupta, A.K., Chauhan, Y.K., Maity, T., Nanda, R. (2022). Study of solar PV panel under partial vacuum conditions: A step towards performance improvement. IETE J Res, 68(4): 3038-3045. http://dx.doi.org/10.1080/03772063.2020.1749145
[32] Inoue, J., Sato, K. (2022). Wind Speed Measurement by an Inexpensive and Lightweight Thermal Anemometer on a Small UAV. Drones, 6(10): 289. http://dx.doi.org/10.3390/drones6100289
[33] Keramat Siavash, N., Najafi, G., Tavakkoli Hashjin, T., Ghobadian, B., Mahmoodi, E. (2020). An innovative variable shroud for micro wind turbines. Renew Energy, 145: 1061-1072. https://doi.org/10.1016/j.renene.2019.06.098