Xu Zhang![]() | Junliang Liu*
| Junliang Liu*![]() | Lan Ma
| Lan Ma![]()
© 2023 IIETA. This article is published by IIETA and is licensed under the CC BY 4.0 license (http://creativecommons.org/licenses/by/4.0/).
OPEN ACCESS
Currently most wastewater treatment plants are faced with upgrading and reconstruction to further improve the effect of deep denitrification. To this end, this paper conducts an experimental study on deep denitrification in the sulfur mixotrophic nitrification filter process using sulfur as filler. During the experiments, when the water temperature of the mixed pool was around 15℃, the influent nitrogen load was 7.3×10⁻³kg/m3·d, and hydraulic retention time (HRT) was 3.5 h, the average effluent TN concentration was 4.22 mg/L and the TN removal rate reached 43.42%, stably reaching the requirements of the core control area stipulated in the Daqing River Basin Water Pollutants Discharge Standard (DB13/2795-2018); under the conditions of HRT = 3.5 h and water temperatures of 15℃, 22℃, 27℃, 35℃ and 40℃, the average TN removal rate of the mixotrophic denitrification filter reached the highest at 35℃, up to 63%; two-factor analysis of variance (ANOVA) was applied to illustrate the influence of the two factors (water temperature and HRT) on the TN removal rate, and to conclude that the influence of each factor on its TN removal rate is ranked in a descending order: B (water temperature) > A (HRT) > A × B (interaction), all of which were important conditions to be considered, and water temperature was the most influential. These results show that the sulfur mixotrophic denitrification filter has the ability to deeply degrade the TN in the secondary effluent. This study provides a theoretical basis for the sulfur mixotrophic denitrification filter to be used as a deep treatment unit. Also, in the actual application, other operating conditions should be designed and considered to adapt to the uncertain seasonal temperature changes.
sulfur mixotrophic denitrification, deep treatment, two-factor ANOVA
In recent years, the discharge standards of wastewater treatment plants have become more stringent, resulting in a high or unstable TN indicator in the existing wastewater treatment plants. As the environmental protection strategy is continuously promoted, the upgrading and reconstruction of these local plants has been their primary task [1]. At present, various enhanced denitrification units like magnetic coagulation filter, aeration biofilter, activated sand filter, high efficiency fiber filter, fiber rotary filter, high density and sedimentation tank, etc. have been widely used. But there have arisen a series of problems such as high electricity consumption, big head loss, high equipment cost, high maintenance cost, and complex management process [2]. Compared with traditional deep treatment units, the mixotrophic denitrification filters can achieve deep wastewater purification with no need to use many additional carbon sources and denitrification and phosphorus removal agents and to install complex power-consuming equipment. So, they save costs and enjoy high potential [3].
Various studies have been conducted on the mixotrophic denitrification process. Based on the iron-based coupled ecological floating bed, Peng et al. [4] found that the presence of plant organisms improved iron-mediated denitrification and heterotrophic denitrification, and mixotrophic denitrification played an important role in nitrogen removal. Currently the most widely studied is sulfur mixotrophic denitrification, in which autotrophic denitrification is to use autotrophic microorganisms (e.g., sulfur monomers or their chemical compounds) as electron donor, and convert nitrate nitrogen in wastewater into nitrogen gas, while the electron donors above are converted into sulfate, and autotrophic and heterotrophic bacteria interact to achieve efficient operation of the system under mixotrophic conditions [5]. This technology uses lower costs of sulfur monomers, less sludge production, and faster denitrification [6], but in the autotrophic denitrification process, large amounts of sulfate radical may be produced [7].
Zhang et al. [8] found that sulfur mixotrophic denitrification is mainly applied to denitrify nitrate-containing wastewater, groundwater and domestic wastewater treatment, while HRT and water temperature, etc. are the most watched influencing factors in this process. Zheng et al. [9] explored denitrification performance and microbial community by changing the molar ratio of influent C/N/S and concluded that the mixotrophic system could indeed enhance denitrification performance, which provides a theoretical basis for establishing an efficient biological denitrification. Chu et al. [10] used eight sets of pyrite-enhanced vertical flow constructed wetlands (VFCW) to treat low C/N ratio wastewater and found that the addition of pyrite significantly promoted TN removal and achieved mixotrophic denitrification at a low C/N ratio; microbial analysis showed that the community structure and diversity of microorganisms changed significantly, while the growth of autotrophic (Thiobacillus) and heterotrophic (Thauera) bacteria was enhanced. The existing research results prove that this process is efficient in nitrogen removal and not limited by organic matter, which is more advantageous than dedicated autotrophic or heterotrophic denitrification [11]. However, there lacks the study on the treatment of actual wastewater and the change of related factors.
In view of the above, this paper aims to conduct an experimental study on mixotrophic denitrification. In the experiments, an urban wastewater treatment plant was selected and the front-end process of AAO biochemical treatment was used to treat its domestic wastewater. Besides, a mixotrophic denitrification filter with single sulfur and organic carbon source as the electron donor was designed, and the effects of pollutant degradation in the deep treatment were compared in the process of secondary effluent, to explore the possibility of deep treatment. The study provides a realistic reference value for the application of sulfur mixotrophic denitrification technology to the existing conventional biochemical processes for deep denitrification. This paper consists of five sections. The first section gives the introduction and literature review; the section two describes the material and methods applied in the experiments; the results and analysis are performed in the section three; the conclusions are finally made in the last section.
2.1 Experimental devices
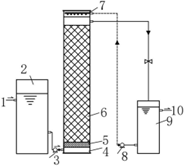
A sulfur mixotrophic denitrification system was constructed in the experiments. Water flows from bottom to top; the reaction tank is all made of organic glass in the size of Π × r2 × H = Π × (0.17 m)2 × 1.7 m. The schematic diagram of the system is shown in Figure 1, in which there installs a water inlet and backwash water pipe at the bottom, peristaltic pump sends the stored AAO discharge water from the water tank into the mixed pond, which flows through the packing layer, and then discharge from the upper outlet of the filter pool; the backwash water is pumped into the backwash water pipe at the top of the filter into the filter pool.
1. Water inlet; 2. Water tank; 3. Inlet peristaltic pump; 4. Water distribution layer; 5. Support layer; 6. Packing layer; 7. Backwash water pipe; 8. Backwash peristaltic pump; 9. Exit pool; 10. Water outlet
Figure 1. Diagram of the sulfur mixotrophic denitrification system
2.2 Fillers
The support layer of the filter pool is 0.1 m high, the packing layer is 1.3 m, and the occupied volume of the packing layer is all 0.12 m3; with sulfur monomers as filler, the actual filling rate of the denitrification filter pool is 90%. Other main parameters are: sulfur particles present spherical or ellipsoidal shape, with diameter of 3.0-5.0 mm; pebbles in the support layer are 0.5-1.0 cm diameter spheres. Figure 2 below shows actual filler.
Figure 2. Sulfur monomer
2.3 Sludge seeding
In the experiments, sludge was taken from the sludge thickener of a wastewater treatment plant and treated for reactor start-up.
2.4 Experimental methods
NH4+-N: Nessler reagent spectrophotometry; NO3--N: UV spectrophotometry; TN: alkaline potassium persulfate UV spectrophotometry; pH: portable analyzer; water temperature: probe type thermometer.
2.5 Reactor start-up
The AAO reactor was seeded with sludge for sludge domestication and cultivation alone, while the mixed pond was started simultaneously. Once started, the organic carbon and sulfur sources are also added continuously to achieve the initial domestication and cultivation of activated sludge, and then re-seeded it into the mixotrophic reactor [12]. The process is as follows: first, fill the sludge required into a sealed bucket, let it stand for a period of time to form an anoxic environment; then pour 5L potassium nitrate solution (100 mg/L) configured in advance and stir well; perform domestication with sodium thiosulfate daily for 5 consecutive days and sodium acetate for the last 5 days. When the filter pool was seeded with 30 L of the aforementioned domesticated sludge, organic carbon source was added in small amounts to promote the domestication and cultivation of activated sludge. The packing layer was composed of sulfur monolithic particles with the uniform particle size. The whole process is simple, and the filter pool is rather stable.
2.6 Reactor watering
After the fillers were well packed in the mixed pond, the domesticated and activated sludge was seeded in the reactor, and the AAO reactor was connected to the pool. The secondary effluent after AAO treatment was finally stored in the tank and then passed into the pool by peristaltic pump. When the watering experiments were completed, there often appeared some small bubbles and parts of sludge floating among the pores in the packing layer, which is due to the N2 generated by the reaction. Therefore, it’s necessary to clean the water surface regularly and maintain the stability of the effluent.
3.1 Deep denitrification effect under different hydraulic loads
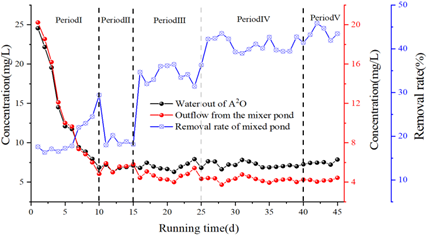
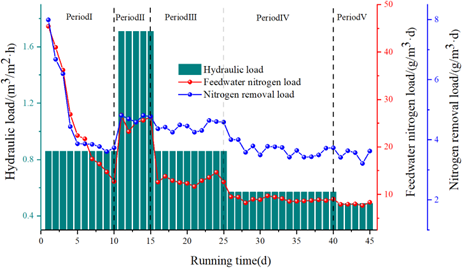
The water temperature was kept at about 15℃ during the experiment, and the HRT of the mixotrophic denitrification filter was controlled by adjusting different influent flows in each period, thus achieving different hydraulic loads. Period I is the start-up stage. From Figures 3 and 4, it can be seen that the sludge domestication effect was good at the beginning, and the denitrification was gradually improved after one week of normal operation; at this stage the influent nitrogen removal load changed gradually with the domestication process in the mixed pond, and the load gradually increased, i.e., the hydraulic load and influent nitrogen load were at the high levels of 1.71 m3/m2-h and 0.026 kg/m3-d respectively (1-10 days). When the average influent TN concentration was 13.78 mg/L, the average effluent TN concentration was 11.18 mg/L and the TN removal rate reached 20.15%. At this stage, the average TN removal load was 4.9×10⁻³kg/m3·d. For the initial operation of the sulfur mixotrophic denitrification filter, the effluent TN concentration after biological treatment by the AAO system ranged from 6.8-24.5 mg/L. Although the water temperature was instable, the autotrophic and heterotrophic biological communities in the mixotrophic denitrification filter have established a reaction system, and the nitrifying bacteria successfully surviving and experiencing life metabolism as well as the activity of nitrosating bacteria were also in the stage of further development. The operation effect in this period shows that the system already has certain denitrification ability in a relatively short period of time after the system is well seeded and cultivated.
Figure 3. TN removal effect in mixed ponds
Figure 4. Relationship between hydraulic load and nitrogen load
In the Period II (day 11-15) the HRT of the mixotrophic denitrification filter was set to 1 h, while the hydraulic load and influent nitrogen load were reduced to 1.71 m3/m2-h and 0.019 kg/m3-d respectively. With the average influent TN concentration of 6.87 mg/L, the average effluent TN concentration was 5.59 mg/L, and the TN removal rate reached 18.67%. The average TN removal load was 4.7×10⁻³kg/m3-d.
In the Period III (day 16-25), the HRT of mixotrophic denitrification filter was further extended to 2h, while the hydraulic load and influent nitrogen load were reduced to 0.86 m3/m2-h and 1.29×10⁻² kg/m3-d, respectively. With the average influent TN concentration 7.01 mg/L, the average effluent TN concentration was 4.61 mg/L, and the TN removal rate reached 34.35%. Besides, the average TN removal load was 4.6×10⁻³ kg/m3-d. As the hydraulic load and influent nitrogen load were further reduced, the nitrogen removal load became less compared with Period II, but the TN removal rate was 1.84 times more than that in Period II.
In Period IV (days 26-40), the HRT was further extended to 3 h, while the hydraulic load and influent nitrogen load were reduced to 0.57 m3/m2-h and 8.96×10⁻³ kg/m3-d, respectively. With the average influent TN concentration 7.19 mg/L, the average effluent TN concentration was 4.26 mg/L, and the TN removal rate reached 40.98%. In this period, the average TN removal load was 3.7×10⁻³ kg/m3-d; compared with period III, the hydraulic load and influent nitrogen load shortened more, and the nitrogen removal load also decreased accordingly, but the TN removal rate was 1.19 times higher than that in period II. Yuan et al. [13] performed the sawdust/pyrite mixotrophic denitrification experiments, and found that the nitrate removal rate can be increased by extending the HRT, and high numbers of denitrifying bacteria remain in the system.
Based on the above results, the HRT was extended to 3.5 h in period V (days 41-45) in order to explore whether the mixotrophic denitrification filter still has high nitrogen removal ability., while the hydraulic load and influent nitrogen load were reduced to 0.49 m3/m2-h and 7.9×10⁻³kg/m3-d, With the average influent TN concentration of 7.47 mg/L, the average effluent TN concentration was 4.22 mg/L, and the TN removal rate reached 43.42%, which was 3% higher than that in the period III. Thus, Under the condition of the stable deep denitrification capacity, the increase in the hydraulic load and influent nitrogen load can reduce the reactor volume, as well as saving space and use cost.
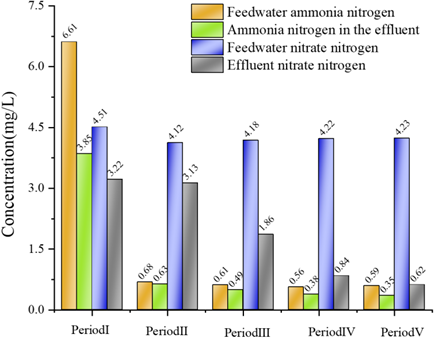
Figure 5. Nitrogen conversion in mixed ponds
3.2 Nitrogen conversion in mixed ponds
When the HRT was 1 h, the hydraulic load and influent nitrogen load of the filter pool further increased, but the TN removal rate was significantly reduced, indicating that the filter could not effectively remove nitrogen under high hydraulic load. In addition, the concentrations of NH4+-N and NO3--N in the inlet and outlet water were measured on days 1-45 in order to further describe the conversion process of nitrogen in the mixed pond. Figure 5 shows that the nitrogen in the secondary effluent was mainly NO3-N and contained a small amount of NH4+-N. The main reason is that after the AAO treatment, the wastewater has undergone sufficient aerobic nitrification and most of the NH4+-N has been removed, so that the NO3-N concentration in the secondary effluent is more stable.
Under the condition that the average influent NO3-N concentration of the mixotrophic denitrification filter was 4.11 mg/L in the period V, the average effluent NO3-N concentration was 0.62 mg/L, and the average removal rate was 85.34%, indicating that NO3-N could be removed by mixotrophic denitrification; with the average influent NH4+--N concentration of 0.59 mg/L, the average effluent NH4+--N concentration was 0.35 mg/L, and the average removal rate was 40.67%, indicating that the NH4+--N can be removed well in the mixotrophic denitrification filter, but the assimilation process of microorganisms could not be excluded. This is because at the initial stage of the start-up, the bacteria present in the mixotrophic denitrification filter consumed and converted part of the organic matter, used the residual organic matter in the water as a carbon source, and then convert the remaining nitrate nitrogen to nitrogen. However, considering that the bacterial activity in the system and the heterotrophic denitrification rate were not high at the water temperature of 15°C [14], there might be some other reason for the decrease of NH4+-N. During the experiments, it’s found that many yellow striped and irregular aerobic bacterial colonies grew near the upper wall and outlet of the mixotrophic denitrification filter, and until the late stage of the experiments, the area of the colonies had been expanding, and the dissolved oxygen concentration of the water near the colony was measured at 0.8-1.3 mg/L, possibly indicating that in the long-term bottom-up operation of the water body, different kinds of bacteria were entrained, while bacteria suitable for this environment grew in large numbers and attached to the rough filter wall. Colony formation may play a positive role in the degradation of some nitrogen. Some research proves that Torazonella strain Y-11 has a high capacity of simultaneous nitrification and denitrification at low concentrations of mixed inorganic nitrogen sources, and also degrades some NH4+-N and NO3-N at low temperatures [15]. So, it’s presumed that the bacteria colony growing in this experimental environment are low temperature aerobic bacteria.
The sum of NH4+-N and NO3-N content in the water in each period of the experiment was lower than the TN concentration, indicating the existence of a certain concentration of dissolved organic nitrogen (DON) in the test effluent. Some studies have shown that the secondary effluent treated with heterotrophic denitrification filter contains 31.2%-39.8% DON, and the proportion of DON in the effluent TN is getting higher and higher, up to over 50%, while the denitrification filter itself does not have the environmental and process conditions to degrade organic nitrogen in the secondary effluent. However, there has been few studies on the conversion of organic nitrogen. One of the main reasons is the difficulty of separating organic nitrogen from its inorganic form. Therefore, it remains a major challenge to further remove organic nitrogen [16].
3.3 Changes in pH of the mixotrophic denitrification filter before and after denitrification
Batchelor proposed the reaction equation for the sulfur autotrophic denitrification process:
1.1S0 + NO3- + 0.76H2O + 0.4CO2 + 0.08NH4+-N → 0.08C5H7O2N + 1.1SO42- + 0.5N2 + 1.28H+
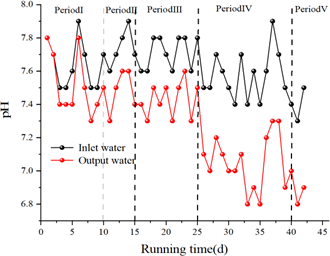
The above equation shows that the H+ produced from sulfur autotrophic denitrification process is the main cause of water acidification, which will consume certain alkalinity under normal reaction conditions. The pH change is shown in Figure 6.
Figure 6. pH changes of effluent water in each period
The effluent pH of the secondary sedimentation tank fluctuated between 7.3-7.9, and the average pH was 7.83. It’s normal that the effluent pH of the mixotrophic denitrification filter fluctuated up and down from 6.8-7.9, and the average effluent pH was 7.36. The HRT of the mixotrophic denitrification filter was gradually extended from 1 h, while the pH of its effluent in each period shows a significantly decreasing trend, indicating that the autotrophic denitrification has been the main reaction process in the filter. Liu and Koenig [17] found that the autotrophic denitrification process using sulfur as an electron donor consumed about 4 g of alkalinity (in terms of CaCO3) for each gram of nitrate nitrogen reduction, which proves that the autotrophic denitrification rate can be guaranteed by providing alkalinity in the water and maintaining a stable pH. In our experiments, the alkalinity generated only by heterotrophic denitrification was not sufficient to ensure stable denitrification. Thus, it’s very necessary to further add partial alkaline source and reduce the dissolved solids increment in the effluent [18].
3.4 Denitrification effect in mixed ponds at different water temperatures
Thiobacillus denitrificans plays an important role of degradation in the autotrophic denitrification process. Its growth is closely related to the temperature, i.e., over-high or low temperature will inhibit the growth of Thiobacillus denitrificans [19], while the temperature also affects the enzyme activity in microorganisms and changes the enzymatic reaction rate, which shall influence the diffusion rate of substrate in the system and eventually the cell synthesis. It’s already mentioned in the section 3.3 above that the denitrification effect increases by extending the HRT of the mixotrophic denitrification filter at a water temperature of 15℃. In this experiment, the AAO secondary effluent was tested, and the HRT was gradually extended from 1 h to 3.5 h. Besides, different influent temperatures were grouped under different HRTs, and the test influent temperatures were set to 22°C, 27°C, 35°C, and 40°C, in order to explore the changes in the TN removal effect of the mixotrophic denitrification filter under different HRT with the increase of water temperature.
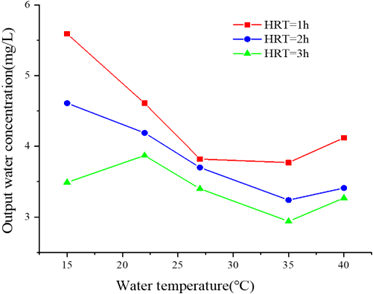
Figure 7. The effluent TN concentration under different water temperature and HRT
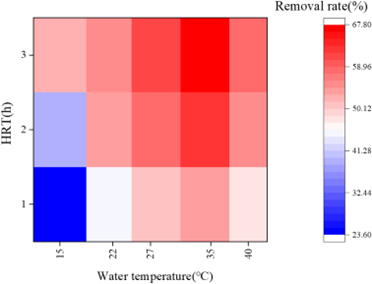
Figure 8. TN removal rate under different water temperature and HRT
Figures 7 and 8 show the trends of TN concentration and removal rate of the mixotrophic denitrification filter at different water temperatures and HRT. In Figure 7, based on the average values of operating data under each group of temperatures, the average TN effluent concentration of the mixotrophic denitrification filter was given, reflecting the average level of degradation effect in each period. In Figure 8, the denitrification effect of the mixotrophic denitrification filter under different water temperatures and HRT were reflected. It’s found that the denitrification effect first increased and then decreased when water temperature increased from 15℃ to 40℃.
When the water temperature increased from 15°C to 22°C, the TN removal rate at different HRTs changed. At HRT=1 h, the average TN removal rate increased rapidly from 18.67% to 37.23%, an increase of 18.56%; when extended to HRT=2 h, the average TN removal rate increased rapidly from 37.23 to 42.84%, an increase of 5.61%, indicating that the removal rate slowed down, but still in an increasing trend; at HRT=3 h, the average TN removal rate increased rapidly from 42.84% to 47.30%, with an increase of 4.46%.
Figure 9. TN inlet and outlet water concentration at different water temperature at HRT=3.5 h
Figure 10. TN removal rate under different water temperature conditions
When the water temperature increased from 22℃ to 27℃, at HRT=1 h, the average TN removal rate increased rapidly from 37.23% to 44.84%, an increase of 7.61%; at HRT=3 h, the average TN removal rate from 47.46% to 51.75%, an increase of 4.29%. When the water temperature increased from 27℃ to 35℃, at HRT=1 h, the average TN removal rate increased rapidly from 44.84% to 47.12%, an increase of 2.28%; at HRT=3 h, the average TN removal rate from 54.54% to 58.75%, which increased by 4.21%. Under the suitable temperature conditions, microorganisms have a higher metabolic activity and reproduction rate, and the nitrate nitrogen degrade faster, which helps to significantly increase the TN removal rate. When the water temperature was further increased from 35℃ to 40℃, the results reverse, i.e., the TN removal rate decrease. Although the removal rate increases with the extension of the HRT under the same water temperature, the TN removal rate decreases compared with that at 35℃, indicating that the microbial activity and enzymatic reaction are inhibited by high temperature, followed by the decrease of the TN removal effect.
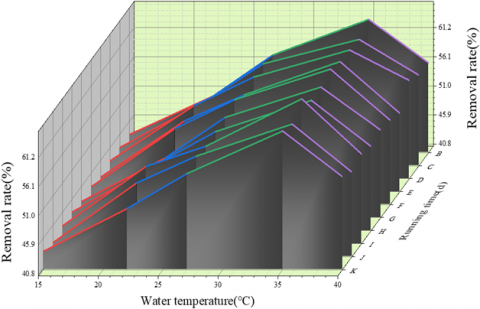
In this experiment, by increasing the HRT to 3.5 h, we investigated the TN removal rate of mixotrophic denitrification under different water temperatures, as shown in Figures 9 and 10. The TN removal rate was found to be higher than that at HRT=3 h. As the water temperature increased gradually within 35℃, the TN removal effect also increased gradually; when the temperature was over 35℃, the TN removal effect on the secondary effluent decreased. Therefore, it’s preliminarily judged that 35℃ was the optimum reaction temperature for the mixotrophic denitrification in this experiment.
3.5 Two-factor ANOVA analysis of experimental data
During the experiments, the factors affecting the denitrification effect of the mixotrophic denitrification filter include water temperature and HRT. These two are independent of each other. In addition to their effects on the removal rate at multiple levels, the interaction effect between the two influencing factors on the dependent variable should be also considered [20]. Not only the changes in the two factors, HRT and water temperature, affect the TN removal rate, but also is the new effect produced when the two factors are combined and interacted in different forms. Therefore, the two-factor ANOVA with interaction effect was applied for experimental data analysis. For the removal rate, two parallel samples in the test data were selected, and for the water temperature and HRT, four samples were selected respectively, to be 16 experimental groups altogether. As shown in Table 1 below, A represents HRT, and B represents water temperature; A1 is 1 h, A2 is 2 h, A3 is 3 h, A4 is 3.5 h; B1 is 15℃, B2 is 22℃, B3 is 27℃, and B4 is 35℃.
Table 1. Experimental data of TN removal rate
|
|
TN Removal rate |
|||||||
|
HRT |
B1=15 |
B2=22 |
B3=27 |
B4=35 |
||||
|
A1=1 |
18.55 |
18.76 |
37.18 |
37.41 |
44.88 |
44.79 |
47.26 |
47.12 |
|
A2=2 |
34.33 |
34.45 |
42.59 |
42.88 |
47.41 |
47.50 |
54.51 |
54.56 |
|
A3=3 |
40.89 |
41.05 |
47.32 |
47.24 |
51.77 |
51.68 |
58.83 |
58.77 |
|
A4=3.5 |
43.28 |
43.56 |
52.28 |
52.35 |
57.61 |
57.94 |
63.67 |
63.88 |
Table 2. Data calculation
|
|
TN removal rate |
|
|||||||
|
HRT |
B1=15 |
B2=22 |
B3=27 |
B4=35 |
Ti |
||||
|
A1=1 |
18.55 |
18.76 |
37.18 |
37.41 |
44.88 |
44.79 |
47.26 |
47.12 |
295.95 |
|
A1 sum |
37.31 |
74.59 |
89.67 |
94.38 |
|||||
|
A2=2 |
34.33 |
34.45 |
42.59 |
42.88 |
47.41 |
47.50 |
54.51 |
54.56 |
358.23 |
|
A2 sum |
68.78 |
85.47 |
94.91 |
109.07 |
|||||
|
A3=3 |
40.89 |
41.05 |
47.32 |
47.24 |
51.77 |
51.68 |
58.83 |
58.77 |
397.55 |
|
A3 sum |
81.94 |
94.56 |
103.45 |
117.6 |
|||||
|
A4=3.5 |
43.28 |
43.56 |
52.28 |
52.35 |
57.61 |
57.94 |
63.67 |
63.88 |
434.57 |
|
A4 sum |
86.84 |
104.63 |
115.55 |
127.55 |
|||||
|
Tj |
274.87 |
359.25 |
403.58 |
448.6 |
1486.3 |
||||
At the significance level α=0.01, the two-factor ANOVA with interaction effect was applied to analyze the significance for the effects of water temperature and HRT on the TN removal rate. The basic steps are as follows.
(1) Calculate the rows and columns in Table 2 according to the data above, where Ti is the row sum, Tj is the column sum, and Tij is 1486.3.
(2) Calculate the sum of squares of each deviation
The total sum of squares of deviations is:
$S_T=\sum_{i=1}^4 \sum_{i=1}^4 \sum_{k=1}^2 X_{i j k}^2-\frac{T_{i j}^2}{32}=3536.6801$
Deviation sum of squares of Factor A:
$\mathrm{S}_{\mathrm{A}}=\frac{1}{8} \sum_{i=1}^4 T_i^2-\frac{T_{i j}^2}{32}=1317.5376$
Deviation sum of squares of Factor B:
$\mathrm{S}_{\mathrm{B}}=\frac{1}{8} \sum_{i=1}^4 T_j^2-\frac{T_{i j}^2}{32}=2157.6167$
The sum of squared errors:
$S_E=\sum_{i=1}^4 \sum_{i=1}^4 \sum_{k=1}^2 X_{i j k}^2-\frac{1}{2} \sum_{i=1}^4 \sum_{j=1}^4 T_{i j}^2=0.2569$
Interaction deviation sum of squares:
$S_{A \times B}=S_T-S_A-S_B-S_B=161.2689$
(3) Calculate the degrees of freedom (DOF) for each sum of squares of deviations
The DOF of ST:
fT=4×4×2-1=31
The DOF of SA:
fA=4-1=3
The DOF of SB:
fB=4-1=3
The DOF of SE:
fE=4×4(2-1)=16
The DOF of SA×B:
$f_{A \times B}=f_T-f_A-f_B-f_E=31-3-3-16=9$
(4) Calculate the sum of squares of each mean deviation
$\begin{aligned} & \overline{S_A}=\frac{S_A}{f_A}=439.1792, \overline{S_B}=\frac{S_B}{f_B}=685.8722 \\ & \overline{S_E}=\frac{S_E}{f_E}=0.0161, \overline{S_{A \times B}}=\frac{S_{A \times B}}{f_{A \times B}}=17.9188\end{aligned}$
(5) Calculate the F-value
The F-value of factor A:
$F_A=\frac{\overline{S_A}}{\overline{S_E}}=27278.21112$
The F-value of factor B:
$F_B=\frac{\overline{S_B}}{\overline{S_E}}=42600.7578$
The F-value of the interaction:
$F_{A \times B}=\frac{\overline{S_{A \times B}}}{\overline{S_E}}=1110.9689$
(6) Distribute the critical value of the F-value according to significance test.
F0.01(fA,fE) =F0.01(3,16)=5.29
F0.01(fB,fE) =F0.01(3,16)=5.29
F0.01(fA×B,fE) =F0.01(3,16)=4.77
(7) List two-factor ANOVA table for repeated trials.
Table 3. Two-factor ANOVA list of repeated test
|
Source pf variation |
Deviation sum of squares |
DOF |
Average deviation sum of squares |
F value |
Critical value Fa(n1,n2) |
Significance |
|
Factor A (HRT) |
1641.5962 |
3 |
547.1987 |
5.29 |
F0.01(3,16)=5.29 |
** |
|
Factor B (Water temperature) |
2158.2698 |
3 |
719.4233 |
5.29 |
F0.01(3,16)=5.29 |
** |
|
A×B (Interaction) |
304.2329 |
9 |
33.8037 |
4.77 |
F0.01(3,16)=4.77 |
** |
|
Error E |
4.8073 |
16 |
0.3005 |
|||
|
Sum |
4099.2916 |
31 |
|
|
|
|
Table 3 above shows that the three F-values are all greater than the critical value, indicating that the factor A (HRT), B (water temperature) and their interaction have a highly significant effect on the TN removal rate, which is recorded as "**". The larger the difference between the F-value and the critical value, the more significant the effect of the test factors or the interaction on the test results. The influence of each factor on the TN removal rate is ranked from largest to smallest: B > A > interaction A × B, which highlights the importance of water temperature. Many scholars have also confirmed the significant importance of temperature to the degree of mixotrophic denitrification. Demir et al. [21] conducted an autotrophic denitrification treatment experiment with actual nitrate contaminated groundwater and found a halving of denitrification efficiency when the temperature was reduced from 30℃ to 20℃; Zhang et al. [22] found a logarithmic decrease in nitrate removal when the temperature was reduced from 30℃ to 10℃ in an experiment with S0-based autotrophic denitrification filters. The HRT extension contributes to increasing denitrification efficiency at low water temperatures, but it’s also necessary to design and apply other operating conditions for seasonal temperature changes.
(1) When the water temperature of the mixed pond is around 15℃, the influent nitrogen load is 7.3×10⁻³kg/m3·d and HRT=3.5 h, the average effluent TN concentration is 4.22 mg/L and the TN removal rate reaches 43.42%, which stably reaches the standard of the core control area stipulated in the Daqing River Basin Water Pollutants Discharge Standard (DB13/2795-2018). These are the optimal operation parameters during the experiments.
(2) Water temperature has a great effect on the removal rate of TN. From the average TN removal rate of the mixotrophic denitrification filter at the temperature of 15℃, 22℃, 27℃, 35℃ and 40℃ under the same condition of HRT=3.5 h, it can be seen that the removal rate increases gradually and the highest TN removal rate is 63% at the water temperature of 35℃. The trend of TN removal rate with the increase of water temperature from 15℃ to 22℃ shows that the increase of TN removal rate is significantly higher than that after 22℃, and the effect of low temperature on TN removal in the mixotrophic denitrification filter is more significant than that of high temperature.
(3) The two-factor ANOVA was applied to explore the influence of water temperature and HRT on the TN removal rate. It’s found that the influence of each factor on the TN removal rate is ranked in descending order, as follows: B (water temperature) > factor A (HRT) > A×B (interaction), which are all key conditions to be considered, but for the experiments, the water temperature has a more significant influence on the TN removal rate.
[1] Xiao, J., Chu, S. (2015). A novel bamboo fiber biofilm carrier and its utilization in the upgrade of wastewater treatment plant. Desalination and Water Treatment, 56(3): 574-582. https://doi.org/10.1080/19443994.2014.940397
[2] Li, Y.F., Wang, X., Liu, S. (2012). Engineering example of A2O-high density sedimentation tank-filter tank process in the treatment of municipal sewage. In Applied Mechanics and Materials, 178: 671-675. https://doi.org/10.4028/www.scientific.net/AMM.178-181.671
[3] Hong, X., Tang, L., Feng, H., Zhang, X., Hu, X. (2022). Agriculture waste as slow carbon releasing source of mixotrophic denitrification process for treating low C/N wastewater. Separations, 9(10): 323. https://doi.org/10.3390/separations9100323
[4] Peng, Y., Gu, X., Yan, P., Sun, S., Zhang, M., Tang, L., He, S. (2023). Mixotrophic denitrification improvement in ecological floating bed: Interaction between iron scraps and plant biomass. Science of The Total Environment, 861: 160718. https://doi.org/10.1016/j.scitotenv.2022.160718
[5] Ren, X., Wang, Y., Wan, J., Yan, Z., Ma, Y., Zhang, G., Zhu, B. (2022). The Nitrogen Removal Performance and Functional Bacteria in Heterotrophic Denitrification and Mixotrophic Denitrification Process. Water, 14(22), 3603. https://doi.org/10.3390/w14223603
[6] Woo, Y.C., Lee, J.J., Kim, H.S. (2022). Removal of nitrogen from municipal wastewater by denitrification using a sulfur-based carrier: A pilot-scale study. Chemosphere, 296: 133969. https://doi.org/10.1016/j.chemosphere.2022.133969
[7] Sahinkaya, E., Dursun, N., Kilic, A., Demirel, S., Uyanik, S., Cinar, O. (2011). Simultaneous heterotrophic and sulfur-oxidizing autotrophic denitrification process for drinking water treatment: control of sulfate production. Water Research, 45(20): 6661-6667. https://doi.org/10.1016/j.watres.2011.09.056
[8] Zhang, J., Fan, C., Zhao, M., et al. (2022). A comprehensive review on mixotrophic denitrification processes for biological nitrogen removal. Chemosphere, 313: 137474. https://doi.org/10.1016/j.chemosphere.2022.137474
[9] Zheng, S., Liu, X., Yang, X., et al. (2022). The nitrogen removal performance and microbial community on mixotrophic denitrification process. Bioresource Technology, 363: 127901. https://doi.org/10.1016/j.biortech.2022.127901
[10] Chu, Y., Liu, W., Tan, Q., et al. (2022). Vertical-flow constructed wetland based on pyrite intensification: Mixotrophic denitrification performance and mechanism. Bioresource Technology, 347: 126710. https://doi.org/10.1016/j.biortech.2022.126710
[11] Oh, S.E., Yoo, Y.B., Young, J.C., Kim, I.S. (2001). Effect of organics on sulfur-utilizing autotrophic denitrification under mixotrophic conditions. Journal of Biotechnology, 92(1): 1-8. https://doi.org/10.1016/S0168-1656(01)00344-3
[12] Wang, P.Q. (2018). Denitrification performance and bacterial communities in a mixotrophic denitrification system. Master's thesis, Shanghai Jiao Tong University, Shanghai, China.
[13] Yuan, S., Zhu, W., Guo, W., Sang, W., Zhang, S. (2022). Effect of hydraulic retention time on performance of autotrophic, heterotrophic, and split-mixotrophic denitrification systems supported by polycaprolactone/pyrite: Difference and potential explanation. Water Environment Research, 94(12): e10820. https://doi.org/10.1002/wer.10820
[14] Lee, Y.Y., Choi, H., Cho, K.S. (2019). Effects of carbon source, C/N ratio, nitrate, temperature, and pH on N2O emission and functional denitrifying genes during heterotrophic denitrification. Journal of Environmental Science and Health, Part A, 54(1): 16-29. https://doi.org/10.1080/10934529.2018.1503903
[15] He, T., Li, Z., Xie, D., Sun, Q., Xu, Y., Ye, Q., Ni, J. (2018). Simultaneous nitrification and denitrification with different mixed nitrogen loads by a hypothermia aerobic bacterium. Biodegradation, 29: 159-170. https://doi.org/10.1007/s10532-018-9820-6
[16] Lu, K., Liu, Z. (2022). The formation of refractory dissolved organic nitrogen from free amino acids in the ocean. Geophysical Research Letters, 49(18): e2022GL100041. https://doi.org/10.1029/2022GL100041
[17] Liu, L.H., Koenig, A. (2002). Use of limestone for pH control in autotrophic denitrification: Batch experiments. Process Biochemistry, 37(8): 885-893. https://doi.org/10.1016/S0032-9592(01)00302-8
[18] Pan, H., Cui, M.H., Zhang, C., et al. (2022). Alkalinity regulation in a sulfur autotrophic denitrifying filter substantially reduced total dissolved solids and sulfate in effluent. Bioresource Technology, 348: 126751. https://doi.org/10.1016/j.biortech.2022.126751
[19] Zou, G., Papirio, S., Lakaniemi, A.M., Ahoranta, S.H., & Puhakka, J.A. (2016). High rate autotrophic denitrification in fluidized-bed biofilm reactors. Chemical Engineering Journal, 284: 1287-1294. https://doi.org/10.1016/j.cej.2015.09.074
[20] Marantika, A., Fithriani, I., Nurrohmah, S. (2020). Estimating parameter in two-way analysis of variance when variance between cells is heterogeneous. Journal of Physics: Conference Series, 1442: 012043. https://doi.org/10.1088/1742-6596/1442/1/012043
[21] Demir, Ö., Atasoy, A.D., Çalış, B., Çakmak, Y., Di Capua, F., Sahinkaya, E., Uçar, D. (2022). Impact of temperature and biomass augmentation on biosulfur-driven autotrophic denitrification in membrane bioreactors treating real nitrate-contaminated groundwater. Science of The Total Environment, 853: 158470. https://doi.org/10.1016/j.scitotenv.2022.158470
[22] Zhang, X.N., Zhu, L., Li, Z.R., et al. (2022). Thiosulfate as external electron donor accelerating denitrification at low temperature condition in S0–based autotrophic denitrification biofilter. Environmental Research, 210: 113009. https://doi.org/10.1016/j.envres.2022.113009