Farhan Lafta Rashid*![]() | Asseel M. Rasheed Al-Gaheeshi
| Asseel M. Rasheed Al-Gaheeshi![]() | Mokdad Hayawi Rahman
| Mokdad Hayawi Rahman![]() | Ali Basem
| Ali Basem![]()
© 2023 IIETA. This article is published by IIETA and is licensed under the CC BY 4.0 license (http://creativecommons.org/licenses/by/4.0/).
OPEN ACCESS
With the aid of the COMSOL program, the laminar mixed convection heat transfer in a channel-open cavity with two heat sources of constant 20 W each and varying input air velocity ranges (0.1, 0.5, 1.0, and 1.5 m/s) is numerically determined. In this study, the effect of varying inlet air velocity on the heat transfer characteristics is investigated. Numerical results show that the temperature starts to fall steadily as one moves farther and further away from the site of the two heat sources and closer to the horizontal channel. The higher the velocity of the air entering the cavity, the greater the natural convection that will be created by the heated heat sources. The increase in inlet air velocity will increase the turbulence of airflow and thus increases the pressure distribution. The increase in absolute y-direction decreases the velocity distribution. The rise in the inlet velocity of air will increase the transfer of heat; thus, the Nusselt number will be great when increasing air flow velocity. The maximum Nusselt number is at the interface and reduces with increasing the absolute value of y. A reduction in air temperature and an increase in air density result from an increase in natural convection from the cavity into the air stream caused by an increase in air input velocity.
two heated sources, open cavity, forced convection, natural convection, mixed convection
Throughout Several different engineering, fields find convection that is mixed in channels and horizontal tubes to be of practical value (heat exchangers used in the chemical industry, compact heat exchangers, and solar collectors). In recent years, a multitude of writers has conducted research on the heat transfer modification in cavities or channels using partitions, barriers, and fins, with the goal of influencing the phenomena of convection flow. It was classified as belonging to one of the primary categories on the basis of the position of the electronic board or the heated wall inside the enclosure [1, 2]. Because of this, we were able to establish which of the three categories it fits into. Because cavities that are filled with fluid are essential components in a wide variety of geophysical and engineering systems, the problem of mixed convection in cavities is very relevant in today's world for the following reason: the issue of mixed convection in cavities is very pertinent in today's world. When the flow and heat transfer that occurs inside a hollow are contrasted with the mixed convective boundary layer that is found outside of the hollow, significant differences are seen [3]. Mixed convection is the outcome of a complicated interaction between fluid systems of limited size that are in thermal contact with all of the surrounding walls. This interaction causes mixed convection to occur inside a hollow. One may consider this link to be a kind of thermal feedback loop. The degree of complexity of the interaction that is taking place inside a cavity is directly proportional to the number of different flows that are capable of occurring within that cavity. When it comes to the process of mixed convection that takes place in cavities, the form of the cavity and the direction in which it is orientated are both important factors to consider. The cavity phenomena may be loosely separated into two groups [4-7] determined by the conceivable applications in engineering that can be found in them.
An investigation of the heat transmission processes in a fluid-cooled reciprocating channel was carried out via the use of numerical research by Fu et al. [8]. After that, the arbitrary Lagrangian-Eulerian Kinematics approach and the Finite Element Approach are used in order to address the moving boundary issue that is associated with the reciprocating piston. The size ratio of Gr/Re2 has an immediate impact on the heat transfer mechanisms because to its significant influence on the thermal stratification layers. Manca et al. [9] presented a study on the mixed convection phenomena inside an open chamber that had both a heated wall and a horizontally insulated plate. The findings of most of this study suggest that a drop in maximum temperature values may be expected when the Richardson and Reynolds numbers are increased. It has been observed that the H/D ratio has a significant influence on the streamline and isotherm patterns for a variety of different heating settings. Aylı [10] analyzed the laminar-coupled forced convection that occurs via a horizontal duct using computational methods to characterize the heat transfer parameters of the process. It is the purpose of this study to investigate how heat transmission is affected by the geometrical parameters of the cavity as well as the Reynolds number. A model for an adaptive neuro-fuzzy interface system was constructed, and using it; a prediction was made regarding the Nusselt number. The model's R2 value was 0.9983, and its mean average percentage error was 1.07 per cent. The effects of the various training methods, in addition to their capacity to generate a Nusselt number distribution prediction, are looked into here. Ozgen and Varol [11] studied the mixed convection heat transfer in a horizontal duct equipped with a porous medium because it is crucial for a broad range of technological applications, including cooling, the storage of radioactive nuclear waste, fluid movement in geothermal resources, and chemical industrial formations. Some of these technical applications include fluid flow in geothermal resources, chemical industry formations, cooling, and radioactive material waste of nuclear products. The finite difference approach has been used to solve the equations in dimensionless form, and the results have been analyzed over a wide range of possible values for the parameters. Variables such as the Peclet and Rayleigh numbers may have an influence on the fields of temperature as well as the flow fields. In order to assess the heat transfer that occurs within a horizontal channel equipped with an open trapezoidal cavity that is exposed to a source of heat with variable length, Laouira et al. [12] used statistical analysis. A local heating element buried in the bottom wall of the cavity, which may be any length, is assumed to be the source of the heat. This element's temperature is maintained at a set value. Another finding was that both the average and local Nusselt values increased as the length of the local heat source increased. The highest temperature is also not far from where the heat source is located. Combination (mixed) convection was statistically shown in a horizontal channel of finite length and aspect ratio of 10 by Bahlaoui et al. [13]. Radiation transparency is thought to exist in the cooling medium, air, which has a Pr of 0.72. From above, the canal is insulated, and it is subtly heated from below. The total Nusselt number, radiative Nusselt number, convective Nusselt number, and temperature distribution are illustrated for different combinations of surface emissivity (0.1), Rayleigh number (104Ra8x105), and Reynolds number (3Re1,000). The results suggest that there are two flow zones, each of which is governed by a unique set of regulatory factors. A numerical analysis of the mixed convection in a 3-D vented enclosure that was discretely heated was done by Doghmi et al. [14]. The finite volume method was used by the authors. The findings are presented in terms of the average Nusselt number, temperature distribution, and streamlines for different combinations of the thermal regulating elements, notably the Reynolds and Richardson numbers. The results of the computer research show that the aforementioned variables have a significant impact on how quickly heat is transmitted. Numerous researchers' results on the effects of different variables on forced convection, natural convection, and mixed convection heat transfer were reported [15-25].
Despite several studies on airflow through a channel-open cavity, no earlier findings on imposing two constant heat source powers in the cavity for laminar fluid flow are known. This effort intends to examine the influence of changing inlet air velocity on airflow via such an arrangement.
The schematic design of a horizontal channel equipped with an open square enclosure housing a heated source with a hemispherical shape is shown in Figure 1. The airflow that is going via a channel connected to an open square enclosure regulates the movement. The enclosure is 0.12 meters tall. It is expected that the channel extends 0.6 meters beyond the depression in its free length. The enclosure's bottom wall, which also serves as the heat source and has a radius of 0.02 meters. The 20 Watts of electricity output remains constant. While the other walls are thought to be adiabatic, airflow with the temperature of the surrounding environment (20 degrees Celsius) penetrates the horizontal channel. The open enclosure has a top width of 0.1 m, a bottom width of 0.05 m, and a height of 0.07 m. All of the case study's necessary values are included in Table 1.
Table 1. Geometrical specifications and flow parameters
|
Symbol |
Value |
Description |
|
D |
12 cm |
Tube diameter |
|
L |
80 cm |
Tube length |
|
W |
10 cm |
Cavity width |
|
H |
7 cm |
Cavity height |
|
r |
2 cm |
Spherical radius of heat source in cavity |
|
Tin |
20℃ |
Inlet temperature of the flow |
|
Vin |
0.1 – 1.5 m/s |
Inlet velocity |
|
Pw |
20 W |
Heat power source in a cavity |
Figure 1. Diagram of the channel-open cavity with dimensions
2.1 The governing equations
The system's basic equations have been rewritten and expressed in Cartesian coordinates as seen below [26-29]:
The equation of continuity:
$\frac{\partial U}{\partial X}+\frac{\partial V}{\partial Y}=0$ (1)
The equations that illustrate the idea of conservation of momentum in the X-direction are as follows:
$U \frac{\partial U}{\partial X}+V \frac{\partial U}{\partial Y}=-\frac{\partial P}{\partial X}+\frac{1}{R e_{i n}}\left(\frac{\partial^2 U}{\partial X^2}+\frac{\partial^2 U}{\partial Y^2}\right)$ (2)
So, for Y‐direction:
$U \frac{\partial V}{\partial X}+V \frac{\partial V}{\partial Y}=-\frac{\partial P}{\partial Y}+\frac{1}{R e_{i n}}\left(\frac{\partial^2 V}{\partial X^2}+\frac{\partial^2 V}{\partial Y^2}\right)+R i \theta$ (3)
Energy conservation may be expressed as:
$U \frac{\partial \theta}{\partial X}+V \frac{\partial \theta}{\partial Y}=\frac{1}{R e_{i n} P r}\left(\frac{\partial^2 \theta}{\partial X^2}+\frac{\partial^2 \theta}{\partial Y^2}\right)$ (4)
where, $R e_{i n}=\frac{\rho u_{i n} H}{\mu}$ presents the Reynolds number, and H is the length of the cavity.
The Richardson number (Ri) may be written as: $R i=\frac{G r}{R e_{i n}^2}=\frac{g H \beta\left(T_h-T_c\right)}{u_{i n}^2}$.
The Prandtl number can be presented as $P r=\frac{v}{\alpha}$.
The dimensionless figure parameters can be written as:
$\theta=\frac{T-T_c}{T_h-T_c}, U=\frac{u}{u_{i n}}, V=\frac{v}{u_{i n}}, X=\frac{x}{H}, Y=\frac{y}{H}, P=\frac{P}{\rho u_{i n}^2}$,
where, H is the length of the cavity. $\varepsilon=\frac{L_H}{H}$, where LH is the heated source length.
The average Nusselt number may be calculated from the following:
$N_{a v g}=\frac{1}{L_H} \int_0^{L_H} N u(x) d Y$ (5)
Nu(x) in the above equation represents the local Nusselt number.
$h(X)=\frac{Q}{T_h(X)-T_i}$ (6)
In a nutshell, the assumptions are as follows: the flow is incompressible, laminar, Newtonian, and two-dimensional, and the strength of any external forces is considered to be small.
2.2 Prerequisites for establishing limits and conditions
In the previous section, the boundary conditions were provided as follows [30-34]:
At channel inlet:
$X=0, H \leq Y \leq H+D, \theta=0, U_{\text {in }}=1$
Channel exit:
$X=0.8, H \leq Y \leq H+D, \frac{\partial \theta}{\partial X}=\frac{\partial U}{\partial X}=\frac{\partial V}{\partial X}=0, P=0$
where, X and Y are dimensional coordinates, H is the length of the cavity, U and V are dimensionless velocities, D is channel diameter, θ is dimensionless temperature, and P is pressure.
On the heated source:
$\theta=1$, or,$\frac{\partial \theta}{\partial n}=0$, n represents a normal vector.
On the fixed wall:
U=V=o
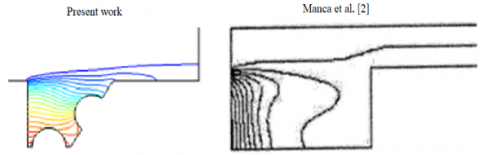
Figure 2. Isotherm comparison with the earlier numerical work by Manca et al. [2]
2.3 Validation
In order to provide a validation of the obtained numerical results, the last case, which was supplied by Manca et al. [2], is once again resolved by our algorithm, as presented in Figure 2. This was done in order to produce validation of the findings. The comparison makes it clear that the two results are consistent with one another, which is a very positive finding.
2.4 Procedures for simulation and numerical testing
There are a number of activities that must be completed and confirmed before the numerical simulation of the present research can be conducted. You should strive to summarize these concepts by concentrating on these two key elements: (1) To reduce the amount of inaccuracy that is present in the numerical findings, two techniques may be used: creating the grids and analyzing the density of the individual grid components. (2) Determining if the findings produced by the numerical model are correct.
When the highest normalized root mean square (RMS) value was less than 10-4, convergence was deemed to have occurred. The number of cells in the computational domain is shown in Table 2, which has been changed from (124365) to (226754). Therefore, 254825 is the ideal number of cells for reducing error and maximizing CPU resource utilization. The structure of the grid in its final form is seen in Figure 3 after having been finished.
Table 2. Grid independency test for 0.1 m/s of inlet air velocity
|
Number of cells |
Overall Nu |
$\left|\frac{\mathrm{Nu}^{\mathrm{i}+1}-\mathrm{Nu}^{\mathrm{i}}}{\mathrm{Nu}^{\mathrm{i}}}\right| \%$ |
|
124365 |
126.213 |
- |
|
183109 |
129.341 |
2.478 |
|
143356 |
131.56 |
1.716 |
|
254825 |
132.041 |
0.365 |
|
226754 |
132.313 |
0.206 |
(a)
(b)
(c)
Figure 3. Mesh generation with different zooms
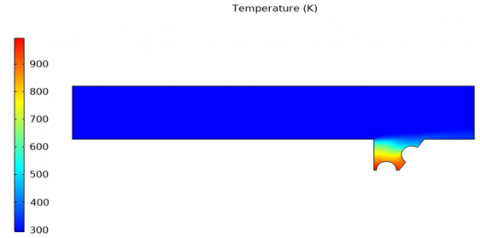
Figure 4 shows two 20 W heat sources and four isotherm contours for air entering at velocity varied from 0.1 to 1.5 m/s. In general, three basic types of heat transfer may be seen in different parts of the world. Low flow velocity causes forced convection in the channel itself, diffusion at the bottom part of the cavity, and mixed convection in the contact region between the channel and cavity. The bulk of the cavity's heat removal process is driven by heat diffusion because of the cavity's relatively low velocity and the heat source's tiny size. On the other hand, forced convection dominates the heat removal process in the channel area because of the comparatively high velocities. However, the contours at the cavity rest and the channel present that the bulk of heat transferred are mediated by convection. The zone of diffusive transfer of heat is confined within the proximity cavity of the heat source. Furthermore, it is evident that as one approach closer to the horizontal channel and far from the source of heat, the temperature begins to progressively decrease. The boundary condition for the problem is consistent with this finding. This was thoroughly validated using [35].
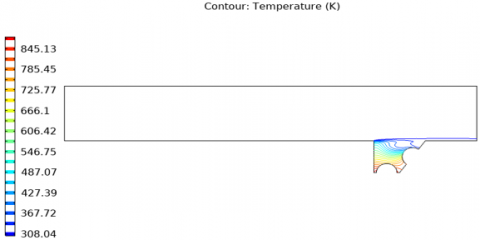
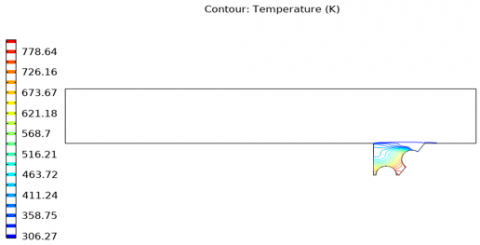
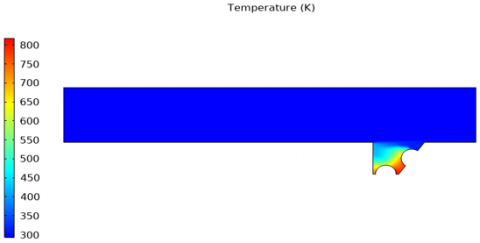
With two 20 W heat sources, Figure 5 shows four temperature distribution contours for input air velocity varied from 0.1 to 1.5 m/s. These results clearly demonstrate that an increase in the input air velocity causes a visible change in the flow and temperature field inside the cavity, which can be shown to be the case. When there is a temperature difference between the heat source and the channel passage, forced and natural convection both take place. Natural convection is brought on by a temperature differential, while forced convection is brought on by air flowing upward through the cavity. The natural convection produced by the heated heat sources will be larger the faster the air enters the cavity. As a consequence, there will be more hot and cold air mixing, which will lead to a more uniform distribution of temperature within the hollow. This was thoroughly validated using [36].
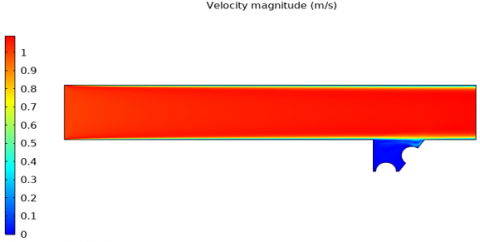
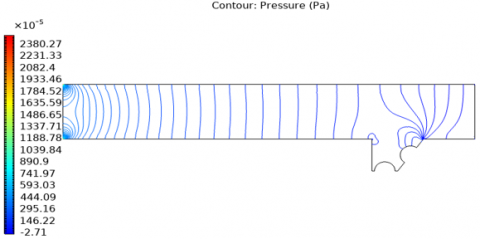
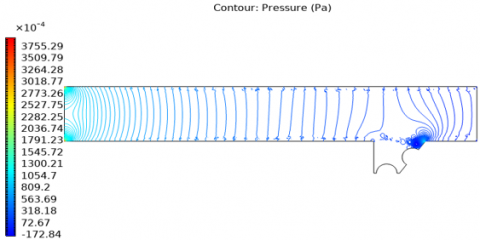
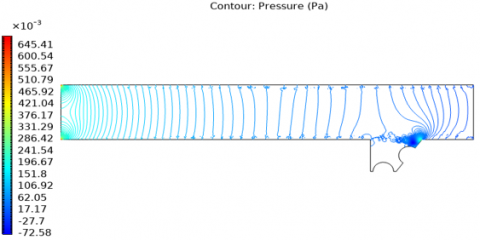
Figure 6 displays the velocity contours for different input air velocities with two 20 W constant heat sources each. Due to the presence of two heating sources, a zone in which the air is recirculating fills the whole cavity. This zone exists as a direct result of the source of heat being there. The buoyancy force causes a recirculating component in the cavity to move air to the left toward the insulated wall of the hollow enclosure. However, due to no-slip conditions, a typical laminar velocity profile with ultimate velocity in the channel centre and zero close to the walls can be seen in the channel region. A unique zone is shown by the contact between the top of the cavity and the channel. The weakly recirculating portion of the enclosure in this area alters the low-velocity profile of the channel. Figure 7, which shows the pressure streamline contours for the channel-cavity assembly, clearly shows the recirculating zones. This graphic shows how the recirculating streamlines zone is growing as the incoming air velocity increases. This was thoroughly validated using [37].
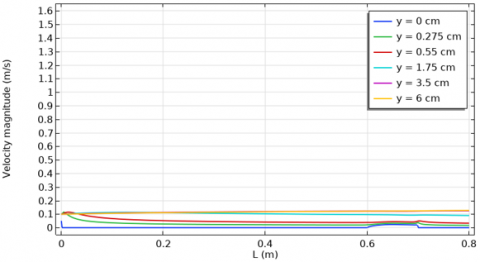
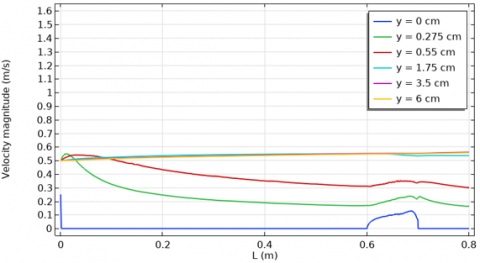
For varied input air velocity varied from 0.1 to 1.5 m/s and two constant heat source powers of 20 W each, the velocity distribution during positive y-axis in channel flow is shown in Figure 8. The velocity increases as the distance from the lower wall's surface increases because less friction will be exerted on the walls. We see that the velocity is at about one level throughout the channel with an input air velocity of 0.1 m/s and starts to climb near the contact between the top cavity and the channel. When the weakly recirculating portion of the cavity is close to the interface zone, it affects the laminar velocity profile of the channel. Because forced convection will be stronger than natural convection and the shear wall effect, an increase in air input velocity will result in a rise in the velocity profile. This was thoroughly validated using [38].
(a) Vin = 0.1 m/s
(b) Vin = 0.5 m/s
(c) Vin = 1 m/s
(d) Vin = 1.5 m/s
Figure 4. Isotherm contour map at a different inlet velocity
Figure 9 depicts the distribution of pressure along the positive y-axis in a channel flow with two 20 W continuous heat sources and varied input air velocities between 0.1 and 1.5 m/s. It is clear that the pressure is higher at the channel's intake, decreases gradually as it travels, and varies at the point where the channel and cavity meet. The rise in the positive y-axis has no effect on the pressure distribution along the channel, with the exception of the contact zone between the channel and the cavity. In this zone, there is a weak region that is impacted by the pressure coming from the channel, but other than that, the pressure distribution along the channel is unaffected. As the turbulence of the airflow rises as a result of an increase in the input air velocity, there will be an increase in the pressure distribution. This was thoroughly validated using [39].
(a) Vin = 0.1 m/s
(b) Vin = 0.5 m/s
(c) Vin = 1 m/s
(d) Vin = 1.5 m/s
Figure 5. 2D passage temperature contours at a different inlet velocity
With two constant heat source powers of 20 W each, Figure 10 shows the temperature distribution along the positive y-axis in the channel-cavity assembly at varied input velocities ranged from 0.1 to 1.5 m/s. This picture demonstrates how the two fixed heat sources at the cavity's bottom wall have an impact on temperature distribution, which is at a minimum along the channel and elevated across the area where the channel and cavity come into contact. By increasing the mixing of hot and cold air, or the input air velocity, the two heated sources will produce more natural convection, which will enhance the temperature distribution within the cavity and reduce the temperature at the channel-to-cavity contact. This was thoroughly validated using [40].
(a) Vin = 0.1 m/s
(b) Vin = 0.5 m/s
(c) Vin = 1 m/s
(d) Vin = 1.5 m/s
Figure 6. 2D Velocity contours at a different inlet velocity
At different input velocities varied from 0.1 to 1.5 m/s and two constant heat source powers of 20 W each, Figure 11 shows the velocity distribution during the negative y-axis in the cavity. The velocity distribution is roughly constant and minimal throughout the negative y-axis in the cavity for low air velocity values (0.1 m/s), and it abruptly decreases near the end of the cavity. Increases in absolute y-direction result in a drop in the velocity distribution since they represent forwarding into the bottom of the cavity or the lowest airflow velocity, but increases in input air velocity increase the velocity dispersion. This was thoroughly validated by [41].
(a) Vin = 0.1 m/s
(b) Vin = 0.5 m/s
(c) Vin = 1 m/s
(d) Vin = 1.5 m/s
Figure 7. Passage pressure streamline contour map at a different inlet velocity
Figure 12 depicts the distribution of pressure along the negative y-axis in the cavity at several input velocities from 0.1 to 1.5 m/s and two constant heat source powers of 20 W each. The pressure distribution will be roughly constant throughout the negative y-axis in the cavity for low air velocity (0.1 and 0.5 m/s). The pressure distribution is maximized by the increase in inflow flow velocity, and the end of the cavity has the highest value because of the recirculation effect there. At the top of the cavity (y=-5 cm), the pressure distribution value remains constant, fluctuating with the absolute value of (y). This was strongly supported by [42].
(a) Vin = 0.1 m/s
(b) Vin = 0.5 m/s
(c) Vin = 1 m/s
(d) Vin = 1.5 m/s
Figure 8. Velocity distribution during positive y-axis in passage flow at a different inlet velocity
Figure 13 shows the temperature distribution in the cavity during the negative y-axis at different input air velocities between 0.1 and 1.5 m/s with two constant heat source powers of 20 W each. Because the combined influence of the two heat sources will be stronger, the temperature distribution will rise as the absolute y-axis value increases. The increase in airflow velocity at the air entrance will enhance the natural convection produced by the two heated sources, or the mixing of hot and cold air, which will reduce the temperature distribution within the cavity and lower the temperature along the negative y-axis. This was thoroughly validated using [43].
(a) Vin = 0.1 m/s
(b) Vin = 0.5 m/s
(c) Vin = 1 m/s
(d) Vin = 1.5 m/s
Figure 9. Pressure profile during positive y-axis in passage flow at a different inlet velocity
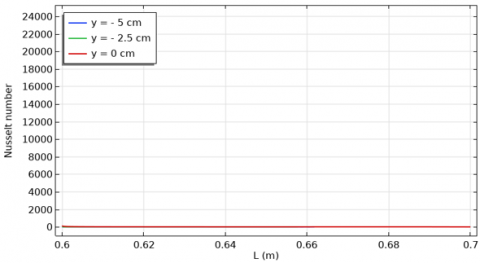
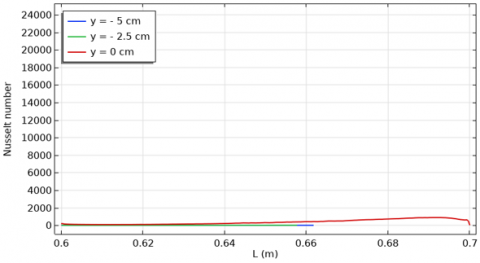
Local Nusselts number distribution in the cavity is shown in Figure 14 when the input velocity of air is varied from 0.1 to 1.5 m/s with two constant 20 W heat sources. The heat transfer between the cavity holding the two sources and the horizontal channel will be at its lowest for low air velocity (0.1 and 0.5 m/s). Hence the Nusselt number will be at its lowest value. The Nusselt number will be high when airflow velocity is increased because an increase in intake air velocity will enhance heat transfer. The highest heat transmission occurs at the interface between the cavity and the channel (y=0), where the maximum Nusselt number also occurs. As y is increased in absolute value, the maximum Nusselt number decreases. This was thoroughly validated using [44].
(a) Vin = 0.1 m/s
(b) Vin = 0.5 m/s
(c) Vin = 1 m/s
(d) Vin = 1.5 m/s
Figure 10. Temperature profile during the positive y-axis in passage flow at a different inlet velocity
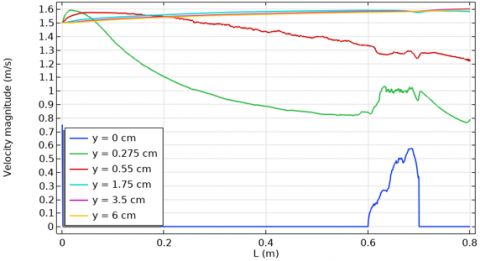
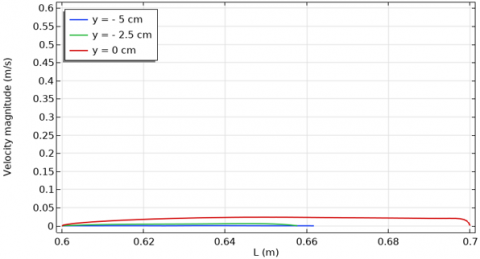
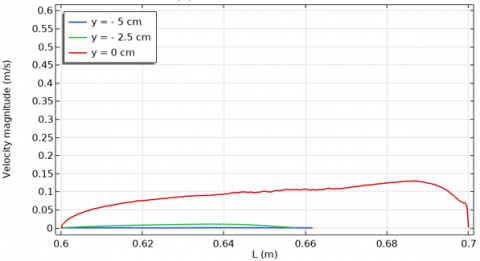
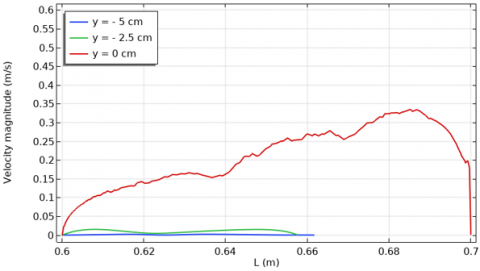
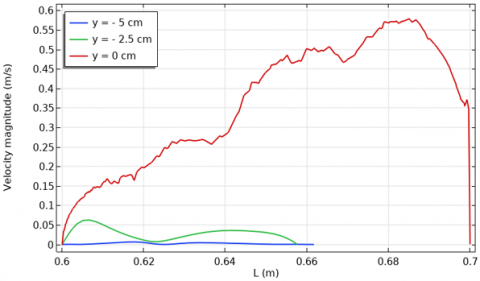
Local velocity distribution in the channel-cavity assembly is shown in Figure 15 with two constant heat source powers of 20 W each and varied input air velocities ranging from 0.1 to 1.5 m/s. The local velocity distribution was greatest at the channel inlet and abruptly failed due to the effect of shear stress caused by the channel wall. It then increased and fluctuated at the interface's midpoint before being reduced to a minimum value due to the effect of air recirculation at the cavity's end. This was thoroughly validated using [45].
(a) Vin = 0.1 m/s
(b) Vin = 0.5 m/s
(c) Vin = 1 m/s
(d) Vin = 1.5 m/s
Figure 11. Velocity distribution during the negative y-axis in the cavity at a different inlet velocity
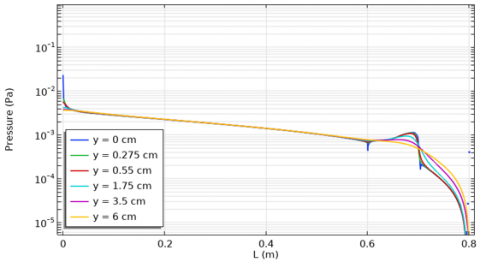
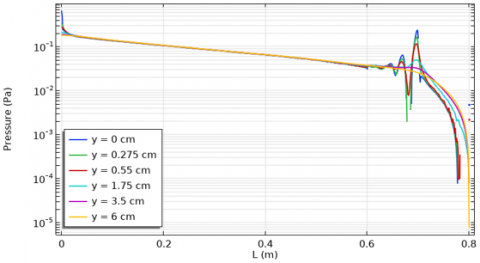
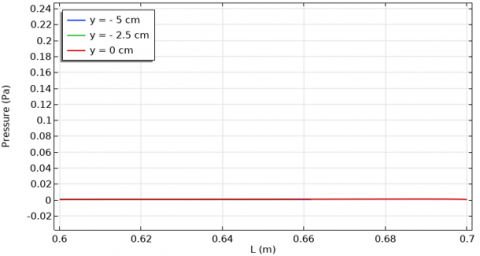
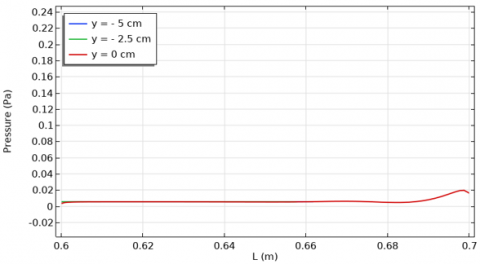
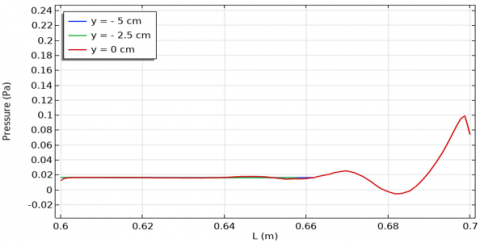
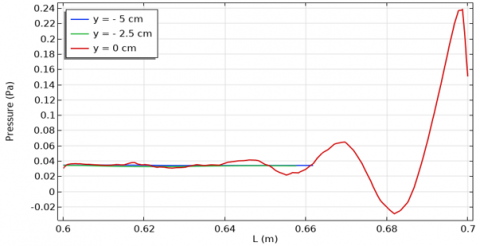
Local pressure distribution is shown in Figure 16 for the channel-cavity assembly for two 20 W constant heat sources and varied input air velocities between 0.1 and 1.5 m/s. The maximum value of the pressure distribution is at the channel's inlet and abruptly decreases over the following distance, fluctuating only at the contact region between the cavity and the channel, where there is a maximum rise and drop at 0.7 m (mid-cavity), caused by the strong recirculation that occurred at this location. With the study of Aljibory et al. [46], this was amply proved.
(a) Vin = 0.1 m/s
(b) Vin = 0.5 m/s
(c) Vin = 1 m/s
(d) Vin = 1.5 m/s
Figure 12. Pressure profile during negative y-axis in the cavity at a different inlet velocity
(a) Vin = 0.1 m/s
(b) Vin = 0.5 m/s
(c) Vin = 1 m/s
(d) Vin = 1.5 m/s
Figure 13. Temperature profile during negative y-axis in the cavity at a different inlet velocity
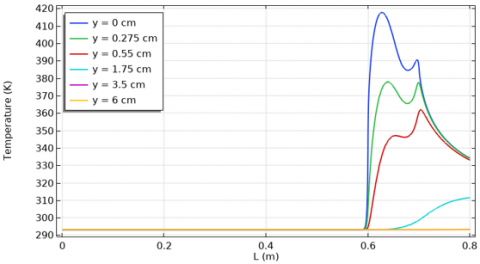
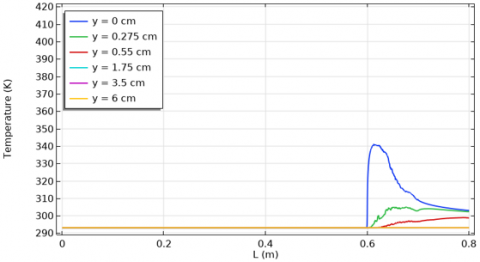
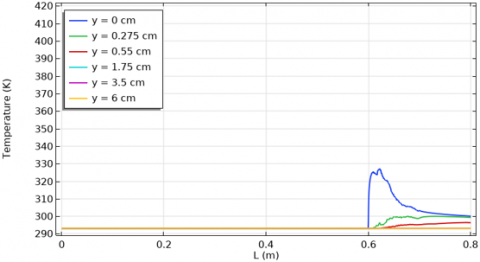
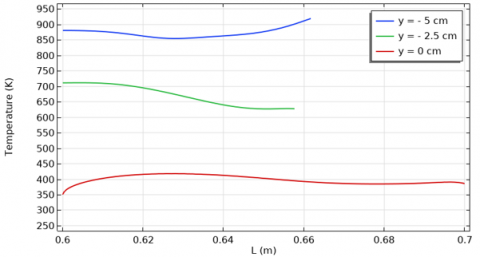
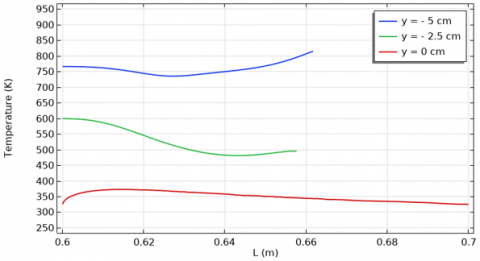
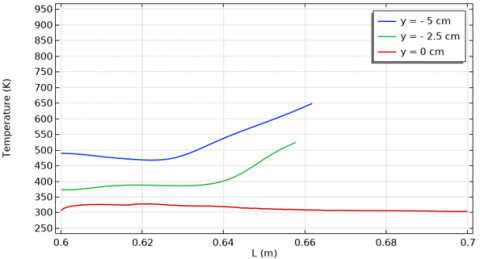
With two constant heat source powers of 20 W each, Figure 17 depicts the local temperature distribution in the channel-cavity assembly at varied input air velocities ranging from 0.1 to 1.5 m/s. Due to the absence of a heat source effect, the temperature remains at a minimal and constant value across the distance between the channel and cavity, whereas the presence of two heat sources results in a distinct temperature variation throughout the contact area. The temperature will fall as a result of the increase in inlet air velocity because more heat will be transferred from the heat source into the air stream. This was thoroughly validated using [47].
(a) Vin = 0.1 m/s
(b) Vin = 0.5 m/s
(c) Vin = 1 m/s
(d) Vin = 1.5 m/s
Figure 14. Local Nusselt number during negative y-axis in the cavity at a different inlet velocity
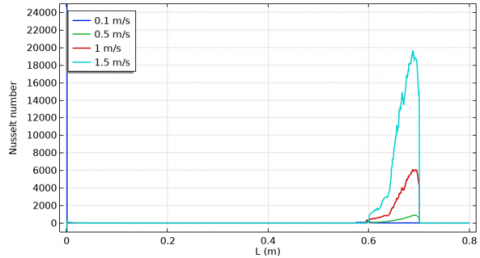
The average Nusselt number change with intake air velocity is shown in Figure 18 for a variety of inlet air speeds that varied from 0.1 to 1.5 m/s, two constant heat source powers of 20 W each, and a value of =0.4. The increase in the velocity of the air entering the system causes a rise in the mean Nusselt number. This is due to the fact that an increase in the velocity of the air entering the system will lead to an increase in the rate at which heat is transferred between the two heat sources, which will, in turn, lead to an increase in the coefficient of heat transfer and an increase in the average Nusselt number. This matched up quite well with evidence from [48].
The air velocity profile in the outlet channel passage flow is shown in Figure 19. The inlet air speeds varied from 0.1 to 1.5 m/s, and each of the two constant heat source powers was 20 W. Because of the influence of shear stress at the wall, the velocity profile seems to be at its lowest point at the channel wall while it reaches its highest point in the channel centre. This is because the effect of shear stress at the wall disappears in the channel centre. When the input air velocity is low, the distribution will have a parabolic shape; however, as the velocity increases, the shape will become flatter. This matched up quite well with evidence from [49].
Figure 15. Local velocity distribution in channel-cavity assembly for different inlet air velocity
Figure 16. Local pressure in channel-cavity assembly for different inlet air velocity
Figure 17. The local temperature in channel-cavity assembly for different inlet air velocity
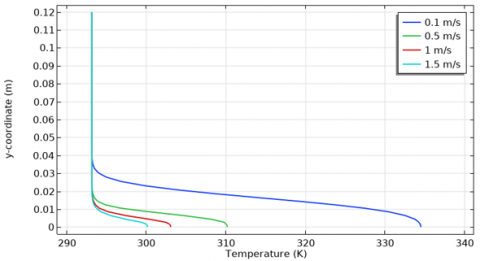
The temperature profile in the outlet channel passage flow can be shown in Figure 20, which was created using varied inlet air velocities ranging from 0.1 to 1.5 m/s and two constant heat source powers of 20 W each. The reduction in the y-direction will result in an increase in the temperature distribution. This is as a result of the fact that moving upward in the y-direction brings one in greater proximity to the combined impacts of two heat sources, which in turn leads the temperature distribution to be optimized to its fullest extent. This has the effect of lowering the temperature distribution throughout the air stream as a result of the increased natural convection that occurs as a result of an increase in the intake air velocity. This matched up quite well with evidence from [50].
Figure 18. Nusselt number in channel-cavity assembly for different inlet air velocity
Figure 19. The velocity profile in outlet channel passage flow at a different inlet air velocity
Figure 20. The temperature profile in outlet channel passage flow at a different inlet air velocity
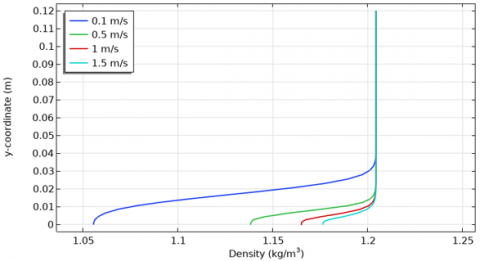
The air density profile in the outlet channel passage flow at various input air ranged from 0.1 to 1.5 m/s, and two constant heat source powers of 20 W each are shown in Figure 21. Because moving away from the source of heat causes an increase in y-directions, an increase in y-value causes an increase in the air density. Because of the increase in intake air velocity, the natural convection from the cavity into the air stream will also increase. This will result in a drop in air temperature, which will lead to an increase in air density. This matched up quite well with evidence from the paper of AL-Jibory et al. [51].
Figure 21. Air density profile in outlet channel passage flow at a different inlet air velocity
In this work, mixed convection heat transfer was computationally analyzed using COMSOL in a channel-open cavity with two 20 W heat sources and negligible top and bottom wall thickness. The provided numerical findings are for a variety of intake air velocities, which varied from 0.1 to 1.5 meters per second. In light of the findings that were just provided, the most important discoveries may be summed up as follows:
The temperature starts to fall steadily as one moves farther and further away from the site of the heat source and closer to the horizontal channel.
The higher the velocity of the air entering the cavity, the greater the natural convection that will be created by the heated heat sources.
The increase in inlet air velocity will increase the turbulence of airflow and thus increases the pressure distribution. The increase in absolute y-direction decreases the velocity distribution.
The value of pressure distribution remains constant at the top of the cavity (y=-5 cm) and oscillating with decreasing the absolute value of (y).
The increase in the inlet velocity of air will increase the transfer of heat. Thus, the Nusselt number will be great when increasing air flow velocity. At the interface between the cavity and channel (y=0), there is maximum heat transfer. Thus, the maximum Nusselt number is at the interface and reduces with increasing the absolute value of y.
The increase in inlet velocity of air means to increase in the natural convection from the cavity into the air stream and thus, decrease the temperature of the air, i.e., an increase in air density.
|
D |
Tube diameter (m) |
|
L |
Tube length (m) |
|
W |
Cavity width (m) |
|
H |
Cavity height (m) |
|
r |
Spherical radius of heat source in cavity (m) |
|
Tin |
Inlet temperature of flow (K) |
|
V |
Flow velocity (m/s) |
|
Pw |
Heat power source in cavity (W) |
|
Re |
Reynolds number (--) |
|
Ri |
Richardson number (--) |
|
Pr |
Prandtl number (--) |
|
Nu |
Nusselt number (--) |
|
g |
Gravitational acceleration (m/s2) |
|
P |
Pressure (Pa) |
|
Q |
Heat flux (W/m2) |
|
Greek symbols |
|
|
ρ |
Density of air (kg/m3) |
|
v |
Viscosity (kinematic) of air (m2/s) |
|
μ |
Viscosity (dynamic) of air (kg/m.s) |
|
ε |
Localised heat source Dimensionless length |
|
θ |
Dimensionless temperature |
|
β |
Coefficient of thermal expansion (1/K) |
|
α |
Air thermal diffusivity (m2/s) |
|
Subscripts |
|
|
in |
Inlet |
|
h |
Hot |
|
c |
Cold |
|
avg |
Average |
[1] Alam, E.M.M. (2012). Numerical study on conjugate effect of conduction and mixed convection flow in a rectangular ventilated cavity with a heat generating circular block. Post Graduate Thesis of Mathematics (Math), Department of Mathematics, Bangladesh University of Engineering and Technology.
[2] Manca, O., Nardini, S., Vafai, K. (2008). Experimental investigation of opposing mixed convection in a channel with an open cavity below. Experimental Heat Transfer, 21(2): 99-114. https://doi.org/10.1080/08916150701815820
[3] Sekhar, Y.R., Sharma, K., Kamal, S. (2016). Nanofluid heat transfer under mixed convection flow in a tube for solar thermal energy applications. Environmental Science and Pollution Research, 23: 9411-9417. https://doi.org/10.1007/s11356-015-5715-9
[4] Manca, O., Nardini, S., Khanafer, K., Vafai, K. (2003). Effect of heated wall position on mixed convection in a channel with an open cavity. Numerical Heat Transfer: Part A: Applications, 43(3): 259-282. https://doi.org/10.1080/10407780307310
[5] Shin, D.H., Kim, C.S., Park, G.C., Cho, H.K. (2017). Experimental analysis on mixed convection in reactor cavity cooling system of HTGR for hydrogen production. International Journal of Hydrogen Energy, 42(34): 22046-22053. https://doi.org/10.1016/j.ijhydene.2017.06.232
[6] Izadi, S., Armaghani, T., Ghasemiasl, R., Chamkha, A.J., Molana, M. (2019). A comprehensive review on mixed convection of nanofluids in various shapes of enclosures. Powder Technology, 343: 880-907. https://doi.org/10.1016/j.powtec.2018.11.006
[7] Kakaç, S., Yüncü, H., Hijikata, K. (1994). Cooling of Electronic Systems. 1 ed.: Springer Netherlands. https://doi.org/10.1007/978-94-011-1090-7
[8] Fu, W.S., Lian, S.H., Lai, Y.C. (2009). A mixed convection in a reciprocating P shape channel with opposite direction of gravity and inlet cooling fluids. Heat Mass Transfer, 45: 679-692. https://doi.org/10.1007/s00231-008-0464-7
[9] Manca, O., Nardini, S., Khanafer, K., Vafai, K. (2003). The effect of heated wall position on mixed convection in a channel with an open cavity. Numerical Heat Transfer, Part A, 43: 259-282. https://doi.org/10.1080/10407780390122664
[10] Aylı, E. (2020). Modeling of mixed convection in an enclosure using multiple regression, artificial neural network, and adaptive neuro-fuzzy interface system models. Journal of Mechanical Engineering Science, Proc IMechE Part C, 234(15): 1-16. https://doi.org/10.1177/0954406220914330
[11] Ozgen, F., Varol, Y. (2019). Numerical study of mixed convection in a channel filled with a porous medium. Applied Sciences, 9(2): 211. https://doi.org/10.3390/app9020211
[12] Laouira, H., Oudina, F.M., Hussein, A.K., Kolsi, L., Merah, A., Younis, O. (2019). Heat transfer inside a horizontal channel with an open trapezoidal enclosure subjected to a heat source of different lengths. Heat Transfer—Asian Research, 49(1): 406-423. https://doi.org/10.1002/htj.21618
[13] Bahlaoui, A., Raji, A., Lamsaadi, M., mi, M.N., Hasnaoui, M. (2007). Mixed convection in a horizontal channel with emissive walls and partially heated from below. Numerical Heat Transfer, Part A, 51(9): 855-875. https://doi.org/10.1080/10407780601112746
[14] Doghmi, H., Abourida, B., Belarche, L., Sannad, M., Ouzaouit, M. (2017). Mixed convection in a three-dimensional ventilated cavity with two isothermal heating Sections. E3S Web of Conferences, 22: 00036. https://doi.org/10.1051/e3sconf/20172200036
[15] Rahman, M.M., Parvin, S., Rahim, N.A., Hasanuzzaman, M., Saidur, R. (2012). Simulation of mixed convection heat transfer in a horizontal channel with an open cavity containing a heated hollow cylinder. Heat Transfer—Asian Research, 41(4): 339-353. https://doi.org/10.1002/htj.21002
[16] Ahmed, S.Y., Jabbar, M.Y., Hamzah, H.K., Ali, F.H., Hussein, A.K. (2020). Mixed convection of nanofluid in a square enclosure with a hot bottom wall and a conductive half‐immersed rotating circular cylinder. Heat Transfer, 49(8): 4173-4203. https://doi.org/10.1002/htj.21822
[17] Rahmati, A.R., Roknabadi, A.R., Abbaszadeh, M. (2016). Numerical simulation of mixed convection heat transfer of nanofluid in a double lid-driven cavity using lattice Boltzmann method. Alexandria Engineering Journal, 55(4): 3101-3114. https://doi.org/10.1016/j.aej.2016.08.017
[18] Rana, P., Bhargava, R. (2011). Numerical study of heat transfer enhancement in mixed convection flow along a vertical plate with heat source/sink utilising nanofluids. Communications in Nonlinear Science and Numerical Simulation, 16(11): 4318-4334. https://doi.org/10.1016/j.cnsns.2011.03.014
[19] Bahlaoui, A., Raji, A., Hasnaoui, M., Naïmi, M., Makayssi, T., Lamsaadi, M. (2009). Mixed convection cooling combined with surface radiation in a partitioned rectangular cavity. Energy Conversion and Management, 50(3): 626-635. https://doi.org/10.1016/j.enconman.2008.10.001
[20] Sabbar, W.A., Ismael, M.A., Almudhaffar, M. (2018). Fluid-structure interaction of mixed convection in a cavity-channel assembly of flexible wall. International Journal of Mechanical Sciences, 149: 73-83. https://doi.org/10.1016/j.ijmecsci.2018.09.041
[21] Gangawane, K.M., Gupta, S. (2018). Mixed convection characteristics in rectangular enclosure containing heated elliptical block: Effect of direction of moving wall. International Journal of Thermal Sciences, 130: 100-115. https://doi.org/10.1016/j.ijthermalsci.2018.04.010
[22] Rajamohan, G., Ramesh, N., Kumar, P. (2019). Mixed convection and radiation studies on thermally developing laminar flow in a horizontal square channel with variable side heated wall. International Journal of Thermal Sciences, 140: 298-307. https://doi.org/10.1016/j.ijthermalsci.2019.03.002
[23] Bahlaoui, A., Raji, A., Hasnaoui, M., Ouardi, C., Naïmi, M., Makayssi, T. (2011). Height partition effect on combined mixed convection and surface radiation in a vented rectangular cavity. Journal of Applied Fluid Mechanics, 4(1): 89-96.
[24] Mebarek-Oudina, F., Laouira, H., Aissa, A., Hussein, A.K., El Ganaoui, M. (2020). Ganaoui, convection heat transfer analysis in a channel with an open trapezoidal cavity: Heat source locations effect. MATEC Web of Conferences, 330: 01006. https://doi.org/10.1051/matecconf/202033001006
[25] Sivasankaran, S., Janagi, K. (2022). Numerical study on mixed convection flow and energy transfer in an inclined channel cavity: Effect of baffle size. Mathematical and Computational Applications, 27(1): 9. https://doi.org/10.3390/mca27010009
[26] Bahlaoui, A., Raji, A., Hasnaoui, M., El Ayachi, R., Naimi, M., Makayssi, T., Lamsaadi, M. (2008). Numerical study of mixed convection copled with radiation in a vented partitioned enclosure. Альтернативная энергетика и экология, (6): 131-137.
[27] Rahul, K.C. (2017). Numerical simulations of mixed convection from a horizontal channel with radiating heat sources. International Journal of Engineering Research & Technology, 6(1): 49-57.
[28] Esfe, M.H., Arani, A.A., Niroumand, A.H., Yan, W.M., Karimipour, A. (2015). Mixed convection heat transfer from surface-mounted block heat sources in a horizontal channel with nanofluids. International Journal of Heat and Mass Transfer, 89: 783-791. https://doi.org/10.1016/j.ijheatmasstransfer.2015.05.100
[29] Hussein, A.K., Hamzah, H.K., Ali, F.H., Kolsi, L. (2020). Mixed convection in a trapezoidal enclosure filled with two layers of nanofuid and porous media with a rotating circular cylinder and a sinusoidal bottom wall. Journal of Thermal Analysis and Calorimetry, 141: 2061-2079. https://doi.org/10.1007/s10973-019-08963-6
[30] Abd Al-Hassan, A.Q., Ismael, M.A. (2019). Numerical study of double diffusive mixed convection in horizontal channel with composite open porous cavity. Special Topics & Reviews in Porous Media-An International Journal, 10(4): 401-419. https://doi.org/10.1615/SpecialTopicsRevPorousMedia.2019029342
[31] Laouira, H., Oudina, F.M., Hussein, A.K., Kolsi, L., Merah, A., Younis, O. (2019). Heat transfer inside a horizontal channel with an open trapezoidal enclosure subjected to a heat source of different lengths. Heat Transfer—Asian Research, 49(1): 406-423. https://doi.org/10.1002/htj.21618
[32] Rashid, F.L., Khalaf, A.F., Hussein, A.K., Hamida, M.B., Ali, B., Younis, O. (2022). Thermal-hydraulic analysis of transient conjugate heating between hemi-spherical body and air. Frontiers in Heat and Mass Transfer (FHMT), 19(21). http://dx.doi.org/10.5098/hmt.19.21
[33] Rashid, F.L., Fakhrulddin, S.K., Eleiwi, M.A., Hussein, A.K., Tahseen, T.A., Younis, O., Ahmed, M.I. (2022). CFD simulation in thermal-hydraulic analysis of air flow on different attack angles of row flat tube. Frontiers in Heat and Mass Transfer (FHMT), 19(6). https://doi.org/10.5098/hmt.19.6
[34] Rashid, F.L., Hussein, A.K., Malekshah, E.H., Abderrahmane, A., Guedri, K., Younis, O. (2022). Review of heat transfer analysis in different cavity geometries with and without nanofluids. Nanomaterials, 12(14): 2481. https://doi.org/10.3390/nano12142481
[35] Eleiwi, M.A., Rashid, F.L., Khalaf, A.F., Tuama, S.A. (2022). Numerical investigation of conjugate heat transfer between spherical solid body and fluid. Mathematical Modelling of Engineering Problems, 9(2): 491-497. https://doi.org/10.18280/mmep.090227
[36] Altaie, A., Hasan, M.R., Rashid, F.L. (2014). Numerical heat transfer and turbulent flow in a circular tube fitted with opened rings having square cross section. Journal of Basic and Applied Scientific Research, 4(11): 28-36.
[37] Rashid, F.L., Altaie, A., Hasan, M.R. (2014). Numerical investigation of heat transfer enhancement in a circular tube using ribs of separated ports assembly. European Scientific Journal, 2: 172-183.
[38] Altaie, A., Hasan, M.R., Rashid, F.L. (2015). Numerical investigation of heat transfer enhancement in a circular tube with rectangular opened rings. Bulletin of Electrical Engineering and Informatics, 4(1): 18-25. https://doi.org/10.11591/eei.v4i1.331
[39] Altaie, A., Hasan, M.R., Rashid, F.L. (215). Heat transfer enhancement in a circular tube using ribs with middle arm. Elixir International Journal.
[40] Altaie, A., Hasan, M.R., Rashid, F.L. (2015). Numerical investigation in a circular tube to enhance turbulent heat transfer using opened rings-triangular cross section. Journal of Babylon University/ Engineering Sciences, 23(3).
[41] Rashid, F.L., Al-Jibory, M.W., Hussein, H.Q. (2017). Cooling enhancement in gas turbine blade using coated circular ribs with a new nanocomposite material. Patent (5092).
[42] Al-Jibory, M.W., Rashid, F.L., Hussein, H.Q. (2018). Heat transfer augmentation in gas turbine blade rectangular passages using circular ribs with fins. Journal of University of Babylon, Engineering Sciences, 26(1): 247-258.
[43] Al-Jibory, M.W., Rashid, F.L., Talib, Sh.M. (2018). Numerical investigation of heat transfer enhancement in ribbed elliptical passage. Journal of Engineering and Applied Sciences, 13(17): 7223-7234.
[44] Rashid, F.L., Azziz, H.N., Hussein, E.Q. (2018). Heat transfer enhancement in air cooled gas turbine blade using corrugated passages. Journal of Petroleum Research & Studies, 20: 52-69.
[45] Azziz, H.N., Shareef, A.S., Rashid, F.L. (2018). Experimental investigation of the heat transfer for the effect of nanoparticles with different base fluid and solar collector tilt angle. Journal of Engineering and Applied Sciences, 13(13): 10614-10620.
[46] Aljibory, M.W., Rashid, F.L., Alais, S.M. (2018). An Experimental and numerical investigation of heat transfer enhancement using annular ribs in a tube. IOP Conference Series: Materials Science and Engineering, 433(1): 012057. https://doi.org/10.1088/1757-899X/433/1/012057
[47] Rashid, F.L., Al-Jibory, M.W., Talib, Sh.M. (2018). Numerical investigation of heat transfer augmentation in elliptical passage with different rib geometries and aspect ratios. International Journal of Mechanical Engineering and Technology, 9(13): 1390-1409.
[48] Al-Jibory, M.W., Rashid, F.L., Talib, Sh.M. (2018). An experimental investigation of heat transfer enhancement in elliptical passage fitted with different rib geometries. International Journal of Mechanical Engineering and Technology, 9(13): 1033-1048.
[49] AL-Jibory, M.W., Rashid, F.L., Talib, Sh.M. (2020). Review on cooling enhancement of different shape gas turbine ribbed blade with thermal barrier coating. International Journal of Scientific Research and Engineering Development, 3(1): 313-329.
[50] Hussein, H.Q., Al-Jibory, M.W., Rashid, F.L. (2020). Heat transfer enhancement of gas turbine blades using coated ribs with nanocomposite materials. Journal of Mechanical Engineering Research and Developments, 43(6): 9-22.
[51] AL-Jibory, M.W., Rashid, F.L., Hussein, H.Q. (2020). Review of heat transfer enhancement in air-cooled turbine blades. International Journal of Scientific & Technology Research, 9(4): 3123-3130.