Lei Wang* | Lei Chen | Lei Gao
© 2022 IIETA. This article is published by IIETA and is licensed under the CC BY 4.0 license (http://creativecommons.org/licenses/by/4.0/).
OPEN ACCESS
The abnormalities in the mine ventilation system can reflect the risks and hidden dangers during the mine production. By combining the basic information of the mine and the ventilation monitoring data with the production status, the gas concentration and wind speed are used as the calculation indicators, and the k-nearest neighbor (KNN) is used to study the abnormal change characteristics of calculation indicators of mine ventilation system in different ventilation periods, and a ventilation hazard warning model was constructed and the model results were compared and validated. In addition, the dominant factors of the warning level were obtained by combining the grey correlation analysis (GCA). The results show that under different ventilation periods (easy ventilation period and difficult ventilation period), the correct rates of calculation and verification in easy ventilation period and difficult ventilation period are 95.65% and 97.82% respectively. It can be seen that the accuracy of the warning model is over 95%, which has good application and promotion value. Furthermore, the correlation coefficient of the wind speed in two periods is relatively high, which is indicating that the speed is the main indicator that affects the warning level. The research of this paper can provide theoretical support for realizing the intelligent management of mine risk in advance and short-term early warning.
coal mine ventilation, disaster warning, k-nearest neighbor, grey correlation analysis, intelligent management
Coal occupies a pivotal position in China's energy structure, and the demand for coal will still be huge in the future [1, 2]. Coal mining is complex, and the unique nature of the mining environment exposes workers to significant safety hazards. The occurrence of coal mine accidents will seriously affect the normal production of coal mines and the safety of people's lives and properties. Among them, the ventilation disasters are the most dangerous and injurious type of coal mine accidents [3]. The main purpose of the ventilation system is to ensure the safe production of coal resources in the mining process, and therefore requires precise implementation of safety work. Although many coal mining enterprises have invested enough money and effort in ventilation systems, the safety accidents still occur to varying degrees. With the introduction of the concept of smart mines, under the current trend of intelligent transformation of coal mining enterprises, the underground ventilation safety monitoring equipment has become more and more perfect, and the accumulated ventilation historical data contains a large amount of information. Effectively describe the overall changes in the ventilation system [4]. Therefore, it is extremely important to accurately provide short warning of coal mine ventilation disasters.
At present, many scholars have studied the warning of coal mine ventilation disasters from the perspective of data mining. Xu and Zong [5] constructed a gray neural network model, and used the nonlinear fitting method to approach the real value, and realized the prediction of gas concentration with a small sample size. Ma et al. [6] proposed a neural network model based on particle swarm algorithm, which was applied to the prediction of gas concentration and showed a high accuracy rate. Liu [7] proposed a safety situation warning method based on risk of ventilation accident, and obtained accurate verification between the predicted results and the actual results. However, the above methods often have problems such as a large number of samples, long time consumption, and low accuracy, and cannot provide warning of coal mine ventilation disasters quickly and effectively. k-nearest neighbor (KNN) is an effective non-parametric classification algorithm based on statistics, which has the advantages of small sample size, short time consumption, accuracy, etc., and can quickly realize the warning of coal mine ventilation disasters [8-10]. In addition, combined with the grey correlation analysis (GCA), the dominant factors affecting disaster warning can be obtained on the basis of disaster warning, and a more comprehensive understanding of disaster warning can be obtained [11-12].
In this paper, the ventilation historical data of a coal mine in Shaanxi Province is used as a sample for analysis, and the warning index data of several roadways under different ventilation periods were obtained by underground ventilation monitoring and used as training set. On this basis, the KNN method is used to calculate and predict the ventilation warning level of other roadways, and then the main factors affecting the warning level are calculated by the GCA method. The chapter 1 introduces the research significance, research status and research content of this paper. The chapter 2 presents an introduction to the algorithms covered in this paper, including the KNN method and the GCA method. The chapter 3 is the engineering application. Firstly, the selection of warning indicators and the basis of the classification of warning levels are introduced; secondly, the KNN method is used to calculate the warning levels and verify their reliability, and the selection method of optimal K values is introduced. Finally, based on the KNN method, the dominant factors affecting the warning level are obtained by combining the GCA method. The purpose of this paper is to provide auxiliary decision support for mine ventilation disaster warning.
2.1 KNN principle
KNN method is a more mature classification algorithm. Its core idea is [13-15]: a sample belongs to a class if the majority of its K most similar samples in the feature space belong to that class. The classification decision rule of KNN is based on the idea of minority rule over majority. For the class decision, KNN will rely on only one or a few nearest neighbors to determine the class of the point to be classified. As shown in Figure 1, when we want to determine which category a circle belongs to, we can judge it according to its nearest category as the standard. If K=3 (inner circle range), the proportion of triangles is 2/3, so the circle is the same as the triangle; If K=5 (outer circle range), the square proportion is 3/5, so the circle is the same as the square.

Figure 1. Schematic diagram of KNN algorithm
2.2 KNN algorithm flow
The classification process of KNN method is shown in Figure 2 [16, 17]:
(1) The training data are selected and the sample size of the selected data cannot be too large or too small.
(2) To calculate the distance between the data to be classified and each training data, the commonly used distance calculation formula is as follows:
Euclidean distance:
$D\left(x_{i}, x_{n e w}\right)=\sqrt{\left(x_{n e w}-x_{i}\right)^{T}\left(x_{n e w}-x_{i}\right)}$ (1)
The horse type distance:
$D\left(m, x_{\text {new }}\right)=\left(x_{\text {new }}-m\right) C\left(x_{\text {new }}-m\right)$ (2)
In Eq. (2), $m=\frac{1}{N} \sum_{i=1}^{N} x_{i}, C=\frac{1}{N} \sum_{i=1}^{N}\left(x_{i}-m\right)\left(x_{i}-m\right)^{T}$. Euclidean distance is used in this paper.
(3) The K points with the smallest distance from the data point are selected, and K is generally an odd number to avoid the situation that the number of categories is the same.
(4) Count the frequency of categories in K points.
(5) The category with the highest percentage of the K points is selected as the category of the data to be classified.
(6) The function of the classification decision rule is to determine the category y of the new input sample point x. Majority voting is adopted in this paper, and the formula is:
$y=\arg \max _{c_{j}} \sum_{x_{i} N_{k}(x)} I\left(y_{i}=c_{j}\right)$ (3)
where, i=1,2,…, N; j=1,2,…,k, Nk(x) is the field of x covering k nearest training sample points; I is the indicator function, yi is the test sample label, and I is 1 when yi=cj, or 0 otherwise.
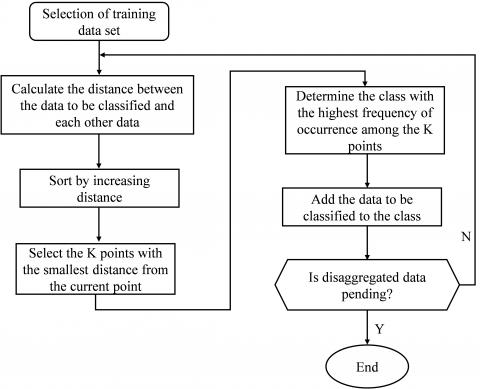
Figure 2. Flow chart of KNN algorithm
For this study, the ventilation-related data of a certain tunnel in the mine is obtained through information collection, and then the data is passed into the k-nearest neighbor algorithm model constructed above to calculate the Euclidean distances between all samples and the new samples, and the distances are sorted from smallest to largest; the k training set samples with the closest distances to new samples are selected, and the new samples are labeled in whichever category occurs most frequently in the selected samples.
The KNN method does not require pre-training, has a simple and easy to understand model structure, is relatively accurate and is not very sensitive to outliers. The drawback of the KNN method is the sample imbalance problem. For example, if some samples in the training set are larger than others, the KNN method will be more biased to classify the samples to be classified in that class. In addition, another disadvantage of the KNN method is that the model is sensitive to the K-value setting, which needs to be set in advance, and different K-values will have a direct impact on the classification results.
2.3 GCA method
The magnitude of the correlation between the factors of two systems over time or across different objects is called the degree of correlation. In the process of system development, two factors can be considered to be highly correlated if their trends of change are consistent; conversely, they are less correlated. Therefore, the gray correlation analysis method is a way to measure the association degree between factors based on the degree of similarity or difference in development trends between factors.
The calculation steps of grey correlation analysis are as follows [18, 19]:
(1) Determine the analysis sequence
Determine the reference and comparison series. The reference and comparison series correspond to the data series that reflect the behavioral characteristics of the system and influence the behavioral characteristics of the system, respectively.
Let the reference sequence (also called the parent sequence) be $Y=\{Y(k) \mid k=1,2, \cdots, n\}$; The comparison sequence (also known as the "subsequence") is $X_{i}=\left\{X_{i}(k) \mid k=1,2, \cdots, n\right\}, i=1,2, \cdots, m$.
(2) Dimensionless generalization of variables
The data in each factor column in the system may be different in dimension, it is not convenient for comparison or difficult to get the correct conclusion during comparison. Therefore, dimensionless data processing is generally required in grey relational degree analysis.
(3) Calculating correlation coefficient
Correlation coefficient of $x_{0}(k)$ and $x_{1}(k)$:
$\xi(k)=\frac{\min _{i} \min_{k}\left|x_{0}(k)-x_{i}(k)\right|+\rho \max _{i} \max _{k}\left|x_{0}(k)-x_{i}(k)\right|}{\left|x_{0}(k)-x_{i}(k)\right|+\rho \max _{i} \max _{k}\left|x_{0}(k)-x_{i}(k)\right|}$ (4)
where, $\left|x_{0}(k)-x_{i}(k)\right|$ is the absolute difference between x0 and xi in the k point; $\min _{i} \min _{k}\left|x_{0}(k)-x_{i}(k)\right|$ is the minimum difference between two stages, $\min _{k}\left|x_{0}(k)-x_{i}(k)\right|$ is the minimum difference of first order, $\min _{i}\left|x_{0}(k)-x_{i}(k)\right|$ is the second-order minimum difference; $\max _{i} \max _{k}\left|x_{0}(k)-x_{i}(k)\right|$ is the maximum difference of two levels, and its meaning is similar to the minimum difference; $\rho$ is the resolution coefficient between [0,1], usually take $\rho=0.5$ .
(4) Calculated correlation degree
By integrating the correlation coefficients of each point, the correlation degree ri of the whole xi curve and the reference curve x0 can be obtained, which can be calculated by the following formula:
$r_{i}=\frac{1}{n} \sum_{k=1}^{n} \xi(k)$ (5)
(5) Correlation rank
The correlation degree is sorted by size, and if r1 < r2, the reference sequence y is more similar to the comparison sequence x2.
After calculating the correlation coefficient between Xi(k) sequence and Y(k) sequence, calculate the average of the various correlation coefficients. The mean value ri is called the correlation between Y(k) and Xi(k).
3.1 Indicator selection
The prediction of coal mine ventilation disasters in this paper aims to provide some decision support for the safe production of coal mines. In this paper, gas concentration and wind speed are selected as early warning indicators, both of which can be obtained not only through quantitative calculation or dynamic monitoring, but also their safety threshold values are clearly defined in the ‘Coal Mine Safety Regulations’ or other relevant laws and regulations. Taking the original data obtained from "DaHaiZe Coal Mine" in Shaanxi Province as an example, the original data of 46 roadways in the period of easy ventilation and the period of difficult ventilation were collected respectively. Among them, the first 41 samples are training samples, and the last 5 samples are test samples, and use SPSS 22.0 implementation model establishment, parameter selection and results prediction.
3.2 Basis of the division of warning level
In accordance with the relevant provisions in the "Coal Mine Safety Regulations", combined with the classification of coal mine ventilation warning levels in literature [6], this paper gives warning levels based on gas concentration and tunnel wind speed indicators. According to the determined safety situation assessment level domain and the experience of experts in coal mine related fields, the safety situation warning level of coal mine gas accident is determined to be four levels.
As shown in Table 1, when the gas concentration in a roadway is between 0 and 0.5% and the wind speed is greater than 4 m/s, the disaster risk of the roadway can be determined to a grade IV warning, and use analogy to judge other grades. The level of IV means that the abnormality of the current security situation is very low and level I means that the current security situation has reached a very dangerous level. Combined with the overview of the previous section, the indicator training data is shown in Table 2. In order to facilitate data processing, the processing methods of the four warning levels correspond to values 0-4 respectively.
Table 1. Warning level table
|
Warning indicators |
Class IV |
ClassⅢ |
Class Ⅱ |
Class Ⅰ |
|
Gas concentration (%) |
[0,0.5] |
(0.5,0.8] |
(0.8,1] |
>1 |
|
Roadway wind speed(m/s) |
>4 |
[1,4) |
[0.5,1) |
[0.25,0.5) |
|
Status logo |
green |
yellow |
orange |
red |
Table 2. Indicator training data
|
Easy period of roadway ventilation |
Difficult period of roadway ventilation |
||||||||
|
Rn |
Ws(m/s) |
Gc(%) |
Wl |
Pc |
Rn |
Ws(m/s) |
Gc(%) |
Wl |
Pc |
|
1 |
0.90 |
0.83 |
Ⅱ |
2 |
1 |
0.96 |
0.85 |
Ⅱ |
2 |
|
2 |
0.61 |
0.95 |
Ⅱ |
2 |
2 |
0.89 |
0.85 |
Ⅱ |
2 |
|
3 |
2.03 |
0.58 |
Ⅲ |
3 |
3 |
3.52 |
0.72 |
Ⅲ |
3 |
|
4 |
0.50 |
2.24 |
Ⅰ |
1 |
4 |
0.43 |
1.23 |
Ⅰ |
1 |
|
5 |
2.79 |
0.55 |
Ⅲ |
3 |
5 |
0.90 |
0.95 |
Ⅱ |
2 |
|
6 |
4.33 |
0.10 |
IV |
4 |
6 |
4.49 |
0.22 |
IV |
4 |
|
7 |
1.15 |
0.71 |
Ⅲ |
3 |
7 |
3.30 |
0.79 |
Ⅲ |
3 |
|
… |
… |
… |
… |
… |
… |
… |
… |
… |
… |
|
42 |
0.67 |
0.92 |
Ⅱ |
2 |
42 |
0.27 |
1.79 |
Ⅰ |
1 |
|
43 |
0.27 |
2.66 |
Ⅰ |
1 |
43 |
0.25 |
1.34 |
Ⅰ |
1 |
|
44 |
4.16 |
0.14 |
IV |
4 |
44 |
5.80 |
0.26 |
IV |
4 |
|
45 |
5.69 |
0.13 |
IV |
4 |
45 |
1.50 |
0.54 |
Ⅲ |
3 |
|
46 |
2.86 |
0.50 |
Ⅲ |
3 |
46 |
0.78 |
0.88 |
Ⅱ |
2 |
Note: Rn—Roadway number, Ws-wind speed, Gc-Gas concentration, Wl-Warning level, Pc-Processing code
3.3 KNN calculation
The wind speed and gas concentration are taken as input parameters, that is, the training set is 41 vectors with 2 parameters. The Euclidean distance is used to calculate 5 sets of test data, obtain the distance ranking of the nearest k points, and determine the classification to which they belong according to the majority principle. The calculation results of the first selected test group (k=3) are compared with the determined verification group classification to preliminarily judge the feasibility of the algorithm. As shown in Table 3, the calculated results of the test group under the two ventilation periods are consistent with those of the training group, indicating the feasibility of using the KNN method. In addition, according to the comparison between the calculated values of all samples and the original values, the accuracy of KNN method can be obtained; When k=3, the correct rates of calculation and verification in easy ventilation period and difficult ventilation period are 95.65% and 97.82% respectively. It can be seen that the KNN method is very feasible for coal mine ventilation disaster warning.
Table 3. Verification results of KNN algorithm test group (k=3)
|
Easy ventilation period of tunnel |
Difficult ventilation period of tunnel |
||||||||
|
Rn |
Ws (m/s) |
Gc (%) |
Pc |
Cr |
Rn |
Ws (m/s) |
Gc (%) |
Pc |
Cr |
|
42 |
0.67 |
0.92 |
2 |
2 |
42 |
0.27 |
1.79 |
1 |
1 |
|
43 |
0.27 |
2.66 |
1 |
1 |
43 |
0.25 |
1.34 |
1 |
1 |
|
44 |
4.16 |
0.14 |
4 |
4 |
44 |
5.80 |
0.26 |
4 |
4 |
|
45 |
5.69 |
0.13 |
4 |
4 |
45 |
1.50 |
0.54 |
3 |
3 |
|
46 |
2.86 |
0.50 |
3 |
3 |
46 |
0.78 |
0.88 |
2 |
2 |
Note: Rn-Roadway number, Ws-wind speed, Gc-Gas concentration, Pc-Processing code, Cr-Calculation results
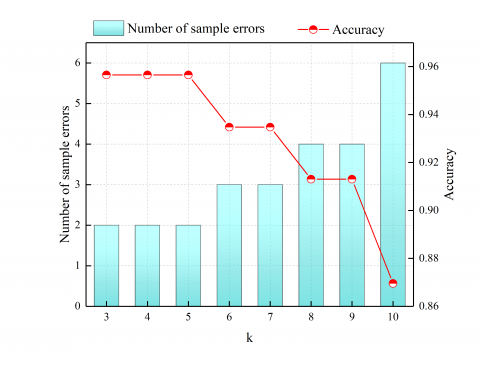
3.4 Selection of optimal K value
(a) easy ventilation period
(b) difficult ventilation period
Figure 3. Relationship between k value and algorithm accuracy in different ventilation periods
The advantage of KNN method lies in the easy implementation of the algorithm and the strong compatibility of data noise, the classification of data depends on the selection of k value, so it is also necessary to select the appropriate k value. In contrast, the KNN method is a reactive algorithm, and different values of k lead to differences in the fine-reading of the algorithm [20]. Therefore, by comparing the calculation results of k value in the range of 3-10, this paper obtains the accuracy of the algorithm under different k values, and selects the most appropriate k value. It can be seen from Figure 3 that in the period of easy ventilation, when k is in the range of 3~5, the accuracy rate of the calculation result is the highest (95.65%), that is, only two of the 46 groups of sample data have deviation from the original classification; In the period of difficult ventilation, when k=3, the accuracy of the calculation result is the highest (97.82%), that is, only one of the 46 groups of sample data has a deviation from the original classification. It can be seen that the k value has an important impact on the accuracy of the algorithm, and it is very necessary to select the appropriate k value.
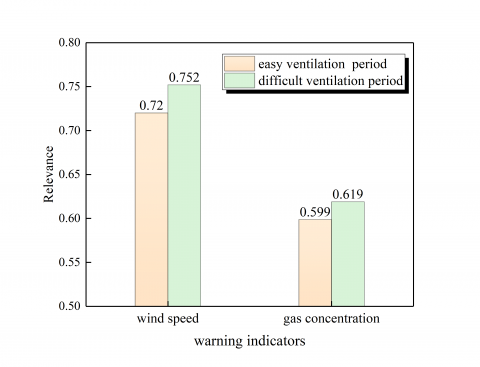
3.5 GCA calculation
It can be seen from the contents of the previous sections that the KNN can calculate the warning level of mine ventilation disasters. However, this approach is difficult to achieve when it comes to understanding which factors are key to changing the warning level. Therefore, the key factors affecting the warning level can be obtained on the basis of the KNN, combined with the gray correlation analysis, then the warning of mine ventilation disasters can be achieved faster.
Figure 4. Correlation between wind speed, gas concentration and warning level in different ventilation periods
When taking the sequence of warning level as the parent sequence, and taking the sequence of tunnel wind speed and gas concentration as the reference sequence, the correlation between the wind speed, gas concentration and the warning level in different ventilation periods can be calculated. As shown in Figure 4, the correlation coefficient of the tunnel wind speed in two periods is relatively high, which is indicating that the tunnel wind speed is the dominant factor leading to the change of the warning level. Therefore, it is necessary to strengthen the control of the wind speed in tunnels.
In this paper, the gas concentration and the wind speed were selected as early warning indicators, and the original data of 46 tunnels were collected in the easy and difficult ventilation periods respectively. The results show that under different ventilation periods (easy ventilation period and difficult ventilation period), the correct rates of calculation and verification in easy ventilation period and difficult ventilation period are 95.65% and 97.82% respectively. Furthermore, the correlation coefficient of the wind speed in two periods is relatively high, which is indicating that the speed is the main indicator that affects the warning level.
However, the limitations of the state of technology make the dataset for machine learning insufficient and the format is not standardized enough, and these two factors together lead to the machine learning model predictions in this paper not being completely correct. In future research, the design indicators can be screened with the downhole monitoring and evaluation data, and the design indicators with better processing effects can be selected and put into the training set. The design experience and database that can be widely used are formed in combination with machine learning methods such as KNN. This method can provide theoretical guidance in coal mine safety production, form a reliable intelligent identification system, improve mine mining efficiency and continuously enrich the application.
[1] China Coal Industry Association. (2018). Annual report on the development of the coal industry. Beijing: China Coal Industry Association, 2019.
[2] Qian, M.G., Xu, J.L., Wang, J.C. (2018). Further on the sustainable mining of coal. Journal of China Coal Society, 43(1): 1-13. https://doi.org/10.13225/j.cnki.jccs.2017.4400-en
[3] Deng, J., Xiao, Y., Li, Q., Lu, J., Wen, H. (2015). Experimental studies of spontaneous combustion and anaerobic cooling of coal. Fuel, 157: 261-269. https://doi.org/10.1016/j.fuel.2015.04.063
[4] Liu, F., Cao, W.J., Zhang, J.M. (2019). Continuously promoting the coal mine intellectualization and the high-quality development of China’s coal industry. China Coal, 45(12): 32-37.
[5] Xu, L., Zong, M. (2014). Genetic algorithm optimization neural network-based prediction of coal mine gas concentration. Journal of Heilongjiang University of Science and Technology, 24(4): 401-404. https://doi.org/10.1016/0378-5173(94)00339-7
[6] Ma, L., Pan, S.B., Dai, X.G., Song, S., Shi, X.L. (2020). Gas concentration prediction model of working face based on PSO-Adam-GRU. Journal of Xi’an University of Science and Technology, 40(2): 363-368. https://doi.org/10.13800/j.cnki.xakjdxxb.2020.0224
[7] Liu, F. (2021). Research on prediction and early warning of coal mine gas risk situation. China University of Mining and Technology, 2021.
[8] Lin, P.Q., Chen, L.T., Lei, Y.W. (2018). Short-term prediction of subway passenger flow based on K-nearest neighbor pattern matching. Journal of South China University of Technology (Natural Science Edition), 46(1): 50-57.
[9] Liu, C., Cao, L. (2015). A coupled k-nearest neighbor algorithm for multi-label classification. In Pacific-Asia Conference on Knowledge Discovery and Data Mining, 176-187. https://doi.org/10.1007/978-3-319-18038-0_14
[10] Dong, S., Luo, T., Zhong, L., Chen, L., Xu, X. (2017). Fault diagnosis of bearing based on the kernel principal component analysis and optimized k-nearest neighbour model. Journal of Low Frequency Noise, Vibration and Active Control, 36(4): 354-365. https://doi.org/10.1177/1461348417744302
[11] Liu, X., Wang, Q., Wang, T., Zhang, L. (2013). Assessment of interconnected power grid operation security based on grey correlation analysis. In 2013 3rd International Conference on Consumer Electronics, Communications and Networks, 174-177. https://doi.org/10.1109/CECNet.2013.6703300
[12] Yan, W. (2013). Grey correlation analysis on tourism industry in Jiangsu province. In Proceedings 2013 International Conference on Mechatronic Sciences, Electric Engineering and Computer (MEC), 1906-1911. https://doi.org/10.1109/MEC.2013.6885364
[13] Xu, Y.T., Chen, J.R., Qian, B., Li, B.Y., Lou, H.F. (2018). Research on regional foundation treatment scheme selection based on K-nearest neighbor algorithm. Journal of Zhejiang Institute of Communications, 19(4): 25-28+45. https://doi.org/10.3969/j.issn.1671-234X.2018.04.005
[14] Peng, X., Chen, R., Yu, K., Ye, F., Xue, W. (2020). An improved weighted K-nearest neighbor algorithm for indoor localization. Electronics, 9(12): 2117. https://doi.org/10.3390/electronics9122117
[15] Yang, L. (2020). Uncertainty prediction method for traffic flow based on K-nearest neighbor algorithm. Journal of Intelligent & Fuzzy Systems, 39(2): 1489-1499. https://doi.org/10.3233/JIFS-179923
[16] Wang, H., Men, B., Lei, N. (2019). Research and application of K-nearest neighbor algorithm in government procurement data. Intelligent Computer and Applications, 9(3): 269-272. https://doi.org/10.3969/j.issn.2095-2163.2019.03.063
[17] Lv, H.Z. (2019). Application of k-nearest neighbor algorithm in air quality measurement--Ozone day judgment. Electronic production, 4: 65-67.
[18] Yan, R. (2014). Innovation capacity and economic growth study based on gray correlation analysis-Comparative study of Shandong Province and Guangdong Province. In The 26th Chinese Control and Decision Conference (2014 CCDC), pp. 5325-5330. https://doi.org/10.1109/CCDC.2014.6852214
[19] Dong, J., Ji, H., Miao, L. (2019). Reliability analysis of electric human factors based on grey correlation analysis. In IOP Conference Series: Earth and Environmental Science, 252(3): 032128.
[20] Jia, L. (2018). Slope stability prediction based on K-nearest neighbor algorithm. Inner Mongolia Coal Economy, 19: 113-114. https://doi.org/10.3969/j.issn.1008-0155.2018.19.061