Yidian Dong | Yagebai Zhao*
© 2022 IIETA. This article is published by IIETA and is licensed under the CC BY 4.0 license (http://creativecommons.org/licenses/by/4.0/).
OPEN ACCESS
Aerodynamic resistance, also called the aerodynamic drag, can greatly affect the movements of athletes during high-speed sports. In terms of skiing, the wind environment of the venue creates pushing force or dragging force on the body of skiers during their skiing process in the ski resort. The sliding velocity and the work against resistance are greatly affected by wind, so how to reduce the work against wind resistance is a research focus of sports science. This study conducted wind tunnel experiment on physical skier models. At first, non-contact 3D measurement was carried out to measure the body of a certain skier and several skier models were scanned and printed; then, for the typical movement postures made by the skier in the Yabuli Ski Training Base which is located in the Heilongjiang province of China, wind tunnel experiment was conducted to study the relationship between the air drag coefficient and the wind speed during the skiing process. The results show that the drag coefficient does not change with wind speed during the skiing process. Parameters such as the skier’s height, posture, and frontal area on the windward side have a certain impact on the drag coefficient. The greater the height of the skier, the larger the drag coefficient. The laws summarized in this paper could be used by athletes to adopt rational tactics and optimize their postures during training, thereby improving their competition performance.
resistance, movement, posture, wind tunnel experiment, drag coefficient
Regarding the data collection of wind-induced resistance of athletes, world field scholars have conducted a lot of research on this topic with the help of computational fluid dynamics (CFD) and wind tunnel experiment, for example, Chen and Fang [1] performed numerical simulation on skier using both time-variant and time-invariant 2D models to explore the impact of wind and movement postures on the aerodynamic performance of skiers during skiing process. Mannion et al. [2] employed CFD approaches to conduct full-scale simulations on cyclists’ combinatorial riding postures including upright, squat, timed, and compact-framed postures to study the mutual aerodynamic interactions between cyclists in a pair. Basri et al. [3] conducted a numerical analysis of the air resistance of three different time trial bicycle helmets in two different head positions. The computational fluid dynamics (CFD) method was used to study the detailed airflow pattern around the bicycle at 15 m/s with no wind speed. Barry et al. [4] conducted wind tunnel experiment on a team of four athletes at the Monash University Wind Tunnel Laboratory to study the aerodynamic interactions among cyclists during cycling competitions. Meyer et al. [5] tested the aerodynamic characteristics of skiers in a wind tunnel and built drag coefficient models to study the aerodynamic energy loss of dynamic and compact skiing techniques. Yamanobe et al. [6] carried out wind tunnel experiment on a comprehensive model to prove the impact of upper limb position during ski jumping flight process, and the results indicate that the aerodynamic force can be adjusted by changing the body postures such as the arm angle. Chowdhury et al. [7] studied the impact of the surface morphology of sportswear made of four different materials on the aerodynamic performance, the microstructure was observed with a scanning electron microscope, the experimental results demonstrate that the surface structure of the sportswear has a significant impact on aerodynamic drag, and a drag coefficient between the two was proposed in the study. Meile et al. [8] used a full-scale Reynolds number model to investigate the aerodynamic behavior of ski jumper and applied a standard RANS code in the computation. Chowdhury et al. [9] designed a complete ski suit and evaluated the aerodynamic performance of different ski suit accessories for skiers and jumpers, such as the boots, snow goggles, helmets, and gloves, etc.; and the results suggest that the ski tights designed in the study have extra advantages over regular ski tights in terms of aerodynamics. Schenau [10] used a wind tunnel to test the air friction of speed skaters with six different-type body shapes to study the relationship between drag coefficient and air velocity and the impact of different skating postures on the drag force, the results revealed that the air friction coefficient is closely related to air velocity, and the impact of posture, ice condition, and height on the athletes was predicted via experiment. Asai et al. [11] applied a lattice Boltzmann method to visualizing the downhill flow of skiers. D’Auteuil et al. [12] experimented on the speed skaters skating in an indoor elliptical ice rink under turbulent flow conditions, and the results indicate that with the decrease of the Reynolds number, the drag coefficient is greatly affected by flow conditions, and the effects of three different positions of the speed skater are different.
After reviewing foreign and domestic wind tunnel experiments, it’s found that most low-speed wind tunnels adopt fixed floor, during the experiment, the floor and the athlete model are in a relatively static state, which contradicts the actual situation that the athlete is in motion relative to the ground. Moreover, in large-scale wind tunnels, since the sectional area of the test section is too large, the Particle Image Velocimetry (PIV) technology couldn’t be applied to the measurement of the fine flow field structure, so it’s impossible to study the aerodynamic drag reduction mechanism of athletes’ sports techniques and sports equipment. Wind tunnels are usually not designed for sports training or sport equipment test, therefore, limited by the design of the wind tunnels, we can only use static models or ask the athletes to do specified postures, which is quite different from the actual competitions or training process. Most wind tunnel experiments take real athletes as subjects, the test results often have large deviations or are not credible at all, and the strong wind in the wind tunnel may hurt the athletes once it is out of control. Moreover, the existing wind tunnel equipment also has the shortcomings such as the inability to reconstruct incoming wind field, poor economy, and not suitable for sports programs, etc. Introducing boundary-variant equipment in wind tunnels can synchronize the movements of the tunnel floor and the incoming air flow so as to simulate the competitions and training state of athletes more realistically.
Based on the typical postures of cross-country skiers during competition process, this study introduced boundary-variant equipment into wind tunnel experiment to study the state of athletes under the action of incoming wind, with wind direction angle and other factors that can affect wind-induced resistance taken into consideration, this paper explored the laws of drag coefficient and wind speed, as well as the impact of the Reynolds number on the wind resistance of the athlete model, thereby developing a research method for studying the relationship between wind speed and drag coefficient during the skiing process of skiers.
During the process of ice and snow sports, athletes need to overcome various resistance forces, such as air resistance (wind resistance) constantly, so as to finish the game with faster speed and achieve better results. How to effectively reduce the air resistance is crucial for athletes to improve their performance in speed-type sports programs. This study performed wind tunnel experiment on skiers to study the aerodynamic drag and drag coefficient, calculated and analyzed the characteristics when skiers overcome the wind resistance using different postures during the skiing process, and studied the formation mechanism of the wind resistance. The results attained in this study include: developing a wind tunnel experiment method for researching the wind-induced resistance of athletes, measuring the aerodynamic forces in all directions, attaining the aerodynamic parameters of typical postures, studying the impact of Reynolds number on the wind resistance of athlete model, and ensuring a same Reynolds number in model and in real object. Based on the quantitative relationship between movement postures and the wind resistance of athletes, this paper aims to propose improvement suggestions for drag reduction strategies and techniques, provide scientific evidences for coaches to make routine training plans, promote athletes to implement effective ski training methods, enhance the abilities of coaches and athletes to evaluate sports status, and to optimize the decisions of sports tactics. The ultimate purpose of this study is to research and apply scientific methods and techniques to improve Chinese athletes’ sports performance and competition results, and it has special meaning for responding to the call of the 2022 Beijing Winter Olympics and successfully holding the Winter Olympics with the aid of technologies.
2.1 Impact of hydromechanics on sports performance
Sports science is a very comprehensive science involving many disciplines. Sport programs are of diverse types, usually, the situations during competitions are very complex, and many factors can affect the outcome of the competition. However, there’re a few common points and basic questions, such as the biomechanics [13] and sports psychology, and hydromechanics is one of them. There are hydromechanics problems in sports programs in which athletes have faster movement speed relative to fluid medium (such as water and air) or those last for a relatively long time. In competitive sports programs, surpassing physical limits and breaking records are the eternal goals of every professional athlete. Wind-induced resistance is the main component of the resistance force acted on the ice and snow athletes during the skating and skiing process. Scholars proved through aerodynamic theories and experiments that wind-induced resistance during skating and skiing has a great impact on the performance of speed competitions, when athletes move at a fast speed on ice or snow, most of the energy is used to overcome the resistance force of the air. Speed-type winter sports include speed skating, alpine skiing, etc., besides the athletes’ physical qualities, wind resistance is a key factor for athletes, especially during their high-speed movement, wind resistance would consume most of their physical energy, therefore, how to effectively reduce the wind resistance of athletes is crucial for improving the performance of speed sports.
2.2 Calculation principles of aerodynamic resistance of skier during the skiing process
Skiers are subjected to the action of air resistance during their skiing process. Air resistance is formed by the relative speed between the incoming wind and the skiing movement of skier [14, 15], it can be expressed as:
${{C}_{D}}=\frac{{{F}_{D}}}{\frac{1}{2}A\rho {{U}^{2}}}$ (1)
where, FD represents the resistance of the athlete [N]; CD represents the drag coefficient of the movement posture of the athlete, its size is determined by the movement posture of the athlete and is usually measured by wind tunnel experiment; ρ represents the air density [kg/m3], which is calculated based on the atmospheric pressure and air temperature recorded on the day of the experiment at the ski resort; U represents the relative velocity between the incoming wind at the athlete's position and the movement of the athlete [m/s]; A represents the frontal area of the athlete’s movement posture [m2], in this experiment, its value takes the product of the shoulder width and height of the model athlete.
In any wind tunnel experiment, certain similarity conditions must be met to ensure the reliability of the experimental results, and the Reynolds number is the main similarity criterion [16, 17].
${{\text{R}}_{\text{e}}}={}^{\rho vL}/{}_{\mu }$ (2)
where, v, ρ, and μ respectively represent the velocity, density and viscosity coefficient of the fluid; and L represents the characteristic length. In flows in which inertial force and viscous force play important roles, in order to make two geometrically similar flows (geometric similarity ratio n=Lp/Lm, subscript p represents the real object, subscript m represents the model) to meet the dynamic similarity conditions, the Reynolds numbers of the model and the real object must be kept the same [18]. In low-speed wind tunnels, the increase of wind speed always has a limit, so the similarity law cannot be strictly satisfied, but can only be approximated.
As shown in Figure 1, an athlete moves from point Pi to point Pi+1 within time duration $\Delta t_{i}$(from time moment ti to time moment ti+1); $\gamma_{i}$ represents the angle between the movement direction and the direction of the geographic coordinate system (x-axis); $\theta_{i+1}$ represents the environmental wind direction of the venue at point Pi+1 at time moment ti+1; then, within a certain time duration $\Delta t_{i}$, in the movement direction of the athlete, the relative velocity between the incoming wind and the movement of the athlete can be expressed as:
${{U}_{i}}=-{{V}_{i}}\text{+cos}\left( {{\theta }_{i+1}}-{{\gamma }_{i}} \right)\cdot {{u}_{i+1}}$ (3)
where, $V_{i}$ represents the average sliding velocity of the athlete within time duration $\Delta t_{i} ; u_{i+1}$ and $\theta_{i+1}$ represent the wind speed and wind direction of the venue at the athlete's position at time moment $t_{i+1}$; then, within time duration $\Delta t_{i}$, the work done by the air resistance to the athlete is:
${{W}_{aero\text{-}i}}\text{= }{{F}_{D}}_{i}\cdot \Delta {{s}_{i}}$ (4)
$\Delta s_{i}$ is the sliding distance of the athlete within time duration $\Delta t_{i}$.
The size and direction of the athlete’s sliding velocity change constantly with time, the wind velocity of the wind field where the athlete is located changes with time, and the size and direction of the relative velocity between wind field and athlete also change with time as well, therefore, the wind field may facilitate or hinder the sliding of the athlete. By rearranging Formulas 1, 3, and 4, we can get the calculation formula of $F_{D_{i}}$ [19]:
$\begin{align} & {{F}_{{{D}_{i}}}}\text{=}\frac{1}{2}{{C}_{{{D}_{j}}}}{{A}_{j}}\rho \left| \left( -{{V}_{i}}+\text{cos}\left( {{\theta }_{i+1}}-{{\gamma }_{i}} \right)\cdot {{u}_{i+1}} \right) \right| \\ & \left( -{{V}_{i}}+\text{cos}\left( {{\theta }_{i+1}}-{{\gamma }_{i}} \right)\cdot {{u}_{i+1}} \right) \\\end{align}$ (5)
3.1 Purpose of wind tunnel experiment
Conventional aerodynamics usually refers to the aerodynamics of the aircraft, and the main equipment for such experimental research is the wind tunnel. Experts and scholars have done a lot of theoretical research on air resistance, and it is generally believed that drag coefficient is related to air velocity. However, few people have done experiment to prove the impact of body shape, frontal area, sliding posture, and sportswear on the drag coefficient. The experiment conducted in this study aims to discuss the impact of athlete’s body shape and sliding posture on the resistance. Only after the factors related to resistance have been determined can their values be calculated accurately. In fact, wind tunnel experiment also has been widely applied in non-aeronautical fields. In the field of sports science research, wind tunnel experiment has been applied to the research of many programs such as track and field, cycling, and swimming, etc., and the aerodynamic phenomena have been used to explain some laws in sports. For the target sports program in this study, namely the cross-country skiing, wind tunnel experiment was performed to analyze the aerodynamic characteristics of the skier so as to attain the optimal parameters of sliding postures and the optimal energy distribution scheme for athletes, thereby providing scientific evidences for formulating tactical plans and training plans.
3.2 The reduced scale model of athlete
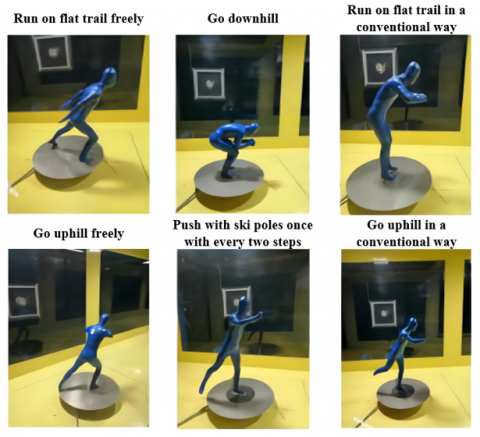
Typical postures were measured with the help of a cross-country skier to eliminate anthropometric errors. The skier was asked to do standard postures specified for professional athletes of the Heilongjiang province of China, as shown in Figure 2.
Figure 1. Relationship between the environmental wind direction and the athlete's movement direction
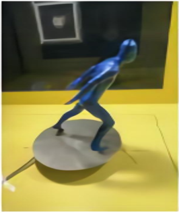
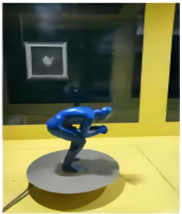
Figure 2. Postures of skier (a) Go uphill freely; (b) Go downhill freely; (c) Push with ski poles once with every two steps; (d) Run on flat trail freely
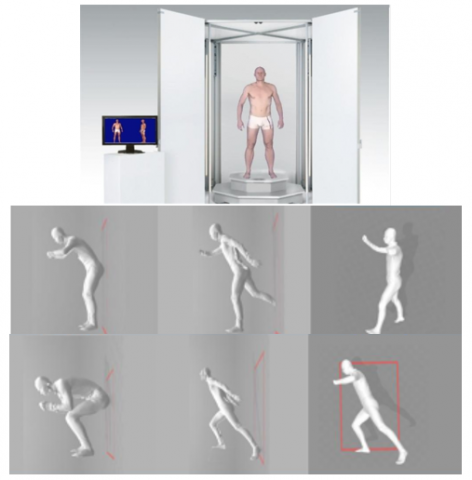
Figure 2 shows a few typical movement postures of cross-country skiing. This study adopted a German brand scanner Anthroscan Bodyscan which was designed and produced according to the international standard DIN EN ISO 20685, this scanner is specially made to accurately attain the 3D shape, size, and color of human body, and it has been widely used in many fields such as body shape measurement, virtual cloth fitting, sports science, ergonomics, life science, and 3D printing, etc. [20]. The scanner was developed based on the principle of optical triangulation; it can perform non-contact 3D human body measurement with high accuracy and build models using the 3D printing technology; its measurement range is 2100mm (height) × 1000mm (depth) × 1200mm (width), and the average maximum circumference error is 1mm. As shown in Figure 3, according to the physical feature information of athlete A such as his weight, height, and body shape, 3D scanning and printing technologies were employed to attain a 1:5 reduced-scale model of the typical postures of the athlete. After the wind tunnel experiment model which is used for drag coefficient test was scanned, a file in “stl” format was output and could be used for 3D printing or taken as the input of the numerical flow field simulation of CFD [21]. Figure 4 shows the athlete model fabricated by scanning and printing.
Figure 3. The scanned and output stl file models
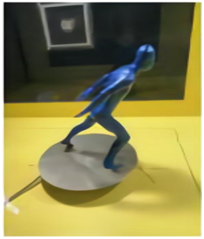
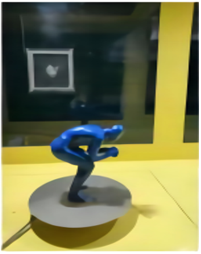
Figure 4. The athlete model fabricated by 3D scanning and printing
3.3 Introduction of equipment used in the wind tunnel experiment
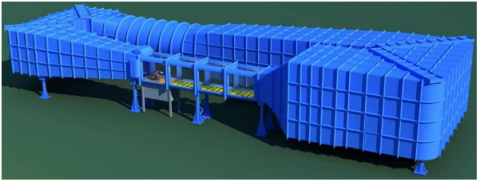
The wind tunnel experiment was done in the boundary-variant wind tunnel laboratory of the Northeast Forestry University of China. This boundary-variant wind tunnel is a closed single-reflow wind tunnel with rectangular cross-section, equipped with professional sports science research devices such as ground relative motion simulator, complex flow field reconstruction unit, and movement model test system, etc.; specifically, it has a high-precision PIV equipment which can be used to study the air drag reduction mechanisms of sports techniques and gears, and it can be used for the design of the economy of the sports field based on the range of the Reynolds number. Moreover, the wind tunnel can be used to study the drag reduction technology of sportswear and movement techniques of athletes under the conditions of different sports programs, velocities, and venues; and it can simulate the resistance characteristics of athletes with different sportswear and postures in different movement directions. The wind tunnel covers an area of 17m×5.5m, the test section is 5m long and 1.0m high, and the width of the inner section is 0.8m. The wind speed in the test section is 5m/s~70.5m/s and the wind is stable and continuously adjustable. Turbulence intensity and inhomogeneity of the flow field are both less than 0.5%. Figure 5 gives a diagram of the boundary-variant wind tunnel equipment of Northeast Forestry University.
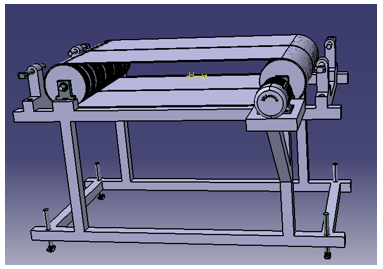
The boundary-variant system was designed as a movable floor, which can adjust the ground movement speed of the test section continuously from 0m/s to 60m/s, when it works with the wind tunnel, the equipment can simulate the actual flow field scenarios of athletes, sleds, vehicles, and other moving objects during ground movement, its mechanical principle is shown in Figure 6.
Figure 5. A schematic diagram of the boundary-variant wind tunnel equipment of Northeast Forestry University
Figure 6. Mechanical principle of the boundary-variant system
3.4 Force measuring equipment
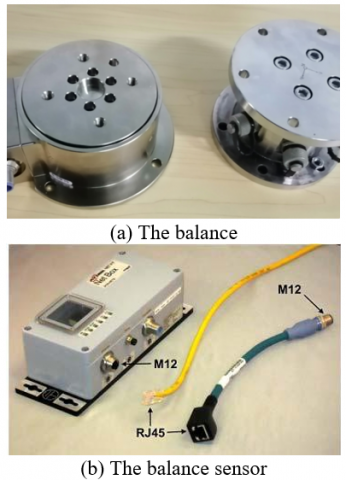
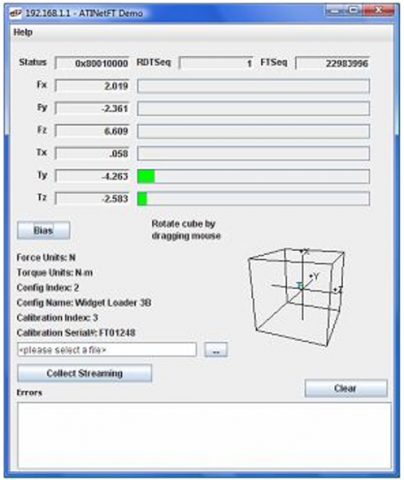
A six-component balance (brand: ATI; model GAMMA-IP65) was adopted for force measurement in the experiment. The six-axis force/torque sensor (brand: ATI) has a very high Gamma intensity, the sensor is made of high-strength aviation aluminum and subjected to precision machining, and its single-axis overload capacity is 6.9 to 31.6 times the limit range; high signal-to-noise ratio: signal strength of the silicon strain gauge is 75 times stronger than conventional strain gauges, when the signal is amplified, noise distortion is close to 0. Alternative versions include IP60, IP65, and IP68: IP60 is suitable for dusty environments; IP65 is suitable for water-spraying environments; and IP68 can be used up to 4 meters underwater. The IP65 version was adopted in our experiment. Figure 7(a) shows a photo of the six-component balance; Figure 7(b) shows the balance sensor; Figure 8 gives a screenshot of the reading interface.
Figure 7. The force measuring equipment – six-component balance
Figure 8. Reading interface of the balance sensor
3.5 Experiment process
3.5.1 Connection between skier model and force measuring platform
A self-made aluminum alloy plate was used to fix the skier models (single foot support models and both feet support models) during the experiment. Six screws were used to fix the circular platform and the force measuring balance and to transfer the load. The skier model was placed facing the air outlet of the wind tunnel, and the wind coming from the tunnel was used to simulate the wind drag acted on the skier during the skiing process. In the experiment, we also made a steel plate and an aluminum alloy plate. The steel plate on the left was used to fix the single foot support skier model; the alloy aluminum plate on the right has a metal rod that stands up to fix the both feet support skier model, as shown in Figure 9.
Figure 9. The aluminum alloy plate used for connecting model and balance
Figure 10. Skier models with typical skiing postures
In order to reduce the impact of flow separation and detour when the wind passing through the platform and attain more accurate measurement results, after multiple improvements, we found that making the platform edge as smooth and sharp as possible could reduce errors to a certain extent. After that, the skier model was fixed on the circular platform.
Figure 10 shows the wind tunnel experiment on 3D printing skier models with six typical skiing postures. In view of the force factors such as the stability of the single-foot support, when setting the wind speed conditions for the experiment, for the first four postures in Figure 10, the highest incoming wind speed was set higher, and the wind speed was adjusted at 5, 8, 10, 12, 15, 18, 20, 22, 24, 26, and 30 (m/s) respectively; while for the last two postures, the highest incoming wind speed was set lower, and the wind speed was adjusted at 5, 8, 10, 12, 15, 16, 17, 18, 19, 20, 21, 22, and 24 (m/s) respectively. The main reason is that, both feet of the first four skier models were connected with the circular platform, while only one feet of the last two skier models (the “Push with ski poles once with every two steps” posture and the “Go uphill in a conventional way” posture) was connected to the circular platform, so the wind speed of the first group (the first four models) was set higher than that of the second group (the last two models), so as to prevent the second group models being blown off the platform due to unstable connection and causing damages to the experiment equipment.
3.5.2 Data collection
Data of wind resistance were measured by the six-component balance, then Formula 5 was used to calculate the drag coefficients of the skier models with different postures under different wind speeds, then the attained data were summarized in the Table 1.
Table 1. Wind resistance and drag coefficient of skier models with different postures under different wind speeds
|
Model information |
Wind speed (m/s) |
Average wind resistance (N) |
Drag coefficient Cd |
|
|
Model #1 Posture: Run on flat trail freely Effective area: 38×11.48 (cm) |
5 |
0.374 |
1.837 |
|
|
8 |
0.966 |
1.853 |
||
|
10 |
1.49 |
1.829 |
||
|
12 |
2.126 |
1.813 |
||
|
15 |
3.259 |
1.778 |
||
|
18 |
4.583 |
1.737 |
||
|
20 |
5.552 |
1.704 |
||
|
22 |
6.745 |
1.711 |
||
|
Model #2 Posture: Go downhill Effective area: 23.55×10.2 (cm) |
5 |
0.08 |
0.446 |
|
|
8 |
0.5 |
1.09 |
||
|
10 |
0.697 |
0.971 |
||
|
12 |
1.028 |
0.995 |
||
|
15 |
1.573 |
0.975 |
||
|
18 |
2.228 |
0.96 |
||
|
20 |
2.733 |
0.953 |
||
|
22 |
3.3 |
0.95 |
||
|
24 |
3.87 |
0.937 |
||
|
26 |
4.504 |
0.929 |
||
|
Model #3 Posture: Run on flat trail in a conventional way Effective area: 38.75×10.7 (cm) |
5 |
0.185 |
1.15 |
|
|
8 |
0.529 |
1.28 |
||
|
10 |
0.821 |
1.27 |
||
|
12 |
1.246 |
1.346 |
||
|
15 |
1.874 |
1.295 |
||
|
18 |
2.718 |
1.305 |
||
|
20 |
3.313 |
1.288 |
||
|
22 |
4.032 |
1.296 |
||
|
24 |
4.741 |
1.28 |
||
|
26 |
5.534 |
1.273 |
||
|
30 |
7.253 |
1.253 |
||
|
Model #4 Posture: Go uphill freely Effective area: 39.23×10.86 (cm) |
5 |
0.265 |
1.454 |
|
|
8 |
0.889 |
1.9 |
||
|
10 |
1.43 |
1.962 |
||
|
12 |
2.11 |
2.01 |
||
|
15 |
3.419 |
2.085 |
||
|
16 |
3.915 |
1.832 |
||
|
17 |
4.4 |
2.088 |
||
|
18 |
4.841 |
2.05 |
||
|
19 |
5.338 |
2.029 |
||
|
20 |
5.975 |
2.049 |
||
|
21 |
6.523 |
2.029 |
||
|
22 |
7.209 |
2.043 |
||
|
24 |
8.587 |
2.045 |
||
|
26 |
10.076 |
2.045 |
||
|
Model #5 Posture: Push with ski poles once with every two steps Effective area: 42.26×10.1 (cm) |
5 |
0.232 |
1.472 |
|
|
8 |
0.76 |
1.884 |
||
|
10 |
1.262 |
2.002 |
||
|
12 |
1.844 |
2.031 |
||
|
15 |
2.998 |
2.114 |
||
|
16 |
3.413 |
2.115 |
||
|
17 |
3.878 |
2.129 |
||
|
18 |
4.301 |
2.106 |
||
|
19 |
4.777 |
2.099 |
||
|
20 |
5.304 |
2.103 |
||
|
21 |
5.833 |
2.098 |
||
|
22 |
6.425 |
2.106 |
||
|
24 |
7.602 |
2.094 |
||
|
Model #6 Posture: Go uphill in a conventional way Effective area: 43.25×10.4 (cm) |
5 |
0.444 |
2.657 |
|
|
8 |
1.018 |
2.38 |
||
|
10 |
1.534 |
2.295 |
||
|
12 |
2.19 |
2.275 |
||
|
15 |
3.425 |
2.277 |
||
|
16 |
3.878 |
2.266 |
||
|
17 |
4.395 |
2.275 |
||
|
18 |
4.773 |
2.204 |
||
|
19 |
5.298 |
2.196 |
||
|
20 |
5.855 |
2.19 |
||
|
21 |
6.389 |
2.167 |
||
|
22 |
7.007 |
2.166 |
||
|
24 |
8.29 |
2.153 |
||
Table 1. Continued
|
Posture |
Run on flat trail freely |
Go downhill |
Run on flat trail in a conventional way |
Go uphill freely |
Push with ski poles once with every two steps |
Go uphill in a conventional way |
|
Photo |
||||||
|
Height-to-width ratio of the model |
3.3 |
2.2 |
4.2 |
4.5 |
5.6 |
5.2 |
|
Average drag coefficient |
1.783 |
0.921 |
1.276 |
1.973 |
2.027 |
2.269 |
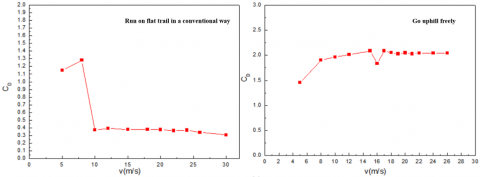
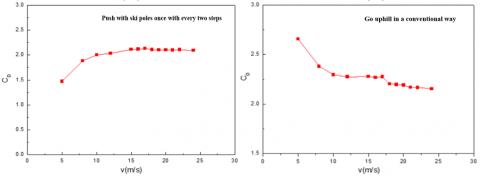
Figure 11 shows the relationship between wind speed and drag coefficient concluded based on the model data attained from the experiment.
As can be seen from the figure, in case of the posture “Run on flat trail freely”, the drag coefficient of the skier changes gently with wind speed; in case of “Go downhill”, the drag coefficient increases suddenly when the wind speed rises from 5m/s to 8m/s, and then changes slowly; in case of “run on flat trail in a conventional way”, the drag coefficient shows a sudden decrease when the wind speed rises from 8m/s to 10m/s, and then it changes gentler; in case of “Go uphill freely”, overall, the drag coefficient changes slowly with the wind speed; in case of the posture “Push with ski poles once with every two steps”, the drag coefficient increases steadily with the increase of wind speed; in case of “Go uphill in a conventional way”, the drag coefficient decreases steadily with the increase of wind speed. On the whole, under the six different postures, there’s no significant correlation between wind speed and drag coefficient, and the drag coefficient does not change with the wind speed (Reynolds number). Based on the above results, it can be considered that the skier models can replace the real person in the wind tunnel experiment. In addition, a law could be summarized based on the experimental data: parameters such as the skier’s height, posture, and frontal area have a certain impact on the drag coefficient, generally, the larger the height, the greater the drag coefficient. This law could be used by athletes to adopt rational tactics and optimize their postures during training, thereby improving their competition performance.
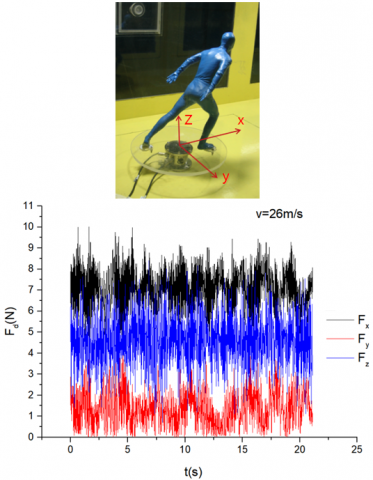
The wind resistance (Fx) time-history curves were drawn based on the force data in three directions collected by the sensor of the six-component balance, as shown in Figure 12.
According to the figure, the drag force Fx in the x direction, the side force Fy in the y direction, and the lift force Fz in the z direction show a general trend that the drag force is greater than the lift force, and the two are greater than the side force. During the whole experiment process, the skier models vibrated greatly, especially at high wind speed, the vibration was more obvious. These can cause unfavorable factors for the PIV experiment to be carried out in the next step, so in the future, experimental conditions will be improved and the design of the accessory experiment equipment will be optimized further.
Figure 11. Wind speed – drag coefficient curves of different postures
Figure 12. Comparison of wind drag force and lift force
This study proposed a wind tunnel experiment method and modeled skiers in the wind field environment, then, typical skiing postures of cross-country skiers during daily training were summarized, and the relationship between drag coefficient of skier during the skiing process in different trail sections and the wind speed was discussed, the specific conclusions are as follows:
(1) The drag coefficient does not change with the wind speed (Reynolds number), and the skier models can replace the real person in the wind tunnel experiment.
(2) Parameters such as the skier’s height, posture, and frontal area have a certain impact on the drag coefficient, generally, the larger the height, the greater the drag coefficient. This law could be used by athletes to adopt rational tactics and optimize their postures during training, thereby improving their competition performance.
(3) Forces in the three directions exhibit a law that the drag force is greater than the lift force, and the two are greater than the side force. During the whole experiment, the skier models vibrated greatly, especially at high wind speed, the vibration was more obvious.
This work is supported by Northeast Forestry University innovation training project (Grant No: 202110225526) and Fundamental Research Funds for the Central Universities (Grant No: 2572019BJ06).
[1] Chen, Z., Fang, H. (2011). The effects of wind and posture on the aerodynamic performance during the flight stage of skiing. Journal of Biomechanical Engineering, 133(9): 091001. https://doi.org/10.1115/1.4004947
[2] Mannion, P., Toparlar, Y., Blocken, B., Clifford, E., Andrianne, T., Hajdukiewicz, M. (2018). Aerodynamic drag in competitive tandem para-cycling: Road race versus time-trial positions. Journal of Wind Engineering and Industrial Aerodynamics, 179: 92-101. https://doi.org/10.1016/j.jweia.2018.05.011
[3] Kamarudin, K.M., Basri, M.S.M., Maidin, N.A., Ab Rahman, M.H. (2020). Aerodynamic drag study of time-trial cycling helmets using CFD analysis. Journal of Advanced Research in Fluid Mechanics and Thermal Sciences, 72(1): 21-31. https://doi.org/10.37934/arfmts.72.1.2131
[4] Barry, N., Burton, D., Sheridan, J., Thompson, M., Brown, N.A. (2015). Aerodynamic drag interactions between cyclists in a team pursuit. Sports Engineering, 18(2): 93-103. https://doi.org/10.1007/s12283-015-0172-8
[5] Meyer, F., Le Pelley, D., Borrani, F. (2012). Aerodynamic drag modeling of alpine skiers performing giant slalom turns. Medicine & Science in Sports & Exercise, 44: 1109-1115. https://doi.org/10.1249/MSS.0b013e3182443315
[6] Yamanobe, K., Shirasaki, K., Akashi, K., Ishige, Y. (2016). The effects of upper limbs position on the aerodynamics in ski jumping flight. 34 International Conference of Biomechanics in Sport (2016), Tsukuba, Japan, pp. 1177-1180.
[7] Chowdhury, H., Naito, K., Alam, F. (2015). An experimental study on speed skating skinsuits. Mechanical Engineering Research Journal, 9: 110-114.
[8] Meile, W., Reisenberger, E., Mayer, M., Schmölzer, B., Müller, W., Brenn, G. (2006). Aerodynamics of ski jumping: experiments and CFD simulations. Experiments in Fluids, 41(6): 949-964. https://doi.org/10.1007/s00348-006-0213-y
[9] Chowdhury, H., Alam, F., Mainwaring, D. (2011). A full scale bicycle aerodynamics testing methodology. Procedia Engineering, 13(1): 94-99. https://doi.org/10.1016/j.proeng.2011.05.057
[10] Schenau, G. (1982). The influence of air friction in speed skating. Journal of Biomechanics, 15(6): 449-458. https://doi.org/10.1016/0021-9290(82)90081-1
[11] Asai, T., Hong, S., Ijuin, K. (2017). Flow visualisation of downhill skiers using the lattice Boltzmann method. European Journal of Physics, 38(2): 024002. https://doi.org/10.1088/1361-6404/38/2/024002
[12] D'Auteuil, A., Larose, G.L., Zan, S.J. (2012). Wind turbulence in speed skating: measurement, simulation and its effect on aerodynamic drag. Journal of Wind Engineering & Industrial Aerodynamics, 104-106: 585-593. https://doi.org/10.1016/j.jweia.2012.02.002
[13] Kim, H., Kim, H., Lee, J., Kim, C., Moon, J. (2017). Biomechanical research trends for ski jump analysis. The Korean Journal of Physical Education, 56(3): 613-626. https://doi.org/10.23949/KJPE.2017.05.56.3.46
[14] Brownlie, L. (2021). Aerodynamic drag reduction in winter sports: the quest for “free speed”. Proceedings of the Institution of Mechanical Engineers, Part P: Journal of Sports Engineering and Technology, 235(4): 365-404. https://doi.org/10.1177/1754337120921091
[15] Kusano, I., Cheynet, E., Jakobsen, J.B., Snæbjörnsson, J. (2021, November). Aerodynamic study of a suspension bridge deck by CFD simulations, wind tunnel tests and full-scale observations. IOP Conference Series: Materials Science and Engineering, 1201(1): 012007. https://doi.org/10.1088/1757-899X/1201/1/012007
[16] Rode, K.N., Siddamallaiah, R.J. (2022). Image segmentation with priority based apposite feature extraction model for detection of multiple sclerosis in MR images using deep learning technique. Traitement du Signal, 39(2): 763-769. https://doi.org/10.18280/ts.390242
[17] Niu, J.Q., Zhou, D., Liang, X.F., Liu, S., Liu, T.H. (2018). Numerical simulation of the Reynolds number effect on the aerodynamic pressure in tunnels. Journal of Wind Engineering and Industrial Aerodynamics, 173: 187-198. https://doi.org/10.1016/j.jweia.2017.12.013
[18] Yang, X.W., Song, B.F., Yang, W.Q., Xue, D., Pei, Y., Lang, X.Y. (2022). Study of aerodynamic and inertial forces of a dovelike flapping-wing MAV by combining experimental and numerical methods. Chinese Journal of Aeronautics, 35(6): 63-76. https://doi.org/10.1016/j.cja.2021.09.020
[19] Elfmark, O., Giljarhus, K.E.T., Liland, F.F., Oggiano, L., Reid, R. (2021). Aerodynamic investigation of tucked positions in alpine skiing. Journal of Biomechanics, 119: 110327. https://doi.org/10.1016/j.jbiomech.2021.110327
[20] Jung, A., Müller, W., Staat, M. (2019). Optimization of the flight technique in ski jumping: The influence of wind. Journal of Biomechanics, 88: 190-193. https://doi.org/10.1016/j.jbiomech.2019.03.023
[21] Chi, S., Pitman, J., Crouch, T., Burton, D., Thompson, M. (2021). The application of body scanning, numerical simulations and wind tunnel testing for the aerodynamic development of cyclists. Proceedings of the Institution of Mechanical Engineers, Part P: Journal of Sports Engineering and Technology, 235(4): 339-353. https://doi.org/10.1177%2F1754337120904258