Mujahid K. Badr | Farooq H. Ali* | M. Sheikholeslami
© 2022 IIETA. This article is published by IIETA and is licensed under the CC BY 4.0 license (http://creativecommons.org/licenses/by/4.0/).
OPEN ACCESS
Current article presents a numerical investigation for three dimensional turbulent flow using the MCRT method to simulate solar radiations as a heat flux and the finite volume method in Ansys Fluent to simulate the equations. The fluid in absorber is a synthetic oil having eight hundred index mixed with Aluminium Oxide nanoparticles to enhance the heat transfer process. The study comparing different cases, including different numbers of longitudinal fins assembled inside the absorber with two arrangements and three particular Reynolds number in addition to the testing concentration ratio of the heat flux using the MCRT method. The impact of using three different numbers of fins (2, 4 and 6) at two different arrangements ("a" and "b") were presented. The three Reynolds number used was (18600, 23000 and 28000). Two Rim angles of the collector are tested (80o) and (120o), results showed that (120º) was achieved high outlet temperature with a concentration ratio (CR=82.47). The effects on outlet temperature, friction factor, Nusselt number, and then on the performance evaluation criterion (PEC) of the absorber tube were displayed. The results of the study proved that using nanofluid and finned absorber can increase the absorber hydrothermal performance and using (6) fins of arrangement "b" shows better performance in terms of heat transfer than arrangement "a".
Parabolic Trough Solar Collector (PTSC), MCRT model, Al2O3 nanomaterial, Syltherm 800 base fluid, turbulent flow, finned tube
As the fact of fuel costs increasing with time and as a consequence of that the electricity production costs also clearly increased, an alternative sources of energy with an insisting need came to the practice field. In the heat transfer industry, there are many types of energy sources like the wind energy, Geo-thermal energy, water falls energy and solar energy, etc. The solar energy also classified into several types such as the photovoltaic systems and solar concentrating power systems (CSP) which contains three main systems (parabolic trough collectors, dish and central receivers), parabolic trough collectors are an effective tool for the conservation and transfer of thermal energy. The solar energy systems characterized that they are using the solar energy which is free cost and also they are free of pollutions products such as CO₂. The recent years witnessed a growing importance in energy conversion systems and their applications in the practice fields. Padilla et al. [1] in this research, the 1-D analysis of heat transfer in (PTC) were conducted using a closed envelope around the absorber with vacuum to reduce dissipation in heat and found that when reducing it will give more enhancement in achievement. Cabrera et al. [2] scrutinized the efficiency of solar cooling systems by using PTC. The investigation showed that PTC more efficient to increase efficiency and reduce costs than the evacuated tube collectors (ETC) and the similar levelized price for cooling that a flat plate collector (FPC). Patil et al. [3] The researchers scrutinized the influence of various factors on heat losses. They found out that heat loss increased as the wind speed increases and pipe diameter increases, overturned the efficacy of various parameters on improving the efficiency of a PTSC and reducing thermal dissipations. Wang et al. [4] they studied different parameters of the PTC system such as thermal stresses and thermal deformation that accompanied by the flow. Using the finite element method (FEM), and they also investigated numerically the efficacy of the variables on the productivity of the unit. The deformations of the absorber and the thermal stress are much more than the glass cover. Wang et al. [5] scrutinized the use of glass cover and its effect on productivity of PTC employing MCM to reduce the risks of receiver failure and the induced thermal stresses that resulting from the variable heat flux profile. The outputs indicated that the heat flux distribution via the path of the elliptical shell was declined and the productivity of the system lowered. Amina et al. [6] they offered 3-D numerical study and employed the gathering of two techniques that improved the heat transfer significantly these techniques are the using of extended surfaces and various types of nanoparticles with a certain concentration, in addition to the enhancement of Nusselt number in the absorber. Bellos et al. [7] different kinds of nanofluids in the PTC were investigated in this study at the suitable temperature for each. The results showed that there are variations of the energetic and exergetic from nanofluid to another and for a certain temperature for each case, as well as the pressurized water was the most proper working fluid for temperature range of 277℃, whereas for the temperature above 827℃, the only nanofluids for that was the Helium and carbon dioxide. Wang et al. [8] illustrated the using of (Al2O3)-oil and compared that with the conventional oil, demonstrated the effects of using nanoparticles, they found that the increasing of Al2O3 concentration from 0% to 5.0% will enhance the performance of the PTC, the temperature gradients of the absorber decreased with the increase of the nanoparticle. Moreover, diminish the thermal stress and the absorber deformation. Gong et al. [9] applied pin fin arrangement and adopted the FVM coupled with the Monte Carlo approach to investigate the flow characteristics of the absorber and the performance for the PTC system which was achieved as the numerical results. The overall heat transfer efficiency was significantly enhanced with the use of pin fin arrays inserting. Bellos and Tzivanidis [10] scrutinized the parabolic trough collector in their study using various nano particles (CuO and Alomina) and the third case examined with Syltherm 800 alone which gives less efficient than the nano fluids cases. The outputs depicted that productivity touches 50% at high levels of temperature. The thermal efficiency increased in case of low flow rate and when maximize the concentration ratio of nano fluid. Jin et al. [11] using the new method of the symmetry principle and dimensional analysis and thermal performance analysis of (PTC) for applications of solar thermal, they investigated different lengths with various particle solar collectors to evaluate the thermal efficiency. They reported that, the performance of the collector has been raised with augmenting the DNI of the sun and decreasing when the air humidity enhanced. Subramani et al. [12] used the TiO2/DI–H2O (De-Ionized water) nanofluid to augment the productivity of the PTC by using different concentrations at a different flow rates and studied the characteristics of the nanofluids, the coefficient of the convective heat transfer was improved. They found that by using TiO2 as a nanofluid with 0.2% as concentration ratio leads the efficiency to be a maximum enhancement (8.66% greater than H2O-based). Mwesigye and Meyer [13] investigated the optimum thermodynamic and thermal operating conditions of the PTSC using various nanofluids, the influence of the use of nanofluids on system efficiency shows that the applying such material will make heat transfer greater and improves the thermodynamic performance which depend on the inlet temperature. The thermal efficiency was increased by (5%) when the concentration ratio of the nanofluids raised from (88 to 113) at the same flow rate. In addition to that the highest thermal performance with silver/therminol VP-1, and the lower thermal performance was shown with Al2O3-Therminol VP-1. Bellos et al. [14] they investigated different arrangements of the internal extended surfaces and the best number of them in the absorber of the PTC which gives most heat transfer and thermal efficiency improvement. They concluded from the results that the internal extended surfaces must be situated in the lower part of the absorber where the heat flux being biggest amount at that part. For good performance, three fins should be utilized rather than the upper part of the absorber which gives lower improvement of the performance. Wang et al. [15] usually to get heat energy, the range of temperatures are (673K to 823K), and to reduce the heat losses, a radiation shield (RS) used for higher temperatures to augment the productivity of receiver. When absorber temperature exceeding (823K), a superior performance was shown in the solar receiver without coating. When the temperature of the absorber reached (823K), the heat loss reduction in presence of coating was less than of without selective absorbing coating. Wang et al. [16] in order to decline heat dissipation from the absorber when the PTC operating at high temperature ranges, and since there is an irregularity of solar irradiation arrived the tube so inner transparent radiation shield (TRS) used for that purpose. Numerically studied, the model satisfied consistency with experimental results. A good performance was observed for the absorber rather than classical receiver. Fan et al. [17] discussed the usages of Monte Carlo for solar systems. The model used has the advantages such as augment the accuracy, decline the fluctuation and relieve the runtime of MCRT method. Korres et al. [18] studied the enhancements of thermal productivity and the enhancement in convection using a nanofluid in compound parabolic collector with a range of temperature (298K up to 573K). There was a significant enhancement in the performance up to 2.76% in the existence of nanomaterial. The flow was laminar and the nanofluid of Syltherm 800/CuO was incorporated. Hachicha et al. [19] the main point here is to develop a model using (DSG) process with different real working conditions, so can replace the synthetic oil in the future studies and experiments. By investigating the comparative of the impact of various factors on treatment of working fluid. It was shown from the analysis that the highest thermal gradient exists in the superheated region and the risk of thermal bending also exist with the damage risk and thermal bending. Cheng et al. [20] displayed the applications of the optical performance fitting formulas for the PTC and the computing methods of these formulas, in addition to the combining of the Monte Carlo technique. They discovered that the calculation time will be reduced as a consequence of the optimization process and the system being efficient. Tagle-Salazar et al. [21] scrutinized the efficiency of the coating on the productivity of the unit and proved that his loss drops with employing such approach. That investigation focused on the efficacy of using alumina nanoparticle on the performance of the unit. Chang et al. [22] simulated the convective migration of molten salt in the parabolic trough collector using a concentric and eccentric rod inserted in the receiver to introduce turbulence and obtain the augmentation of the performance. Bozorg et al. [23] they used the circular porous medium as well as the additional particles of high thermal conductivity (Alumina) for various parameter values like degree of concentration and Reynolds number and studied the enhance in heat transfer inside the receiver. Bellos and Tzivanidis [24] they studied the most common way of improving the performance of (PTC) by using different nanoparticles with synthetic oil at different flow rates. The temperature at the inlet is 27℃ to 377℃ and the volume fraction of 6% noticing the best improvements when reducing the flow rates, raising the inlet temperature and enlarging the volume fraction of the nanofluids. Bellos and Trivanidis [25] used a special technique to augment the effectiveness of unit by decreasing optical losses at the trough end. The final results show that the use of an extra booster gives a thermal and optical improvements at greater angles of incidence. Donga and Kumar [26] the thermal and optical analysis for PTSC systems with surface slope error of mirror and absorber tube misalignment were presented They discovered that variable such as mirror positioning can affect the productivity of the system. Ekiciler et al. [27] they investigated different parameters which are hybrid nanofluid at turbulent flow in a (PTC) absorber, various volume fractions also used. Bellos et al. [28] ananlyzed PTC with considering cover for the tube. They studied three different types of collectors and showed that with the cases of higher heat losses will get the maximum enhancements and most of the performance enhanced with the use of nanofluids in the bare tube rather than the non-evacuated tube receiver and the evacuated tube receiver. Olia et al. [29] reported the usages of nanomaterils for parabolic trough solar collectors. Two factors were conducted, types of working fluid and nanoparticles characteristics. Three classifications were performed experimental, numerical (CFD) and analytical. The study concluded that the use of nanomaterial has many advantages such as augment the exergy, performance, and thermal efficiency, but it has only one disadvantage that is increased pressure drop. Abed and Afgan [30] in this paper borrows in details the progress on the system of PTC and the challenges in different industrial and engineering applications.
Rehman et al. [31, 32] studied free convection in two cavities, the first one is complex star shape cavity having Y-sort fin installed at the center of the cavity corrugated bottom wall. The second was a square cavity diamond hot shape at the center of it. The two cavities filled with non-Newtonian Casson fluid enriched a porous medium.
Jaramillo et al. [33] analyzed the efficiency enhancement in Parabolic trough solar collector (PTC) by using twisted tape inserts. Naveenkumar et al. [34] developed new design for PTC and considered the converting process of water to stream. They utilized such unit for distillation. Afsharpanah et al. [35] performed modeling procedure to simulate the fluid flow over twisted tap in PTC for Reynolds number between 10000 and 20000. The results show that the twisted tap of larger than one can augment the heat transfer process up to 16% than the plane tube.
The PTSC is a type of the moderate and effective source to use solar energy to generate heat for steam power stations and it is part of renewable energy technology. The great effect of nanofluids combined with longitudinal fins offered good augmentation of thermal features of the nanofluids. After reviewing the above studies, it was found that most of them used one or two techniques to augment the convective rate, while in the present work the novelty goes to consider four techniques to intensify the performance of the PTC. These approaches are rim angle (80º, 120º), number of fins (2,4 and 6), fins arrangement (type "a" and type "b") as well as using Al2O3 as a nanomaterial. In addition to the mentioned techniques, our study is the unique which consider the surface plots of the MCRT simulation of the collector for two different angles (80º and 120º), where, the volume under the surface could be calculated which represents the amount of heat flux absorbed by the collector. In addition, the current work is unique in the use of longitudinal fins, whose number range from 2 to 6, and their optimal arrangement around the circumference of the tube to obtain maximum heat transfer enhancement.
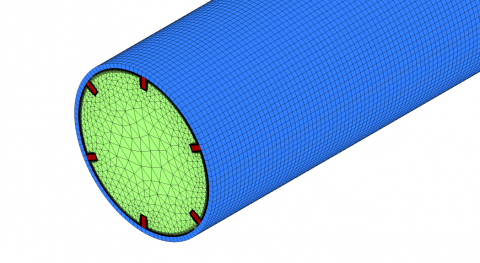
In our study, the simple design of the receiver tube used in the PTSC numerical analysis as shown in Figure 1 that is neglecting the effect of the supports were considered as well as the central rod effect. The length of the tube as a model simulated is (1500mm). As shown in Figure 2 the number of fins studied were (2, 4 and 6) respectively, with a certain arrangement ("a" arrangement) and the same number repeated with another arrangement ("b" arrangement). The variables of the study were Reynolds number, number of fins, arrangement of fins and reflector Rim angle. The results of parameters for each case such as Nu, h, friction factor (f) and performance evaluation criterion (PEC) were numerically investigated and compared to each other so as to recognize which values will be useful and resulting in best heat transfer enhancement to be considered, all the parameter values that discussed in the last paragraph will calculated for each fin number category taken with different Reynolds numbers (18600, 23000 and 28000).
Figure 1. The model of parabolic collector and boundary conditions
Figure 2. The studied absorber tube with arrangement of fines
Figure 3. MCRT model of the present parabolic trough collector
The height of the internal fins utilized to enhance the convection between the solid tube inner surface and the flowing fluid was (5mm) and fin's width (2mm). The considered heat flux direct normal irradiation DNI was (1000W/m2). Using the Alumina (Al2O3) as a nanomaterial (nanoparticles) (φ=4%) and the Syltherm 800 as a base fluid. The model drawn using the Solid work program.
The characterize work in this study is the Rim angle of the reflector, where the angles chosen were either 80º or 120º as tested, since the Rim angle of 120º achieved high outlet temperature as it’s obvious in Figure 3 from the Monte Carlo ray tracing model that the heat flux density higher than in case of 80º and where achieved the concentration ratio of (82.47), so the model of the solar reflector used was about 120º.
In order to simplify the mathematical calculations of the present study, there are several assumptions made about the flow operating conditions, the fluid flow is turbulent, steady state, incompressible and single phase flow across the absorber (where the fluid is only in its liquid state). The supporters heat transfers and gravitational are negligible.
To model the behavior of the nanofluid in the parabolic through the solar collector, 3D formulations have been applied as [36]:
Continuity equation
$\frac{\partial\left(\ddot{u}_{i}\right)}{\partial x_{i}}=0$ (1)
Momentum equation
$\frac{\partial}{\partial x_{i}}\left(\rho_{n f} \ddot{u}_{i} \ddot{u}_{j}\right)=-\frac{\partial \ddot{p}}{\partial x_{i}}+\frac{\partial}{\partial x_{j}}+\frac{\partial}{\partial x_{j}}\left(\mu_{n f}\left(\frac{\partial \ddot{u}_{i}}{\partial x_{i}}+\frac{\partial \ddot{u}_{i}}{\partial x_{i}}\right)-\frac{2}{3} \mu_{n f} \frac{\partial \ddot{u}_{j}}{\partial x_{i}} \delta_{i j}-\rho_{n f} \overline{\ddot{u}_{l} \ddot{u}_{\jmath}}\right)$ (2)
Energy equation
$\begin{aligned} \frac{\partial}{\partial x_{i}}\left(\rho_{n f} T \ddot{u}_{i}\right)=\frac{\partial}{\partial x_{i}}\left(\left(\ddot{\Gamma}+\ddot{\Gamma}_{t}\right) \frac{\partial T}{\partial x_{i}}\right), \ddot{\Gamma}=\left(\mu_{n f} / P r_{n f}\right), \ddot{\Gamma}_{t}=\left(\mu_{t} / P r_{t}\right) \end{aligned}$ (3)
$-\rho_{n f} \overline{\ddot{u}}_{l} \ddot{u}_{J}$ is:
$-\rho_{n f} \overline{\ddot{u}_{i} \ddot{u}_{j}}=\left(\frac{\partial u_{i}}{\partial x_{j}}+\frac{\partial u_{j}}{\partial x_{i}}\right) \mu_{t}-\frac{2}{3} \rho_{n f} K \delta_{i j}-\frac{2}{3} \mu_{t} \frac{\partial \ddot{u}_{k}}{\partial x_{k}} \delta_{i j}$ (4)
where,
$\mu_{t}=\frac{1}{\varepsilon} K^{2} C_{\mu} \rho_{n f}$;
$\delta_{i j}:$ kronickal delta.
The k-ɛ Realizable turbulence model with enhanced wall treatment was used to model the turbulence [36]:
$\frac{\partial}{\partial x_{i}}\left(\rho_{n f} K \ddot{u}_{j}\right)=\frac{\partial}{\partial x_{j}}\left[\left(\mu_{n f}+\frac{\mu_{t}}{\sigma_{k}}\right) \frac{\partial K}{\partial x_{j}}\right]+G_{k}-\rho_{n f} \varepsilon$ (5)
$\frac{\partial}{\partial x_{j}}\left(\rho_{n f} \varepsilon \ddot{u}_{j}\right)=\frac{\partial}{\partial x_{j}}\left[\left(\mu_{n f}+\frac{\mu_{t}}{\sigma_{\varepsilon}}\right) \frac{\partial \varepsilon}{\partial x_{j}}\right]+\rho_{n f} C_{1} S \varepsilon-C_{2} \rho_{n f} \frac{\varepsilon^{2}}{K+\sqrt{v \varepsilon}}$ (6)
Gk has the very exact model for all k-ε models like in the following:
$G_{k}=-\rho_{n f} \overline{\ddot{u}_{l} \ddot{u}_{j}} \frac{\partial u_{j}}{\partial x_{j}}$ (7)
Regarding to Ref. [36], the coefficient has been selected:
${{C}_{1}}=\max \left[ \frac{\lambda }{\lambda +5},0.43 \right], $
$\lambda =S\frac{K}{\varepsilon },$
$S\equiv {{\left( 2{{S}_{ij}}{{S}_{ij}} \right)}^{0.5}},$
${{C}_{2}}=1.9, $
${{\sigma }_{k}}=1, $
${{\sigma }_{\varepsilon }}=1.2$.
The features of nanomaterial can be calculated as [37, 38]:
$\rho_{n f}=\rho_{b f}(1-\phi)+\rho_{n p} \phi$ (8)
$C_{p, n f}=\frac{\rho_{b f}(1-\phi)}{\rho_{n f}} \cdot C_{p, b f}+\frac{\rho_{n p}(\phi)}{\rho_{n f}} \cdot C_{p, n p}$ (9)
For calculation of knf, the formulation of Ref. [39] was incorporated. Refers to the Maxwell's approach, the thermal conductivity effective of a uniform matter utilized by the following formula:
$k_{n f}=\frac{k_{n p}+2 k_{b f}-2 \phi\left(k_{b f}-k_{n p}\right)}{\frac{k_{n p}}{k_{b f}}+2+\phi \cdot \frac{k_{b f}-k_{n p}}{k_{b f}}}$ (10)
The mixture viscosity is calculated according to Eq. (11) Batchelor [40]:
$\mu_{n f}=\mu_{b f}\left(1+2.5 \phi+6.5 \phi^{2}\right)$ (11)
Conditions in various sections are [23]:
$u(x, y, 0)=0$ (12)
$v(x, y, 0)=0$ (13)
$w(x, y, 0)=w_{i n}$ (14)
$T(x, y, 0)=T_{i n}=300 K$ (15)
The Nusselt number (Nu) and Reynolds number (Re), Darcy factor (f) can be found using the next equations:
$N u=\frac{h D_{i}}{k}, R e=\frac{\rho u D_{i}}{\mu}$ (16)
$h=\frac{q^{\prime \prime}}{\left(T_{w}-T_{b}\right)}$ (17)
$f=\frac{2 D_{i} \cdot \Delta P}{\rho \cdot u_{m}^{2} \cdot L}$ (18)
The performance of unit can be measured according to [41]:
$P E C=\frac{\left(\frac{N u}{N u_{0}}\right)}{\left(\frac{f}{f_{0}}\right)^{1 / 3}}$ (19)
In the current work, the ANSYS 19.1 program used in order to perform simulation for the first time and solved the three dimensions of fluid flow and heat transfer problem in the absorber of the PTC.
To ensure the accuracy of mesh grid, the examination was carried out by taking a number of different mesh types for absorber tube. The solver setting in Ansys fluent was pressure based and steady state, the viscous model deals with pressure, momentum, energy which solved by second order upwind for pressure and momentum equations while others equation solved by first order upwind.
In order to have correct numerical outputs, a mesh generation procedure was examined. To reach best grid, five grids were applied for fin number n=6 at "a" fin arrangement with several shape elements (1.802.403, 2.978.117, 3.249.036, 3.547.878, 4.496.551) respectively as illustrated in Figure 4 the Nu and f have been estimated for each mesh element number for the absorber tube. The values of both friction coefficient and Nusselt number where noticed the same for the last three numbers of elements, where they roughly equal to (Nu =490, f = 0.0335), so the considered element number of the mesh could be (4.496.551).
Sol-trace has been utilized to extract the heat flux. The basic method of this software is based on the Monte Carlo method.
Two validations conducted in this study, the first validation considered the distribution of heat flux.
(Validation of MCRT result) and the validation was compared with Wang et al. [4] as shown in Figure 5 where it signified the good agreement between the current results and those obtained from Wang et al. [4] where they used a rim angle of (80.2º). The main similarity between both studies is that the DNI equal to (1000 W/m2), the HTF inlet temperature (300 K), the inlet velocity (3 m/s), the concentration ratios of the reference study are (82) and the working fluid flow inside tube is Syltherm 800. The 2nd validation conducted for h as depicted in Figure 6. The validation was made with Malekan et al. [42] for different Reynolds numbers (30.000, 60.000, 120.000, 250.000), it is noticed the values of the heat transfer coefficients (h) at each Reynolds number are very close for both the present study and the reference study which depend the properties of (working fluid is CuO/Therminol 66, volume ratio of ϕ=4%, Dout=70mm, Din=66mm, Itop=680 W/m2, Ibottom=9739.8 W/m2). The validation shows good agreement which signifies accepted the results of the present study.
Figure 4. Mesh dependence studies for n=6 and Re=28000 at “a” fin arrangement and sample pictures of the mesh
Figure 5. Validation of MCRT results with Wang et al. [4]
Figure 6. Validation of heat transfer coefficient results with [42]
Table 1. Properties of Al2O3 [10]
|
Properties |
Value |
|
ρ (kg/m3) |
4000 |
|
Cp (J/kg.K) |
773 |
|
k (W/m.K) |
40 |
Table 2. Physical properties of TP304H steel. (Absorber and fins) [4]
|
Temperature/ ºC |
20 |
100 |
200 |
300 |
|
Specific heat capacity/J/(kg K) |
475 |
|
|
|
|
Density/kg/m3 |
7860 |
|
|
|
|
Elastic modulus/105 MPa |
1.97 |
1.93 |
1.85 |
1.78 |
|
Conductivity/W/(m K) |
12.1 |
12.6 |
13.0 |
13.8 |
|
Linear thermal expansion coefficient/10-6 ºC-1 |
_ |
17.1 |
17.4 |
17.8 |
The properties of the working fluid (nanofluid) of the present work are listed in Table 1, while the properties of the steel absorber pipe are listed in Table 2.
5.1 Surface plots of the MCRT simulation
It is known that the irradiation on the reflector will reflect to tube which it lies in the focal position, the ray paths which represent the directions of the reflected solar radiation towards the absorber will distribute with a non uniform manner, creating the q distribution on the reflector shown in Figure 7.
The heat flux reflected on the absorber can be illustrated as in the surface plot of the MCRT simulation which shows more heat flux values occurred through the reflecting surface to the absorber tube surface when Rim angle equal 120° compared to the plot of 80º. The heat flux value started from (22000 w/m2) at (x= -0.1), then it increased to (45000 w/m2) when (x= -0.075) then it decreased till it reaches (zero) at the point (x=0) which represent the shadow of the absorber on the reflector, then the plot is repeated itself due to match.
Figure 7. Surface plots of the MCRT simulation
5.2 Velocity contours characteristics
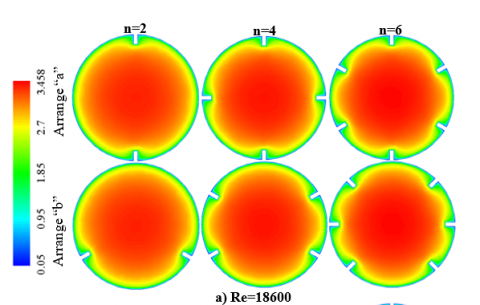
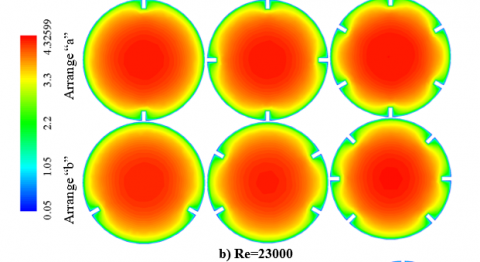
The inlet velocity in this study is in (m/s) varies depending on the Reynolds values, discussing the velocity contour of the fluid at an outlet region of the absorber based on three different Reynolds number (18600, 23000 and 28000) with two different arrangements "a" and "b" for each fins number which are (2, 4 and 6 respectively) as shown in Figure 8. The velocity with Z components has been studied because of its effective and clear influence compared to the velocity of the other two components.
Figure 8. Vz for different number of fin, arrangements and Re at outlet
Starting with Re=18600, when using two fins the velocity roughly stays the same value when changing the arrangement from "a" to ''b", also the same behavior occurs when using 4 and 6 fins.
Now moving horizontally in Figure 8 to notice that the velocity increased with increasing the number of fins from 2 to 4 and then to 6 fins the maximum outlet velocity achieved was (3.458m/s). That was due to augmentation in the number of fins leads to decline in the area of nanofluid stream, which leads to an increase in its velocity.
At Re=23000, when using two fins the velocity will not change when changing the arrangement from "a" to ''b", also the same behavior occur when using 4 and 6 fins.
And also the outlet velocity reached the maximum value when changing the number of fins from 2 to 4 and then to 6 fins and the maximum outlet velocity will be (4.32599m/s). Maximum velocity can be noticed in the center of the tube owing to the formation of the boundary layer on the wall of tube and fins.
Finally, at Re=28000, when using two fins the velocity will not change when changing the arrangement from "a" to ''b", also the same behavior occur when using 4 and 6 fins.
And also the outlet velocity reached the maximum value when changing the number of fins from 2 to 4 and then to 6 fins and the maximum outlet velocity will be (5.208m/s).
The higher outlet velocity achieved is (5.208 m/s) when the Reynolds number being (28000) and (6 Fins) than the other cases (2 and 4 Fins), that occur because of the cross sectional area reduction, according to the increasing of Fin’s number, where it is obvious that the velocity decrease from the center towards the circumferential of the absorber.
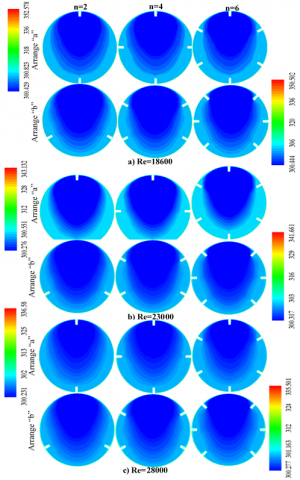
5.3 The temperature distribution characteristics
Figure 9 was chosen to explain the distribution of temperature along the absorber and the flowing fluid, the temperature contour was presented in the outlet section. The parameters that have main efficacy on convective rate between the heat flux on the surface and flowing nanofluid are Reynolds number (Re=18600,23000 and 28000), the number and arrangement of the longitudinal fins. The other parameters are fixed such as the nanoparticle volume concentration ( $\varphi=0.04$ ), the inlet temperature condition (Tin=300K). This is due to the effect of q'' on the wall of the tube. As the process of heat transfer happens by convection among the wall of the tube and the fluid along the stream. The maximum temperature appears on the distribution label in the temperature contour represents the solid surface temperature, while the minimum temperature on the distribution label represents the nano fluid temperature.
For the best performance of the heat transfer in the absorber tube and in order to select the best studied case among many cases which deals with different Reynolds numbers (18600, 23000 and 28000), different fin numbers (2, 4 and 6) and two different arrangements ("a" and "b"). Figure 9 illustrates the isotherms in the heat transfer fluid (HTF) inside the absorber and on the absorber wall surface at outlet region, it could be observed that the highest outlet wall temperature recorded for the flow was with Reynolds number (18600) and of arrangement ("a") which was (352.578K), while the lowest fluid outlet temperature was with Reynolds number of (28000) and arrangement ("a") was (300.231 K). As a result of the lower velocity at low Reynolds number, the nanofluid acquires more heat, so the exit temperature is higher. The two temperatures mentioned above not represented the preferred case for better enhancement that the study is looking for.
The best outlet fluid temperature must be the highest as much as possible to give the sign of the enhancement in the absorber performance, so the (300.444 K) at Reynolds number (18600) arrangement (b), the lowest absorber wall surface temperature was found (335.501 K) at Re (28000) and arrangement (b).
Although there are other temperatures recorded which were represented the wall surface of the absorber and the flowing fluid at the intermediate values of Re (23000), these temperatures are not useful for estimating the enhancement. The best heat transfer occurs when increasing the number of fins and Reynolds number which lead to increase the turbulence, as a consequence of that, the convective coefficient will increase thus Nu increase too.
It could be concluded that the case of Reynolds number equal to (28000), fin number n=6 and arrangement "b" represent the best case which gives better heat transfer performance (Twall outlet = 335.501K).
Figure 9. Temperature contours for different number of fin, arrangements and Re at outlet
5.4 TKE for different number of fin and arrangements and Re at outlet
Figure 10 illustrated the Turbulent Kinetic Energy (TKE) within the tube. When Re =18600, the TKE augmented with the increase of the number of fins for "a" arrangement, and TKE change when compared with arrangement "b" where it slightly increases from "a" to "b" for the same number of fins.
When Re=23000 and Re=28000, the TKE behaves in the same manner as in Re= 18600, but the values of TKE have clear increasing when increases the Re for the same set of the three different fin number when comparing arrangement "a" of Re=18600 with an arrangement "a" of Re=23000.
Moving from (Re=23000) to (Re=28000), although the TKE increase from (0.16297 to 0.223) respectively, but the red region area decreases slightly in the places that are close to the inner wall surface.
It is obvious that the highest values of (TKE) was (0.223) occurs in the flow of the Reynolds number of (28000) and (6 Fins) with "b" arrangement, and the regions close to the absorber inner wall surface close to the Fins showed highest (TKE) values than the other regions which represented with the red color, the high turbulence happen because of the non-uniform shape at the fins regions.
Figure 10. TKE for different number of fin, arrangements and Re at outlet
5.5 Effect of Rim angle on the outlet temperature
As tested for the heat flux concentration ratio of the collector which gave the preferable of the Rim angle (120º). Figure 11 showed the effect of Rim angle on the outlet temperature of the heat transfer fluid (HTF) for three different Reynolds numbers (18600, 23000 and 28000). At Re (18600) the outlet temperature is higher when the Rim angle (120º) than when the Rim angle is (80º) and the same thing repeated at Re (23000 and 28000).
The results discussed above are acceptable for each Reynolds number since the heat flux reflected on the absorber increasing with the bigger Rim angle (120º) according to the highest concentration ratio, then the heat transfer from the absorber wall to the flowing fluid increase, as a result of that the outlet temperature increased.
When the Reynolds number change from small value to bigger value, the outlet temperature (Tout) decreases because of the low velocity of the working fluid give more mass flow rate which carrying the heat to transfer from the absorber walls to the fluid itself.
The difference between the outlet temperatures in the case of the low Re (18600) and high Re (28000) are very small values and ranging from (300.52K to 300.35K), so the difference is (0.17 K). At low Reynolds number (Re=18600), the difference of outlet temperature between the rim angles (120º and 80º) is (0.02). At the moderate Reynolds number (Re=23000), the difference of outlet temperature between the rim angles (120º and 80º) is about (0.019), at high Reynolds number (Re=28000), the difference of outlet temperature between the rim angles (120º and 80º) is (0.015). These results indicated that the effect of the increasing Reynolds number of the temperature distribution of different rim angles is weak, so that rim angle of 120º can be used for different Reynolds number.
Figure 11. Tout results for different rim angle
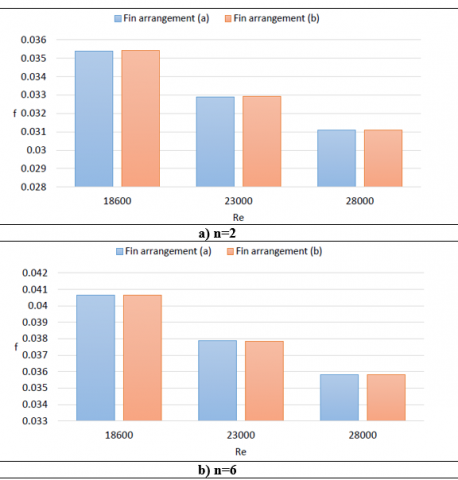
5.6 The effect of Reynolds number and number of fins on Darcy factor
Figure 12 illustrate the results of Darcy factor (f) for different Re and number of fins (n) at "a" fin arrangement. The reason of choosing an arrangement "a" only is that when using arrangement "b" will give similar results of "a" arrangement as portrayed in Figure 13. The Darcy factor decreased with the increase of Re as it has inverse proportion to the square mean velocity due to the Eq. (20) and this helps to augment the performance of the absorber tube and then the heat transfer efficiency.
$f=\frac{2 D_{i} \cdot \Delta P}{\rho \cdot u_{m}^{2} \cdot L}$ (20)
For each Re, the friction factor increases with the increment of the fin number from 2 to 4 then to 6, where the velocity in this case is constant as the Re constant, so the increment of (n) will cause the area of friction between the fluid and solid surface to be increase resulting in the increasing of friction factor (f).
For each fin number (n), the value of (f) slightly decreased with the elevate of Re because the high velocities accompanied with the high Re number which lead to overcoming the surface friction. In general the friction factor decreasing with increasing of Re for each set of the three different numbers of fins (n) as obvious in Figure 12.
Figure 12. Friction factor results for different (n) and (Re) at “a” fin arrangement
Figure 13. Friction factor results for different fin arrangements
Since the Nusselt number is direct proportional with (h) and the use of the longitudinal fins as well as the nano material led to increasing of (h), at the same time the contact area increased among the flowing fluid and the inner wall surface of the absorber tube also increased, resulting in more heat transfer between the contact surfaces.
$N u=\frac{h D_{i}}{k}$ (21)
In Figure 14, at Re=18600 the Nusselt number (Nu) augments with elevate of the number of fins and the same thing occurred at Re= (23000, 28000).
The Nusselt number (Nu) also increases with the Re increases for each set of the fin numbers at arrangement "a".
To compare the Nusselt number (Nu) of arrangement "a" and arrangement "b", move to Figure 15 which contained three separate diagrams with fin number (n=2, n=4 and n=6) respectively.
For (n=2, Re=18600) the Nusselt number is higher at arrangement "b" than its value at arrangement "a", and so the values of Nu in the case of Re=23000 and Re=28000 being higher for "b" arrangement than the "a" arrangement. The arrangement of fins in case "b" distributes the fins in the hottest region therefore the heat transfer rate was enhanced.
The same behavior exactly appears when discussing the cases of n=4 and n=6.
The overall look at the Figures 14 and 15 it could be concluded that the highest Nu occur at Re= 28000 with an arrangement "b" and number of fins (n=6) where it almost reach (500 w/m2) as well as the high value of Nu when increasing the fin number signified the enhancement in the heat transfer efficiency of the absorber tube by using the longitudinal fins.
Figure 14. Average Nusselt number results for different (n) and Re at “a” fin arrangement
Figure 15. Average Nusselt number results for different fin arrangements
5.7 Performance- evaluation criteria (PEC)
There was multi effect of both Nusselt numbers (Nu) and the Darcy factor (f) that employed to measure the overall hydrothermal behavior of the absorber tube using PEC [42]:
$P E C=\frac{\left(\frac{N u}{N u_{0}}\right)}{\left(\frac{f}{f_{0}}\right)^{1 / 3}}$ (22)
Figure 16. PEC results for different (n) and (Re) at “a” fin arrangement
Figure 17. PEC results for different fin arrangements
Figure 16 depicts the change of the thermal performance factor versus Reynolds number for three different numbers of longitudinal fins (2, 4, 6) in the absorber tube, it can be observed that the thermal performance factor values are greater than unity and slightly decrease with the augment in the number of Reynolds at same fin number. Additionally, when the fin number increases the thermal performance factor increases at the same Re, this implies that the increase in pressure loss can be balanced by the improvement in the heat transfer when using finned tube comparison to the smooth tube.
To discover the role of the two fins arrangement studied, Figure 17 showed three separate diagrams, each one represented the relation between the performance evaluation criteria (PEC) and Reynolds number for two different arrangements of the longitudinal fins supported in the absorber tube "a" and "b", each case studied with fixed number of fins (2, 4 and 6).
For (n=2), arrangement "a" the PEC almost stayed constant when Re increased and still more than unity in its value. While the PEC slightly decreased for n=2 and at arrangement "b" when Re increased. It was noticed that the same behavior repeated in the second and third diagrams with little difference in PEC values for each case, as well as the highest PEC achieved with the case of (n=6), arrangement "b" and Re=18600 which is roughly equal (1.060845).
This study investigates the impacts of the Reynolds number, number of fins and the arrangements of the fins. There is an important point including the usage of high Reynolds number which is higher than 15000, the explanation for this point is that at the low values of Re (5000 to 10000), the Nusselt number not increased significantly even when changing the nanomaterial volume ratio from (0% to 4%), while the increasing in (Nu) being obvious when comparing between the nano material volume ratios (0% and 4%) at Re values higher than 15000 as it is illustrated in Figure 18.
The other important point is that the choice of direct normal irradiation (DNI= 1000 W/m2) in the present study is because it is very close to the readings recorded in the Babylon province during the summer season, the solar global pyranometer measurement is 1031 W/m2.
The numerical results for different parameters can be detailed as below:
The outlet fluid temperature Tout has biggest value when Re=18600, while it has moderate value at Re=23000, and the lowest value achieved at Re=28000.
Tout has the biggest values for rim angle=120o than rim angle=80o for all three Re values mentioned in point number (1) above.
The friction factor value doesn’t change when using different fins arrangements for the same number of fins and Re (changing the arrangements of fins not affecting on the friction factor).
Nusselt number has the maximum values (Re= 28000 rather than Re=18600 and 23000), same as when (n=6 rather than n=2 or 4 fins), that is due to the heat transfer coefficient enhancement.
Nusselt number has the maximum values with the arrangement "b" for all Re and n values mentioned in point (6).
The PEC has the maximum value when (n=6 rather than n=2 or 4), also when Re=18600 rather than (Re=23000 or 28000).
The PEC has the maximum value with arrangement "b" for all the Re and n values mentioned in point (7).
Figure 18. Influence of adding nanoparticles to base fluid
|
Cp |
specific heat, J/kg.K |
|
f |
Darcy factor |
|
Gk |
rate of turbulent kinetic energy generation, kg/m.s3 |
|
K |
thermal conductivity of fluid |
|
TKE |
turbulent kinetic energy, m2/s2 |
|
Nu |
Nusselt number |
|
Re |
Reynolds number |
|
T |
temperature, K |
|
U |
velocity, m/s |
|
Greek symbols |
|
|
$\mathcal{E}$ |
turbulent dissipation rate [m2/s3] |
|
$\phi$ |
Volume fraction [-] |
|
$\rho$ |
density [kg/m3] |
|
$\sigma_{\varepsilon}$ |
turbulent Prandtl number for $\varepsilon$ [-] |
|
$\sigma_{k}$ |
turbulent Prandtl number for K [-] |
|
$\mu$ |
dynamic viscosity of fluid [kg/s.m] |
|
ν |
kinematic viscosity [m2/s] |
|
Subscripts |
|
|
bf |
base-fluid |
|
B |
Bulk |
|
nf |
Nanofluid |
|
np |
Nano-particle |
|
t |
turbulent kinetic energy |
|
w |
Wall |
|
Abbreviations |
|
|
PEC |
performance evaluation criterion |
|
FVM |
Finite volume method |
[1] Padilla, R.V., Demirkaya, G., Goswami, D.Y., Stefanakos, E., Rahman, M.M. (2011). Heat transfer analysis of parabolic trough solar receiver. Applied Energy, 88(12): 5097-5110. https://doi.org/10.1016/j.apenergy.2011.07.012
[2] Cabrera, F.J., Fernández-García, A., Silva, R.M.P., Pérez-García, M. (2013). Use of parabolic trough solar collectors for solar refrigeration and air-conditioning applications. Renewable and Sustainable Energy Reviews, 20: 103-118. https://doi.org/10.1016/j.rser.2012.11.081
[3] Patil, R.G., Panse, S.V., Joshi, J.B. (2014). Optimization of non-evacuated receiver of solar collector having non-uniform temperature distribution for minimum heat loss. Energy Conversion and Management, 85: 70-84. https://doi.org/10.1016/j.enconman.2014.05.047
[4] Wang, Y., Liu, Q., Lei, J., Jin, H. (2015). Performance analysis of a parabolic trough solar collector with non-uniform solar flux conditions. International Journal of Heat and Mass Transfer, 82: 236-249. https://doi.org/10.1016/j.ijheatmasstransfer.2014.11.055
[5] Wang, F., Tan, J., Ma, L., Wang, C. (2015). Effects of glass cover on heat flux distribution for tube receiver with parabolic trough collector system. Energy Conversion and Management, 90: 47-52. https://doi.org/10.1016/j.enconman.2014.11.004
[6] Amina, B., Miloud, A., Samir, L., Abdelylah, B., Solano, J.P. (2016). Heat transfer enhancement in a parabolic trough solar receiver using longitudinal fins and nanofluids. Journal of Thermal Science, 25(5): 410-417. https://doi.org/10.1007/s11630-016-0878-3
[7] Bellos, E., Tzivanidis, C., Antonopoulos, K.A. (2017). A detailed working fluid investigation for solar parabolic trough collectors. Applied Thermal Engineering, 114: 374-386. https://doi.org/10.1016/j.applthermaleng.2016.11.201
[8] Wang, Y., Xu, J., Liu, Q., Chen, Y., Liu, H. (2016). Performance analysis of a parabolic trough solar collector using Al2O3/synthetic oil nanofluid. Applied Thermal Engineering, 107: 469-478. https://doi.org/10.1016/j.applthermaleng.2016.06.170
[9] Gong, X., Wang, F., Wang, H., Tan, J., Lai, Q., Han, H. (2017). Heat transfer enhancement analysis of tube receiver for parabolic trough solar collector with pin fin arrays inserting. Solar Energy, 144: 185-202. https://doi.org/10.1016/j.solener.2017.01.020
[10] Bellos, E., Tzivanidis, C. (2017). Parametric investigation of nanofluids utilization in parabolic trough collectors. Thermal Science and Engineering Progress, 2: 71-79. https://doi.org/10.1016/j.tsep.2017.05.001
[11] Jin, J., Ling, Y., Hao, Y. (2017). Similarity analysis of parabolic-trough solar collectors. Applied Energy, 204: 958-965. https://doi.org/10.1016/j.apenergy.2017.04.065
[12] Subramani, J., Nagarajan, P.K., Mahian, O., Sathyamurthy, R. (2018). Efficiency and heat transfer improvements in a parabolic trough solar collector using TiO2 nanofluids under turbulent flow regime. Renewable Energy, 119: 19-31 https://doi.org/10.1016/j.renene.2017.11.079
[13] Mwesigye, A., Meyer, J.P. (2017). Optimal thermal and thermodynamic performance of a solar parabolic trough receiver with different nanofluids and at different concentration ratios. Applied Energy, 193: 393-413. https://doi.org/10.1016/j.apenergy.2017.02.064
[14] Bellos, E., Tzivanidis, C., Tsimpoukis, D. (2018). Optimum number of internal fins in parabolic trough collectors. Applied Thermal Engineering, 137: 669-677. https://doi.org/10.1016/j.applthermaleng.2018.04.037
[15] Wang, Q., Yang, H., Huang, X., Li, J., Pei, G. (2018). Numerical investigation and experimental validation of the impacts of an inner radiation shield on parabolic trough solar receivers. Applied Thermal Engineering, 132: 381-392. https://doi.org/10.1016/j.applthermaleng.2017.12.112
[16] Wang, Q., Yang, H., Hu, M., Huang, X., Li, J., Pei, G. (2018). Preliminary performance study of a high-temperature parabolic trough solar evacuated receiver with an inner transparent radiation shield. Solar Energy, 173: 640-650. https://doi.org/10.1016/j.solener.2018.07.065
[17] Fan, M., You, S., Xia, J., Zheng, W., Zhang, H., Liang, H., Li, X., Li, B. (2018). An optimized Monte Carlo ray tracing optical simulation model and its applications to line-focus concentrating solar collectors. Applied Energy, 225: 769-781. https://doi.org/10.1016/j.apenergy.2018.05.067
[18] Korres, D., Bellos, E., Tzivanidis, C. (2019). Investigation of a nanofluid-based compound parabolic trough solar collector under laminar flow conditions. Applied Thermal Engineering, 149: 366-376. https://doi.org/10.1016/j.applthermaleng.2018.12.077
[19] Hachicha, A.A., Rodríguez, I., Ghenai, C. (2018). Thermo-hydraulic analysis and numerical simulation of a parabolic trough solar collector for direct steam generation. Applied Energy, 214: 152-165. https://doi.org/10.1016/j.apenergy.2018.01.054
[20] Cheng, Z.D., Zhao, X.R., He, Y.L. (2018). Novel optical efficiency formulas for parabolic trough solar collectors: Computing method and applications. Applied Energy, 224: 682-697. https://doi.org/10.1016/j.apenergy.2018.05.033
[21] Tagle-Salazar, P.D., Nigam, K.D.P., Rivera-Solorio, C.I. (2018). Heat transfer model for thermal performance analysis of parabolic trough solar collectors using nanofluids. Renewable Energy, 125: 334-343. https://doi.org/10.1016/j.renene.2018.02.069
[22] Chang, C., Sciacovelli, A., Wu, Z., Li, X., Li, Y., Zhao, M., Deng, J., Wang, Z., Ding, Y. (2018). Enhanced heat transfer in a parabolic trough solar receiver by inserting rods and using molten salt as heat transfer fluid. Applied Energy, 220: 337-350. https://doi.org/10.1016/j.apenergy.2018.03.091
[23] Bozorg, M.V., Doranehgard, M.H., Hong, K., Xiong, Q. (2020). CFD study of heat transfer and fluid flow in a parabolic trough solar receiver with internal annular porous structure and synthetic oil–Al2O3 nanofluid. Renewable Energy, 145: 2598-2614. https://doi.org/10.1016/j.renene.2019.08.042
[24] Bellos, E., Tzivanidis, C. (2019). Thermal efficiency enhancement of nanofluid-based parabolic trough collectors. Journal of Thermal Analysis and Calorimetry, 135(1): 597-608. https://doi.org/10.1007/s10973-018-7056-7
[25] Bellos, E., Tzivanidis, C. (2019). Investigation of a booster secondary reflector for a parabolic trough solar collector. Solar Energy, 179: 174-185. https://doi.org/10.1016/j.solener.2018.12.071
[26] Donga, R.K., Kumar, S. (2019). Thermal performance of parabolic trough collector with absorber tube misalignment and slope error. Solar Energy, 184: 249-259. https://doi.org/10.1016/j.solener.2019.04.007
[27] Ekiciler, R., Arslan, K., Turgut, O., Kurşun, B. (2021). Effect of hybrid nanofluid on heat transfer performance of parabolic trough solar collector receiver. Journal of Thermal Analysis and Calorimetry, 143(2): 1637-1654. https://doi.org/10.1007/s10973-020-09717-5
[28] Bellos, E., Tzivanidis, C., Said, Z. (2020). A systematic parametric thermal analysis of nanofluid-based parabolic trough solar collectors. Sustainable Energy Technologies and Assessments, 39: 100714. https://doi.org/10.1016/j.seta.2020.100714
[29] Olia, H., Torabi, M., Bahiraei, M., Ahmadi, M.H., Goodarzi, M., Safaei, M.R. (2019). Application of nanofluids in thermal performance enhancement of parabolic trough solar collector: state-of-the-art. Applied Sciences, 9(3): 463. https://doi.org/10.3390/app9030463
[30] Abed, N., Afgan, I. (2020). An extensive review of various technologies for enhancing the thermal and optical performances of parabolic trough collectors. International Journal of Energy Research, 44(7): 5117-5164. https://doi.org/10.1002/er.5271
[31] Rehman, K.U., Algehyne, E.A., Shahzad, F., Sherif, E.S.M., Chu, Y.M. (2021). On thermally corrugated porous enclosure (TCPE) equipped with Casson liquid suspension: Finite element thermal analysis. Case Studies in Thermal Engineering, 25: 100873. https://doi.org/10.1016/j.csite.2021.100873
[32] Rehman, K.U., Shatanawi, W., Zahri, M., Sherif, E.S.M., Junaedi, H., Lv, Y.P. (2021). Thermal analysis on uniformly heated diamond obstruction in convective liquid suspension. Case Studies in Thermal Engineering, 26: 101062. https://doi.org/10.1016/j.csite.2021.101062
[33] Jaramillo, O.A., Borunda, M., Velazquez-Lucho, K.M., Robles, M. (2016). Parabolic trough solar collector for low enthalpy processes: An analysis of the efficiency enhancement by using twisted tape inserts. Renewable Energy, 93: 125-141. https://doi.org/10.1016/j.renene.2016.02.046
[34] Naveenkumar, R., Ravichandran, M., Stalin, B., Ghosh, A., Karthick, A., Aswin, L.S.R.L., Priyanka S.S.H., Kumar, S.P., Kumar, S.K. (2021). Comprehensive review on various parameters that influence the performance of parabolic trough collector. Environmental Science and Pollution Research, 28: 22310-22333. https://doi.org/10.1007/s11356-021-13439-y
[35] Afsharpanah, F., Sheshpoli, A.Z., Pakzad, K., Ajarostaghi, S.S.M. (2021). Numerical investigation of non-uniform heat transfer enhancement in parabolic trough solar collectors using dual modified twisted-tape inserts. Journal of Thermal Engineering, 7(1): 133-147. https://doi.org/10.18186/thermal.846584
[36] Fluent Ansys. (2013). Ansys Fluent Theory Guide. ANSYS Inc., USA, vol. 15317, no. November, pp. 724-746.
[37] Kasaeian, A.B. (2012). Convection heat transfer modeling of Ag nanofluid using different viscosity theories. IIUM Engineering Journal, 13(1). https://doi.org/10.31436/iiumej.v13i1.149
[38] Khanafer, K., Vafai, K. (2011). A critical synthesis of thermophysical characteristics of nanofluids. International Journal of Heat and Mass Transfer, 54(19-20): 4410-4428 https://doi.org/10.1016/j.ijheatmasstransfer.2011.04.048
[39] Yu, W., Choi, S.U.S. (2003). The role of interfacial layers in the enhanced thermal conductivity of nanofluids: A renovated Maxwell model. Journal of Nanoparticle Research, 5(1): 167-171. https://doi.org/10.1023/A:1024438603801
[40] Batchelor, G.K. (1977). The effect of Brownian motion on the bulk stress in a suspension of spherical particles. Journal of Fluid Mechanics, 83(1): 97-117. https://doi.org/10.1017/S0022112077001062
[41] Cengel, Y.A. (2003). Heat Transfer: A Practical Approach. McGraw-Hill, New York, USA.
[42] Malekan, M., Khosravi, A., Syri, S. (2019). Heat transfer modeling of a parabolic trough solar collector with working fluid of Fe3O4 and CuO/Therminol 66 nanofluids under magnetic field. Applied Thermal Engineering, 163: 114435. https://doi.org/10.1016/j.applthermaleng.2019.114435