Ziyad Tark* | Ahmed J. Hamed | Abdul Hadi N. Khalifa
© 2022 IIETA. This article is published by IIETA and is licensed under the CC BY 4.0 license (http://creativecommons.org/licenses/by/4.0/).
OPEN ACCESS
In this study, a Thermo Electric Cooler (TEC) was manufactured and investigated experimentally. The heat sink, geometry, fin number, fin length, and heat sink dimensions are studied theoretically. The performance of the TEC is studied under three variables, namely: the THC power, airspeed, and ambient temperature. Two heat sinks are used for each Peltier module. The first one is for the cooling side, while the second one is for the hot side. In the theoretical part, the geometry and the dimensions of the heat sink are studied using one-dimensional heat transfer equations, as well as a theoretical simulation of the performance of a single Peltier module is achieved. The results show that the cooling capacity increases with the increase in airspeed, and the maximum cooling capacity was 180 W at an airspeed of 4 m/s and TEC power of 300 W. The maximum figure of merit of the TEC is about 0.23 when the TEC power is 350 W, at 4 m/s airspeed and an ambient temperature of 43℃. The theoretical results showed that the number of fins affected the total sink thermal resistance and that thermal resistance reduced sharply from 6.5 to about 2 m2 K/W when the fin number increased to 6. When the TEC power is 350 W, the airspeed is 4 m/s, and the ambient temperature is 28℃, the maximum TEC efficiency is 0.5%. Finally, the comparison between the current work and the other works shows the same trends in the variables under comparison.
TEC, thermoelectric cooling, Peltier effect, fin, performance
Providing a comfortable shelter for a human being is the first challenge for air conditioner engineers. These problems are solved today, but the problems associated with providing human comfort within the living space, like ozone depletion and global warming issues, have become sources of concern for the whole world. It is well known that the many types of refrigerants used in air conditioners and refrigeration systems negatively affect both ozone depletion and the global warming effect. Also, the power used to drive such devices produces CO2, which is one of the main factors that causes global warming.
Environmental and design problems for air-conditioning and refrigeration systems can be overcome by looking for other systems that can work without refrigerants, consume less energy, and work on environmentally friendly energy sources. Thermoelectric cooling, discovered in the eighteenth century, can replace air conditioning systems, especially systems with small capacities or in spot air conditioning.
Meng et al. [1] developed a 3D transient model for TEC by coupling the electric conduction and the heat transfer within a semiconductor. When developing the model, the Thomson effect, Joule heating, Fourier's heat conduction, and Peltier effect were considered. The model was used to compare the dynamics of temperature variation for both constant and variable material properties. Su et al. [2] introduced an integrated TEC with a dye-sensitized solar cell (DSSC) to harvest solar energy for solar refrigerators. The electron diffusion model was used to find the characteristics of current-voltage for the DSSC. The effects of the entropy generation within the TEC, current density, and the structure parameter on the integrated system performance were studied. The result showed that the studied variables could improve the COP.
Yilmazoglu [3] investigated the performance of a thermoelectric module for heating and cooling purposes. The fin geometry was selected using a numerical analysis for the temperature–pressure and velocity vector. The numerical results were validated by comparing the results with the experimental results. The effect of air velocity on the fin temperature distribution and the variation of the properties of air was investigated for different airspeeds, and a thermal image camera was used to obtain the fin temperature contour. Teffah et al. [4] investigated the thermally series connection between TEC and thermoelectric generator (TEG) experimentally and through modeling. COMSOL Multiphysics was used to study the performance of the thermal connections where TEG was used as a partial heat sink to the TEC. Mainil et al. [5] investigated the effects of different input power and cooling on TEC performance. Three inputs of power and two cooling loads were studied. The results showed that the COP and the temperature difference between the hot and cold sides are directly proportional to the input power. Kabeel et al. [6] studied the effect of input power, theoretically, on the velocity of working fluid, working fluid type, and TEC configuration on the COP and the heat transfer rate from the cold side of TEC.
Siahmargoi et al. [7] introduced a correlation for the performance of a single-stage TEC. The correlation for the two sinks of TEC was based on mathematical and thermodynamic equations. The effects of changing the thermoelectric module thermal resistance and voltage drop on the TEC performance were studied. Mirmanto et al. [8] studied the effect of the thermoelectric position in a 360 ml coolbox on the TEC performance. Different positions of thermoelectric modules were used, namely, at the top, the bottom, and on the wall. It was found that the COP decreased with the operation time, and the best location for the modules was on the wall. A study by Guzmán et al. [9] studied the performance of solar-powered TEC that was used to store the vaccines. A Peltier module of 70 W was powered by a 90-panel and 40 Ah battery. The different thermal loads were examined. The results showed that the solar-powered TEC is a promising technology in a remote area. Thiangchanta et al. [10] studied the TEC performance experimentally in a vacuum wall to reduce the heat loss from a cooling box. It was found that consumed power was inversely related to the cooling box's inside temperature, and the box's heat gain was proportional directly to the vacuum level. Moazzez et al. [11] studied the effects of two main parameters on the performance of TEC; those parameters were the volume flow rate of air and the inlet air temperature. The work was achieved experimentally and theoretically using ANSYS CFX software. Ishida [12] introduced a simple formula for maximum efficiency by conserving the heat consumed in TEG. The formula was derived and discussed in terms of a realistic dimensionless thermoelectric figure of merit, taking the temperature-dependent coefficient of Seebeck. Lu et al. [13] studied a full-scale 3D trapezoidal TEC. The TEC was analysed using finite element simulation. The variables under study were the input power and the geometry of the thermoelectric leg. The results were compared with those for the rectangular TEC. The results showed that the increasing height of the thermoelectric leg and the TEC cross-sectional area improved the TEC COP. Remeli et al. [14] studied the performance of a mini TEC for a cooling box; the effect of the heat sink type and the TEC size on the TEC performance was studied. The data of the thermal resistance model was validated by comparing the model results with those of the experimental. Albatati and Attar [15] studied analytically the ability to use the exhaust engine waste heat to power TEG, an optimization for the TEC to get the maximum cooling effect. The TEG produced about 1.2 kW. The analytical model was compared with an experimental study to validate it.
Liu et al. [16] proposed a two-phase thermosyphon to control the temperature inside the TEC compartment. The optimization of the PCM was done using the orthogonal experiment method. It was found that the TPLT can perform optimum cooling with a fill ratio of 27%. When the average temperature of the TEC compartment increased, the ON-OFF time of the TPLT was 32 minutes, and the working ratio changed from 86.3 to 13.6%. The temperature control accuracy was improved from 2.1 to 0.6℃, and the working time was reduced from 49.8 min to 22.4 min.
In the current work, a Thermo Electric Cooler (TEC) is manufactured and investigated experimentally. A TEC cooler consists of eight Peltier modules, each of which has a 50 W cooling capacity. The performance of the TEC is studied under three variables, namely: the THC power, airspeed, and ambient temperature. In the theoretical, the heat sink geometry, fin number, fin length, and heat sink dimensions are studied theoretically using one-dimensional heat transfer equations, and a theoretical simulation of the performance of a single Peltier module is achieved.
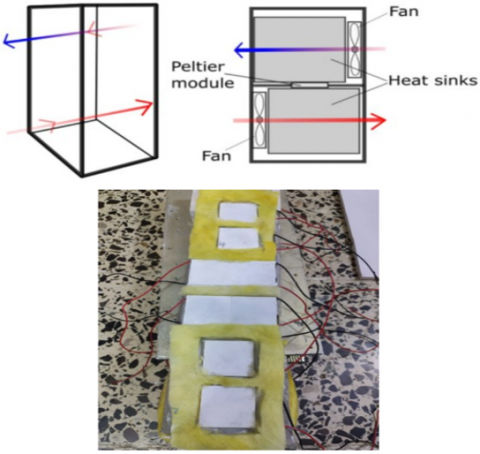
Eight Peltier modules are used to study the effect of Peltier capacity on the TEC performance, as well as the achievement of thermal comfort for the person within the spot area. The Peltier modules are electrically connected in series and thermally in parallel, as shown in Figure 1. The test rig consists of eight Peltier modules of type TEC1-12706. Each module has a 50 W cooling capacity and dimensions of 40 x 40 x 3.8 mm. The total capacity of the TEC is 400 W. Figure 2 shows the location distribution of the Peltier modules.
Figure 1. TEC schematic diagram
Figure 2. The location distribution of the Peltier modules
Table 1. Peltier module properties
|
Type Peltier element |
TEC1-12706 |
P-N Junction |
127 couples |
|
Design |
Without silicone sealed |
Material |
Al2O3 (aluminum oxide) |
|
Max. Temperature |
138℃ |
Wire Size |
18AWG |
|
Max. Voltage |
14.2 V |
Wire length |
150mm |
|
Max. Current |
5.3 A |
Wire Insulation Material |
Teflon |
|
Resistance |
27g |
Weight |
27g |
|
Qmax. @ Delta T=0 |
50 W |
Size |
40x40x3.8mm |
|
Delta T max. |
66℃ |
Manufacturer |
Hebei |
|
P-N Junction |
127 couples |
|
|
Table 2. Thermo- physical dimensions of the heat sink and Peltier element
|
Parameter |
Value |
|
Heat sink |
|
|
Material |
Aluminum |
|
Type of fins |
Rectangular |
|
Thermal conductivity of the wall |
236.6 (w/m.K) |
|
Dimension |
40 mm×40 mm×20 mm |
|
Number of fins |
11 |
|
Fine thickness |
1.5 (mm) |
|
Base heat sink thickness |
3 (mm) |
The maximum DC voltage of the module is 14.2 V, the maximum DC current is 5.3 A, the maximum operating temperature should not be more than 138, and the maximum temperature difference between the hot and cold sides is 66. The full properties of the Peltier module are shown in Table 1. Two heat sinks are used for the hot and cold sides of the Peltier module. The heat sink is made from aluminium and has 11 fins. The dimensions of each heat sink are 40×40×20 mm. The fin thickness is 1.5 mm while the base thickness is 3 mm. The thermal conductivity of the heat sink is 236.6 W/m.K. Table 2 shows the heat sink properties.
Two power supplies are used. The first one is to power the Peltier modules, type SAN, with a rated power of 400 W and a 220 V input voltage. The second is used to power the hot and cold air fans. The input of the fan's power supply is 220 V, and the output is 12 V, 20 A, and the rated power is 240 V. Two types of fans are used in the TEC. For the first type, two centrifugal fans are used to blow the air over the hot module. The fan rpm is 5300 at 12 V DC, the input maximum input current is 2.94 A, the maximum power is 38.28 W, and the maximum air volume flow rate at zero static pressure is 1.302 m3/min. The second type is a constant speed RPM fan. Two fans are used to blow the air over the cold side of Peltier modules. The input is 24 V, 0.135 A, rated power is 1.7 W, and the volume flow rate is 1 m3/min. The Peltier modules are installed in an insulated enclosure. The speed of air at the hot and cold sides of the Peltier modules is measured using a digital anemometer of type WT816A. The measurement range of the anemometer is 0 to 30 m/s; the resolution of the reading is 0.1 m/s. The ambient air temperature, hot air, cold air, and cold side of Peltier modules are measured using K-type thermocouples connected to a temperature reader. The measurement temperature range of the thermocouple is 0 to 700. The resolution of the temperature reader is 0.25. The uncertainty propagation was analysed using an Engineering Equation Solver (EES) for the most important parameters.
3.1 Model analysis
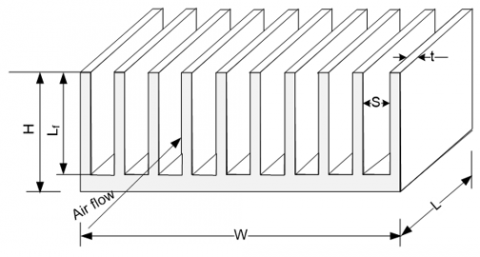
Teertstra et al. [17] proposed a heat transfer coefficient model that combined the developed and fully developed flow for the heat sink. Figure 3 shows the geometry and dimensions of a heat sink. The assumption used to analyse the heat sink is that there is forced convection over the plate face and the fine base temperature is at a constant temperature.
The maximum allowable heat sinks thermal resistance $R_{\max }$ is:
$R_{\max }=\frac{T_{\max }-T_{a, i n}}{P_{\operatorname{mod}}}$ (1)
where:
$T_{\max }$: Maximum allowable element temperature (K);
$P_{\text {mod }}$: Module power (W).
The thermal resistance of the heat sink is:
$R_{H S}=\frac{1}{h \cdot\left(A_{b}+N \cdot A_{f} \cdot \eta_{f}\right)}$ (2)
The sink base area is:
$A_{b a s}=(N-1) S L_{f}$ (3)
Figure 3. Heat sink model under consideration
The fin area is:
$A_{f i n}=2 L L_{c}$ (4)
$L_{c}=L_{f}+\frac{t}{2}$ (5)
The total heat sink area is:
$A_{\text {tot }}=N \cdot A_{\text {fin }}+A_{\text {bas }}$ (6)
Then, the fin efficiency is [18]:
$\eta_{f}=\frac{\tanh \left(m \cdot L_{f}\right)}{m \cdot L_{f}}$ (7)
$m=\sqrt{\frac{2 . h}{k_{f i n} \cdot t_{f i n}}}$ (8)
The space between the two fins is:
$s=\frac{W-N . t}{N-1}$ (9)
The air velocity between two fins in terms of the air volume flow rate can be calculated as follows:
$U_{\infty}=\frac{\dot{V}_{a}}{N \cdot S \cdot L_{f}}$ (10)
$U_{\infty}$: air velocity (m/s);
$\dot{V}_{a}$: volume flow rate of air (m3/s).
The heat transfer coefficient of the fin is [17]:
$N u_{s}=\left[\frac{1}{\left\{\frac{R e \cdot P r}{2}\right\}^{3}}+\frac{1}{\left\{0.664 \sqrt{\operatorname{Re}} \cdot \operatorname{Pr}^{\frac{1}{3}} \cdot \sqrt{1+\frac{3.65}{\sqrt{R e}}}\quad \right\}^\quad{3}}\right]^{-\frac{1}{3}}$
0.26≤0.Re≤176 (11)
The Prandtl number is:
$P r=\frac{\mu_{a} \cdot c_{p a}}{k_{a}}$ (12)
$k_{a}$: thermal conductivity of air.
$\mu_{a}$: the dynamic viscosity of air (Pa.s).
The properties of air are taken at the average inlet and outlet air temperature as shown below:
$T_{f}=\frac{T_{a . i n}+T_{a, o u t}}{2}$ (13)
The modified channel Reynolds number that used in Eq. (1) is [17]:
$R e=\frac{\rho_{a} \cdot U_{\infty} \cdot S}{\mu_{a}} \cdot \frac{S}{L}$ (14)
$\rho_{a}$: Density of air (kg/m3).
Also, the heat transfer coefficient:
$R h=N u_{b} \cdot \frac{k_{a}}{S}$ (15)
The total thermal resistance is:
$R_{\text {tot }}=R_{H S}+\frac{H-L_{f}}{k_{b a s} \cdot W \cdot L}$ (16)
where:
$k_{b a s}$: the thermal conductivity of the base fine metal (W/m. K).
The heat dissipated from the sink is:
Also, the total heat transfer by convection from the fins is [18]:
$Q_{t}=h \cdot A_{t} \cdot\left[1-\frac{N \cdot A_{f}}{A_{t}}\left(1-\eta_{f}\right)\right] \theta_{b}$ (17)
where:
$Q_{t}$: total heat transfer (W);
$\theta_{b}$: the temperature difference between fin base ($T_{b}$) and ambient temperature $\left(T_{a m b}\right)$ (K) and can be calculated as follows:
$\theta_{b}=T_{b}-T_{a m b}$ (18)
3.2 Modeling of the thermoelectric cooler
The modelling of the thermoelectric cooler needs the thermo-physical information of the Peltier element, such as the physical dimensions and the seed beck coefficient, electrical resistance, thermal conductivity, the maximum voltage drops, the maximum current, and the maximum temperature difference. Figure 4 shows a thermoelectric cooler with a single Peltier element. Two heat sinks are used in the system, one for the hot side and the second for the cold side.
The maximum electrical resistance, seed beck coefficient, and thermal conductivity of the Peltier element can be calculated as follows [19]:
$R_{m}=\frac{V_{\max } \cdot\left(T_{a m b} \quad \cdot-\Delta T_{\max }\right)}{I_{\max } \cdot T_{a m b}}$ (19)
$\alpha_{m}=\frac{V_{\max }\quad.}{T_{a m b}}$ (20)
$k_{m}=\frac{I_{\max }\quad \cdot V_{\max } \quad \cdot\left(T_{a m b}\quad \cdot-\Delta T_{\max }\right)}{2 \Delta T_{\max } \quad\cdot T_{a m b}}$ (21)
where:
$R_{m}$: Maximum electrical resistance of the Peltier element (Ω);
$V_{\max }$: Maximum voltage drops across the Peltier element (V);
$I_{\max }$: Maximum current passes through the Peltier element (A);
$\Delta T_{\max }$: Maximum temperature difference between the hot and cold sides of the Peltier (K);
$\mathrm{T}_{\mathrm{amb}}$: Ambient temperature (K);
$\alpha_{\mathrm{m}}$: Maximum See beck coefficient (V/K);
$\mathrm{K}_{\mathrm{m}}$: Maximum thermal conductivity of the Peltier (m.K/W).
Also, the heat transfer by both sides of the Peltier element can be written as:
The heat dissipates and gained by hot and cold sides can be written as [7]:
$Q_{h}=\alpha \cdot I \cdot T_{h}+0.5 I^{2} R-k_{p} \cdot \Delta T$ (22)
$Q_{C}=\alpha \cdot I \cdot T_{c}-0.5 I^{2} R-k_{p} \cdot \Delta T$ (23)
where:
α: See beck coefficient (V/K);
I: Current (A);
$T_{h}$: hot side temperature (K);
$T_{c}$: Cold side temperature (K);
R: electrical resistance (Ω);
$k_{p}$: thermal conductance (W/m. K).
The temperature difference ΔT equals to:
$\Delta T=T_{h}-T_{c}$ (24)
The power supplied and the voltage drop of the Peltier element are as follows [20]:
$V=\alpha . \Delta T+R . I$ (25)
$P=V I$ (26)
The heat transfer to the ambient from the hot Peltier side is:
$Q_{h}=\frac{\left(T_{h}-T_{o}\right)}{R_{h}}$ (27)
The heat transfer to the cold Peltier side is:
$Q_{C}=\frac{\left(T_{i}-T_{C}\right)}{R_{C}}$ (28)
where:
$Q_{h}$ and $Q_{c}$: the heat dissipates and is gained by hot and cold sides respectively (W);
$T_{i}$ and $T_{o}$: environment temperature at cold and hot Peltier sides (K);
$T_{h}$ and $T_{C}$: hot and cold side temperatures respectively (K);
$R_{h}$ and $R_{c}$: resistance of the heat sink at the hot and cold surface (k/W).
The cold and hot side temperature of the Peltier element can be caudated as follows [7]:
$T_{h}=\frac{T_{o}-0.5 R I^{2} R_{h}+k_{p} \Delta T R_{h}}{1-\alpha I R_{h}}$ (29)
$T_{c}=\frac{T_{i}+0.5 R I^{2} R_{c}+k_{p} \Delta T R_{c}}{\alpha I R_{c}+1}$ (30)
The coefficient of performance of the Peltier is:
$C O P=\frac{Q_{c}}{W}$ (31)
Figure 4. Thermoelectric cooling system
3.3 Performance analyzing of the thermoelectric personal cooler
The cooler is tested under different numbers of Peltier and different mass flow rates of air passing over the cold side of the Peltier element. The environment conditions were (28, 34, 38 and 43) Celsius and the number of Peltier slides is 8. The TEC is made of lead telluride (PbTe), which occurs naturally in the mineral altaite. The dimensionless figure of merit is a measure of the potential of the material for TEC applications. The higher the figure of merit, the higher the conversion efficiency of electrical to heat as shown in equation below. The figure of merit is calculated as follows [21]:
$Z T=\frac{\alpha^{2} T}{R \cdot K}$ (32)
where:
α: Seebeck coefficient (V/K);
R: electrical resistivity (Ω-m);
K: thermal conductivity (W/m. K);
T: temperature (K).
The properties of PbTe are shown in Table 3.
As it was mentioned before, the performance of the TEC depends on the material of the TEC. The maximum efficiency of the ideal TEC depends mostly on the figure of merit and the absolute temperature. The maximum theoretical efficiency of the TEC is:
$\eta_{\max }=\frac{\left(T_{h}-T_{c}\right)}{T_{h}} \frac{\sqrt{1+Z T}-1}{\sqrt{1+Z T}+\frac{T_{c}}{T_{h}}}$ (33)
where:
T: the average temperature of the hot and cold sides of TEC (K).
The term $\frac{\left(T_{h}-T_{c}\right)}{T_{h}}$ represent the Carnot efficiency of the TEC.
While the Carnot COP is written as:
$COP _{\text {Carnot }}=\frac{T_{C}}{T_{h}-T_{c}}$ (34)
Table 3. The See beck, resistivity and thermal conductivity of PbTe TEC
|
T |
See beck |
Resistivity |
Thermal cond. |
T |
See beck |
Resistivity |
Thermal cond. |
|
(C) |
(µV/K) |
(10-3 Ω cm) |
(W/m K) |
(C) |
(µV/K) |
(10-3 Ω cm) |
(W/m K) |
|
27 |
106 |
0.71 |
2.52 |
302 |
239 |
2.06 |
1.21 |
|
52 |
119 |
0.75 |
2.29 |
327 |
247 |
2.22 |
1.16 |
|
77 |
131 |
0.81 |
2.09 |
352 |
254 |
2.37 |
1.13 |
|
102 |
142 |
0.90 |
1.94 |
377 |
258 |
2.52 |
1.09 |
|
127 |
154 |
1.01 |
1.79 |
402 |
262 |
2.66 |
1.07 |
|
152 |
166 |
1.14 |
1.68 |
427 |
266 |
2.80 |
1.04 |
|
177 |
178 |
1.28 |
1.57 |
452 |
269 |
2.94 |
1.03 |
|
202 |
191 |
1.43 |
1.49 |
477 |
269 |
3.08 |
1.02 |
|
227 |
205 |
1.59 |
1.40 |
502 |
268 |
3.24 |
1.01 |
|
252 |
219 |
1.74 |
1.33 |
527 |
268 |
3.42 |
1.01 |
|
277 |
229 |
1.90 |
1.26 |
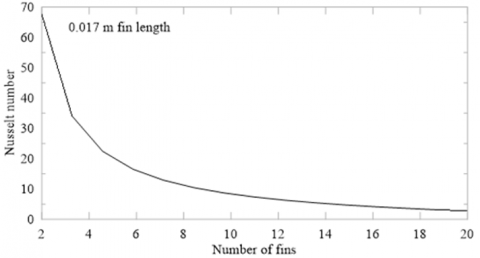
The effect of the fin number on the Nusselt number where the fin length is 0.017 m is shown in Figure 5. It can be seen from the figure that the maximum Nu is for the minimum number of fins. This means that convection heat transfer is dominated. In other words, the heat sink is in the form of a soldered aluminium block and the heat is transferred from the top and the sides of the block. As the number of fins increases, the Nusselt number reduces and allows more heat transfer from the Peltier module by conduction. It can be seen from the figure that the best fin number is 11 when the fin length is 0.017 m.
Figure 6 shows the relationship between Nu and Re numbers. It can be seen from the figure that as the Re number increases, the heat transfer by convection is dominated. Since the Nu number corresponding to the selected fin number is about 10, then the Reynolds number corresponding to the Nusselt value should be dependent on the selection of cold and hot airspeed passing through the heat sink.
Figure 5. Nusselt number Vs. number of fins when the fin length is 0.017 m
To test the effect of fin length on the Nu number of the heat sink when the number of fins is 11, the relationship between the fin length and Nusselt number is drawn as in Figure 7. The figure shows that at a lower fin number, the major heat transfer from the heat sink is by convection. As the fin number increases, the heat transfer by conduction becomes more significant, as well as the thermal resistance of the heat sink decreases.
Figure 8(a) depicts the effect of DC current on the thermal performance of the Peltier module, demonstrating that DC current has a significant effect on the thermal performance of the Peltier module. The best current for the module is about 2.5 A. That gives the maximum cooling capacity of the module. As the current intensity increases, the cooling capacity is degraded. The heating capacity shows a direct relationship with the current since the heat lost represents the entropy generation in the TEC, so as the current intensity increases, the rate of entropy generated also increases.
Figure 8 (b) shows the effect of current intensity on the hot and cold temperatures of the Peltier module. As mentioned in Figure 8, the best current that gives the minimum cold temperature is about 2.5 A. It can be seen from the figure that the cold temperature is in the range of 16 degrees, while the hot temperature takes a wide range of temperatures.
Figure 8(c) depicts the effect of current intensity on the TEC COP and consumed power. It can be seen from the figure that as the current intensity increases, the TEC COP reduces and the power consumption increases. Because the temperature difference between the hot and cold sides is the smallest, the maximum COP is about 1.5 A, as shown in Figure 7(d). As the temperature difference increases, the TEC COP reduces due to the increases in the cooling capacity not being compatible with the increased power consumption. Figure 7(d) shows that the Carnot efficiency increases as the temperature difference increases, which can be taken into account when designing a thermoelectric generator.
Figure 6. The relation between Nu and Re numbers
Figure 7. The effect of fins length on the Nu number when the fins number is 11
Figure 8. The relation between current intensity and cooling and heating capacity of the Peltier module (a), (b) the relation between current intensity and cold and hot temperature on both sides of the Peltier module, (c) the relation between current intensity and TEC COP and the consumed power, and (d) the effect of temperature difference on the Peltier module COP and Carnot efficiency
As mentioned before, those three variables are studied in the experimental work, namely: TEC power, airspeed, and ambient temperature. The main parameter in the current work is the supply cold temperature. For all the supply air temperatures, the supply air relative humidity is in the range of 30 to 50%. Figure 9 shows the comfort zone according to ASHRAE 55-1992 [22]. It can be seen from the figure that the human comfort DBT temperature ranges from 23.5 to 26℃.
The four corners of the summer area are enclosed by the coordinates: 23.5 DBT and 24.4% RH, 22.5 DBT, 79.5% RH, 26 DBT, 57.3% RH, and 27 DBT, 19.8% RH. It was observed that the supply cold air relative humidity for the experimental work is in the range of 30 to 45%, so the acceptable supply air temperature would be 23 to 24.5. Thus, the temperature range mentioned above is the measure of the effectiveness of the coolant.
The study was carried out for TEC capacities ranging from 50 to 400 watts. Based on Figure 9, the capacities of 50 and 100 W were excluded due to their ineffectiveness in achieving human comfort, and then the capacity of 400 W was excluded since the capacity of 350 watts could be replaced in achieving human comfort.
The effect of airspeed on the cold temperature of TEC under different ambient conditions is shown in Figure 10. It can be seen from the figure that as the TEC power increases, the cold temperature decreases, while the cold temperature increases with the increase of the ambient temperature.
The effect of ambient temperature on the cold and hot temperatures at different airspeeds when the TEC power is 350 W is shown in Figure 11. It can be seen from the figure that, for a given capacity of TEC, as the airspeed increases, the cold temperature also increases. This is due to an increase in the mass flow rate of air. The ambient temperature affected the cold temperature negatively. The figure shows that the hot temperature was affected insignificantly by the ambient temperature since the airspeed over the hot Peltier side was kept constant during the experiment.
Figure 12 shows the variation of TEC COP with ambient temperature at different airspeeds when the TEC power is 350 W. It can be seen that all the figures agree that the best COP for all airspeeds is at about 220 W. The figure shows that the maximum TEC COP is at an airspeed of 4 m/s and an ambient temperature of 43℃.
Figure 9. Relative humidity (RH) / temperature (T) diagram based on comfort zone according to ASHRAE 55-1992 [22]
Figure 10. Effect of airspeed on the cold temperature of TEC under different ambient conditions
Figure 11. The effect of ambient temperature on the cold and hot temperature at different airspeed when the TEC power is 350 W
Figure 12. Effect of TEC power on the COP at a different airspeed
To study the effect of ambient temperature on the TEC COP, the relationship between COP and ambient temperature at different airspeeds is shown in Figure 13. The figure shows that the ambient temperature affected the COP positively. This is due to the increase in cooling capacity with increasing ambient temperature. As well as the airspeed improving the TEC COP, the maximum TEC COP is at an airspeed of 4 m/s.
Figure 13. Effect of ambient temperature on the TEC COP at different airspeeds when TEC power is 350 W
The TEC COP and efficiency depend on the cold and hot junction temperatures as well as the figure of merit (ZT). In turn, the figure of merit depends on the physical properties of the thermoelectric chip, such as the electrical conductivity, thermal conductivity, and Seebeck coefficient. Figure 14(a) depicts the relationship between the figure of merit and the ambient temperature for different airspeeds when the TEC power is set to 350 W. can be seen from the figure that, as the ambient temperature increases, the figure of merit also increases. The figure shows a very small variation in the figure of merit due to the ambient temperature.
Figure 14 (b) shows the variation of the figure of merit with the variation of the hot to cold temperature ratio. It can be seen that the increase in hot to cold temperature ratio affected the figure of merit negatively, while the increase in airspeed improved the figure of merit since the increase in air can reduce the hot to cold temperature ratio.
The efficiency of a thermoelectric generator is related to the hot and cold junction temperatures, the figure of merit, and the ambient temperature. The effect of ambient temperature on maximum Peltier efficiency for various airspeeds is depicted in Figure 14(c). It can be seen from the figure that as ambient temperature increases, the maximum efficiency reduces. The maximum efficiency shows an increase with the increase of TEC power.
Figure 15 (d) shows the effect of TEC power on the Peltier maximum efficiency under various airspeeds. The figure shows that as the TEC power increases, so does the difference between the hot and cold junctions, and as it is well known, the Carnot efficiency increases as the difference between the hot and cold reservoirs grows. the increase in airspeed improves the maximum efficiency, since one of the major factors related to the maximum efficiency is the figure of merit, which is in turn improved as the airspeed increases, the figure shows that there is an insignificant improvement in the maximum efficiency when the airspeed increases from 3.5 to 4 m/s since the TEC can remove the heat from the air at 3.5 m/s. To verify the validity of the work, the theoretical and experimental results for selected variables are compared with other works similar to the current work. Figure 8(a) compares the relationship between heating and cooling capacity and current intensity to the work of Barrubeeah et al. [23], which is shown in Figure 15(a). The work of Barrubeeah et al. [23] is for a high capacity Peltier power, so the numerical value of the heating and cooling capacity differs from the results of the current work, but the trend of both curves is the same, as shown in the figure.
The effect of the ambient temperature on the figure of merit shown in Figure 14 (a) is compared with the work of Poudeu et al. [24] that is shown in Figure 15 (b). It can be seen from the figure that although the temperature range of Poudeu et al. [24]'s work is wider than the current work, the trend of the curve with the current temperature limits is the same.
Figure 14. Variation of the figure of merit with ambient temperature (a), (b) Variation of the figure of merit with the variation of hot to cold temperature ratio, (c) Effect of ambient temperature on the maximum Peltier efficiency under different TEC power, and (d) Effect of TEC power on the maximum Peltier efficiency at different airspeeds
Figure 15. Relation between current intensity and cooling and heating capacity of the Peltier module (a), (b) Variation of the figure of merit with ambient temperature
From the work, it can be concluded that:
The maximum Peltier efficiency is affected negatively by the ambient temperature. The maximum efficiency is 0.5% when the TEC power is 350 W, 4 m/s airspeed, and an ambient temperature of 28℃.
[1] Meng, J.H., Wang, X.D., Zhang, X.X. (2013). Transient modeling and dynamic characteristics of thermoelectric cooler. Applied Energy, 108: 340-348. https://doi.org/10.1016/j.apenergy.2013.03.051
[2] Su, S., Chen, X., Wang, J., Chen, J. (2015). Performance evaluation and parametric optimum design of a thermoelectric refrigerator driven by a dye-sensitized solar cell. International Journal of Refrigeration, 60: 62-69. https://doi.org/10.1016/j.ijrefrig.2015.07.035
[3] Yilmazoglu, M.Z. (2016). Experimental and numerical investigation of a prototype thermoelectric heating and cooling unit. Energy and Buildings, 113: 51-60. https://doi.org/10.1016/j.enbuild.2015.12.046
[4] Teffah, K., Zhang, Y., Mou, X.L. (2018). Modeling and experimentation of new thermoelectric cooler–thermoelectric generator module. Energies, 11(3): 576. https://doi.org/10.3390/en11030576
[5] Mainil, A.K., Aziz, A., Akmal, M. (2018). Portable thermoelectric cooler box performance with variation of input power and cooling load. Aceh International Journal of Science and Technology, 7(2): 85-92. https://doi.org/10.13170/aijst.7.2.8722
[6] Kabeel, A.E., Mousa, M.G., Elsayed, M. (2019). Theoretical study of thermoelectric cooling system performance. Journal of Engineering Research, 10-19.
[7] Siahmargoi, M., Rahbar, N., Kargarsharifabad, H., Sadati, S.E., Asadi, A. (2019). An experimental Study on the performance evaluation and thermodynamic Modeling of a thermoelectric cooler combined with two Heatsinks. Scientific Reports, 9(1): 1-11. https://doi.org/10.1038/s41598-019-56672-9
[8] Mirmanto, M., Syahrul, S., Wirdan, Y. (2019). Experimental performances of a thermoelectric cooler box with thermoelectric position variations. Engineering Science and Technology, an International Journal, 22(1): 177-184. https://doi.org/10.1016/j.jestch.2018.09.006
[9] Guzmán, J.J.M., Braga, S.L., Torres, J.C.Z., Beltrán, H. J.D.C. (2020). Solar thermoelectric cooling technology applied to transport of vaccines in isolated communities. In E3S Web of Conferences, 181: 02005. https://doi.org/10.1051/e3sconf/202018102005
[10] Thiangchanta, S., Do, T.A., Tachajapong, W., Mona, Y. (2020). Experimental investigation of the thermoelectric cooling with vacuum wall system. Energy Reports, 6: 1244-1248. https://doi.org/10.1016/j.egyr.2020.11.048
[11] Moazzez, A.F., Najafi, G., Ghobadian, B., Hoseini, S.S. (2020). Numerical simulation and experimental investigation of air cooling system using thermoelectric cooling system. Journal of Thermal Analysis and Calorimetry, 139(4): 2553-2563. https://doi.org/10.1007/s10973-019-08899-x
[12] Ishida, A. (2020). Formula for energy conversion efficiency of thermoelectric generator taking temperature dependent thermoelectric parameters into account. Journal of Applied Physics, 128(13): 135105-135105. https://doi.org/10.1063/5.0018844
[13] Lu, T., Li, Y., Zhang, J., Ning, P., Niu, P. (2020). Cooling and mechanical performance analysis of a trapezoidal thermoelectric cooler with variable cross-section. Energies, 13(22): 1-19. https://doi.org/10.3390/en13226070
[14] Remeli, M.F., Bakaruddin, N.E., Shawal, S., Husin, H., Othman, M.F., Singh, B. (2020). Experimental study of a mini cooler by using Peltier thermoelectric cell. In IOP Conference Series: Materials Science and Engineering, 788(1): 012076-012076. https://doi.org/10.1088/1757-899X/788/1/012076
[15] Albatati, F., Attar, A. (2021). Analytical and experimental study of thermoelectric generator (TEG) system for automotive exhaust waste heat recovery. Energies, 14(1): 204-204. https://doi.org/10.3390/en14010204
[16] Liu, W., Chen, C., Cao, J., Wu, L., Ren, W., Jiao, D., Pei, G. (2021). Experimental study of a novel cool-storage refrigerator with controllable two-phase loop thermosyphon. International Journal of Refrigeration, 129: 32-42. https://doi.org/10.1016/j.ijrefrig.2021.04.009
[17] Teertstra, P., Yovanovich, M.M., Culham, J.R. (2000). Analytical forced convection modeling of plate fin heat sinks. Journal of Electronics Manufacturing, 10(4): 253-261. https://doi.org/10.1142/S0960313100000320
[18] Jiji, L.M., Jiji, L.M. (2006). Heat Convection. New York: Springer, pp. 275-275. ISBN: 978-3-540-30694-8.
[19] Kim, J., Park, K., Lee, D.G., Chang, Y.S., Ho-Young, K. (2018). Optimal cold sink temperature for thermoelectric dehumidifiers. Journal of Mechanical Science and Technology, 32(2): 885-895. https://doi.org/10.1007/s12206-018-0139-8
[20] Jugsujinda, S., Vora-ud, A., Seetawan, T. (2011). Analyzing of thermoelectric refrigerator performance. Procedia Engineering, 8: 154-159. https://doi.org/10.1016/j.proeng.2011.03.028
[21] Brand, O., Fedder, G.K., Hierold, C., Korvink, J.G., Tabata, O. (2017). Thermoelectric Energy Conversion: Basic Concepts and Device Applications. John Wiley & Sons. ISBN: 978-3-527-34071-2.
[22] Olesen, B.W., Brager, G.S. (2004). A better way to predict comfort: The new ASHRAE standard 55-2004. Center for the Built Environment.
[23] Barrubeeah, M., Rady, M., Attar, A., Albatati, F., Abuhabaya, A. (2021). Design, modeling and parametric optimization of thermoelectric cooling systems for high power density electronic devices. International Journal of Low-Carbon Technologies, pp. 20-26. https://escholarship.org/uc/item/2m34683k.
[24] Poudeu, P.F., D'Angelo, J., Downey, A.D., Short, J.L., Hogan, T.P., Kanatzidis, M.G. (2006). High thermoelectric figure of merit and nanostructuring in bulk p-type Na1−xsPbmSbyTem+2†. Angewandte Chemie International Edition, 45(23): 3835-3839. https://doi.org/10.1002/anie.200600865