Hariyanto Hariyanto* | Daniel Parenden | Peter Sahupala | Reinyelda D. Latuheru | Andriyono Andriyono | Nurjanah Yusman | Mustofa | Wahyu Caesarendra | Adam Glowacz
© 2022 IIETA. This article is published by IIETA and is licensed under the CC BY 4.0 license (http://creativecommons.org/licenses/by/4.0/).
OPEN ACCESS
Dye-Sensitized Solar Cells (DSSC) are environmentally friendly and low production cost third-generation solar cells. This study examined the DSSCs energy and exergy analysis fabricated with natural dyes from red fruit using a mixture of conductive glass and TiO2 paste with ethanol, then deposited on the glass surface through the pipette method. The test was conducted in direct sunlight with real-time data measurement using Arduino. The results showed that increasing the solar radiation intensity increased the output and input exergy power and produced higher exergy losses than thermal and electrical exergy. The energy efficiency was smaller, while the exergy was larger, fluctuating from 0.0041% to 0.0077% and 24.21% to 46.97%, respectively. The surface temperature module also greatly influenced the exergy efficiency. However, the generated voltage and power output were affected by the current, not the intensity. These results can be used as a recommendation for applying red fruit as a medium for DSSC absorption.
DSSCs, natural dyes, anthocyanin, titanium dioxide, Arduino, efficiency
Indonesia is a tropical country with abundant solar energy potential because its located astride the equator, where most parts receive sufficient and potential solar radiation intensity [1, 2]. For example, Merauke Regency has potential renewable solar energy source [3], illuminating an average monthly radiation value of 5.38 kWh/m2 with a maximum of 6.43 [4]. The radiation intensity is stable, hence, suitable for solar energy development and utilization as a clean and environmentally friendly energy source [5-7]. Solar energy can be converted directly into electrical using photovoltaic (PV) technology. This semiconductor technology has developed rapidly since the 2000s in investigation and daily life application [8]. It is classified into single silicon PV, multi-crystalline silicon, thin-film solar cells, and Dye-Sensitized Solar (DSSC) and PV Cells [9]. The DSSC technology was introduced by Brian O'Regan and Michael Grätzel in 1991, which has developed rapidly. The various components of photo anode and dye materials are continuously investigated and developed to increase the DSSC efficiency [10]. The main component is the content of dyes (natural dyes) as a medium to absorb photon energy from solar emissions. It is found in trees, flowers, leaves, and fruits of plants with anthocyanins and strong color pigments [11]. Furthermore, the DSSC production cost is categorized into low and affordable.
Merauke Regency has potential natural dyes from the red fruit (Pandanus coneideus), popular in Papua and consumed as food and medicine [12-14]. Many studies fabricated DSSC using natural dyes as absorbent media from fruit extracts [15-18], with a few using the red fruit. The red fruit has a strong and concentrated color pigment, potentially used as a coloring layer on DSSC. Hariyanto et al. [19] processed red fruit into DSSC to determine its characteristics, such as current, voltage, power, and efficiency. However, they failed to show and explain the energy lost from the process.
This lost energy can be determined by developing the energy and exergy concept into the analysis of Second Law of Thermodynamics, determining the missing information from the thermodynamic processes in the PV system [20-22]. The second law of thermodynamics explains that the total entropy of an isolated thermodynamic system increases with time, approaching its maximum value.
The exergy efficiency is the difference between electrical and thermal energy in the maximum thermodynamic system performance during the reversible processes, causing a state of equilibrium with its surroundings [23-25]. The study on energy and exergy analysis in PV with monocrystalline silicon solar cells was experimentally conducted by Rawat et al. [26, 27], which found that the energy efficiency was greater than the exergy. Exergy can identify efficiency gains and thermodynamic loss reductions. Furthermore, it can identify energy and economic benefits from energy technology than analysis. This is similar to Rezky et al. [28-30], which used polycrystalline PV to observe the amount of energy produced and found that the energy efficiency was greater than the exergy.
A good measuring device or instrument is required to produce an energy and exergy analysis on PV for accurate and effective data. The first step for this analysis involves the initial measurement data and parameters. However, the standard and available commercial measuring instruments are expensive, promoting many studies to create cheap and affordable ones.
Several studies utilized the Arduino technology created in 2005 for measuring PV data [31-33], but failed to explain the amount of energy and exergy produced. Therefore, this study analyzed the exergy and energy performance of the DSSC module. This used real time parameters measurements such as intensity, temperature, current, and voltage using Arduino and sensors. This was followed by calculating the amount of power, exergy rate, energy, and efficiency, presenting the results through graphs and tables.
This also contributed to science by explaining the potential of red fruit (Pandanus coneideus) as an absorbent medium for DSSC fabrication. The results will impact the people in Merauke Regency to take advantage of the red fruit as a new renewable energy source.
The structure involved began with an introduction, study motivation, and problems in section 1, while section 2 explained the material and methods, including the basic concepts of energy and exergy and their parameters. Furthermore, it explained the DSSC fabrication stage using red fruit (Pandanus coneideus) and the testing method under direct sunlight using an Arduino board. Section 3 showed the results through graphs and tables with real-time measurement. The last section showed the conclusions and future development of DSSC.
2.1 Exergy and energy analysis
The energy analysis in solar cells is determined by calculating the generated current, voltage, output power, and efficiency. Furthermore, the electrical output power is expressed in the following equation [8, 31]:
$P=V\cdot I$ (1)
where, P, V, and I is the output power (W), voltage (V), and current (A), respectively. The solar cell efficiency is calculated using the following equation:
${{\eta }_{E}}=\frac{V\cdot I}{G\cdot A}$ (2)
where, $G$ is the solar radiation (W/m2) and $A$ is the solar cell surface area (m2). The exergy analysis considers the energy quality or capability. Furthermore, the exergy balance in the solar module is written as [24, 25]:
$E{{x}_{in}}=E{{x}_{out}}+E{{x}_{loss}}$ (3)
where, $E{{x}_{in}}$, $E{{x}_{out}}$, $E{{x}_{loss}}$ is the energy in, out, and loss, respectively. The exergy in the solar cell includes the exergy of the solar radiation intensity expressed by the equation:
$E x_{i n}=G A\left[1-\frac{4}{3}\left(\frac{T_{a}}{T_{s}}\right)+\frac{1}{3}\left(\frac{T_{a}}{T_{s}}\right)^{4}\right]$ (4)
where, ${{T}_{a}}$ is the ambient temperature (K), ${{T}_{s}}$ is the measured temperature (K) when the solar cell surface is exposed to the sun. Furthermore, the external exergy is calculated by the equation:
$E{{x}_{in}}=E{{x}_{th}}+E{{x}_{elec}}$ (5)
where, $E{{x}_{th}}$is thermal exergy and $E{{x}_{elec}}$is electrical. Thermal exergy is the heat loss from the module surface to the environment calculated using the following equation:
$E{{x}_{th}}=Q\left[ 1-\frac{{{T}_{a}}}{{{T}_{m}}} \right]$ (6)
where, $Q$ is the heat released to the environment, namely:
$Q=UA\left( {{T}_{m}}-{{T}_{a}} \right)$ (7)
${{T}_{a}}$ and ${{T}_{m}}$ are the ambient (K) and module temperature (K). The overall module’s heat loss coefficient includes the convection and radiation heat transfer losses calculated using the following equation:
$U={{h}_{conv}}+{{h}_{rad}}$ (8)
The convection heat transfer coefficient is calculated using the following equation:
${{h}_{conv}}=2.8+3.0\text{ }{{V}_{w}}$ (9)
The radiation heat transfer coefficient is calculated by the equation below:
${{h}_{rad}}=\varepsilon \sigma ({{T}_{sky}}+{{T}_{m}})(T_{sky}^{2}+T_{m}^{2})$ (10)
where the effective sky temperature is:
${{T}_{sky}}={{T}_{m}}-6$ (11)
The module temperature is calculated based on the NOCT value, namely:
${{T}_{m}}={{T}_{a}}+(NOCT-20)\cdot \frac{G}{800}$ (12)
2.2 Dye-Sensitized solar cell (Pandanus coneideus)
Dye-sensitized solar cell (DSSC) is the most popular and investigated third-generation solar cell system in all countries. It consists of the dye-sensitized TiO2 and the counter electrode flanking the electrolyte which forms a photo-electrochemical system [32]. Furthermore, its working principle begins with the arrival of photon energy on the cell surface from sunlight, with different energy levels, penetrating into the dye. The dye molecules that receive energy are excited to become electrons that flow through TiO2 and are oxidized again, capturing electrons from redox electrolyte ions and generating electricity. Figure 1 shows the DSSC layer schematic [8, 31]:
The following are the components of DSSC compression and functions of each layer of material [34, 35]:
Figure 1. DSSC layer schematic
Figure 2 shows the red fruit extraction process, where the bunch is creatively squeezed to get juice, while Figure 3 shows the DSSC fabrication results. Only one out of the five samples with the best efficiency were used. The fabricated DSSC component had 6 layers, including transparent conducting layer, TiO2 nano-particles, organic dyes, electrolyte, sealing gaskets, and counter Electrodes.
Figure 2. Red fruit dye absorber
Figure 3. Fabrication DSSC from red fruit
The fabrication was conducted using a conductive glass measuring 20 x 20 x 1.1 mm, with its sides coated with TiO2 paste and deposited by the pipette method on the glass surface. The detailed fabrication process was as follows: 1. Resistance testing of the ITO conductive glass side using a multimeter; 2. The ITO glass side was affixed with tape as a barrier with a distance of ± 3 mm; 3. The TiO2 paste was deposited on the area made on the conductive glass through the pipette method, leveled on the surface; 4. Dye coating using the extracted red fruit juice; 5. The layer was allowed to stand for ± 5 minutes; 6. It was then heated on a hot plate at 350℃; and 7. The DSSC layer was tested for initial current and voltage values using a voltmeter (V) and an ammeter (A).
The DSSC measurements were conducted in direct sunlight starting at 07.00 – 17.00 WIT. Figure 4 shows the circuit and measurement scheme using an Arduino board and sensors. The measurements were displayed on the computer through a USB cable, presented through a curve where each parameter is affected by time. Similar measurement scheme was conducted by Rezky et al. [28, 30], which showed good results.
The measurement process began by assembling all components and sensors, then filling the input data and syntax on the Arduino software. The DSSC set perpendicular to the light source was connected to the measuring instrument, while the data display was connected to a laptop presented in real-time. The DSSC sample measurement process took 700 seconds and the measurement circuit consisted of a computer, Arduino nano, temperature sensor (LM35), light intensity (BH1750), voltage, current (ACS172), and a connecting cable.
Figure 4. Fabrication DSSC from red fruit
3.1 Results of the energy performance
The energy was received by the DSSC in the process of converting solar into electrical energy. It can be determined by calculating the measured intensity, temperature, current, voltage, and generated power [25]. Figure 5 shows the solar intensity measurements presented through a curve. The sunlight intensity was volatile, with the average potential intensity reaching 166.3 W/m2.
The maximum intensity value was 208 W/m2, indicated at the 230th minute or at 10.45 West Indonesian Time (WIT), while the minimum value was 111.9 W/m2 at the 600th minute or 17.00 WIT. These results indicated that the irradiation time affects the intensity value. However, studies with different locations and types of solar cells showed that the average intensity value increased and peaked at 11.00 to 14.00 [26].
Figure 5 shows the intensity and temperature curves. The ambient and DSSC module temperature measurements were marked in purple and blue, respectively. The temperature was influenced by intensity, showing a greater DSCC module value than the ambient. This was in line with Kareem et al. [27], which stated that intensity greatly affects the temperature value. The maximum value of the module temperature was 40.19℃ and the ambient was 35.19℃, with an average of 39.75℃ and 34.75℃, respectively.
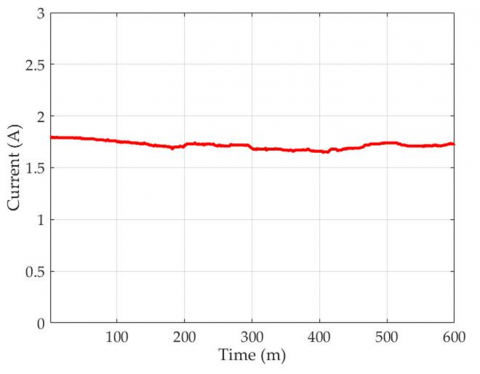
Figure 6 shows the current measurements against time. The current generated by the DSSC was strongly influenced by the intensity, but the intensity value increase was different from the current value. This is due to the DSSC ability to convert photons into electric current. The amount of energy at the surface of the DSSC was absorbed by the dye and converted into electricity, while the resulting voltage remained constant as shown in Figure 7.
Figure 5. DSSC intensity-temperature curve
Figure 6. DSSC current curve
Figure 7. DSSC voltage curve
Figure 8. DSSC power curve
Figure 8 presents the output power, with a maximum value of 0.036 W/m2 at the 230th minute or 10.45 WIT, while the minimum value was 0.033 W/m2 at the 600th minute or 17.00 WIT. The output power of the solar module was influenced by the generated current strength.
3.2 Results of exergy performance
The exergy performance was shown by the magnitude of each input, thermal, electrical, and lost exergy.
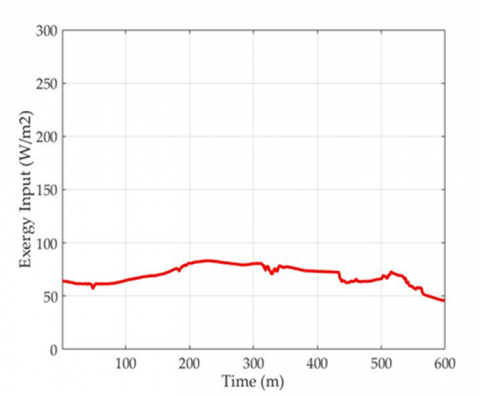
Figure 9. DSSC exergy input curve
Figure 10. DSSC exergy input curve
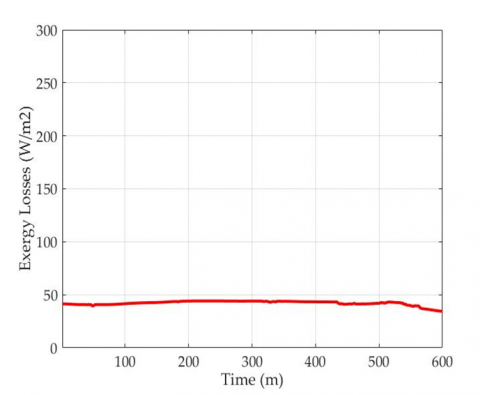
Figure 11. DSSC exergy losses curve
Figure 12. DSSC exergy electricity curve
The exergy value follows the solar radiation intensity, where greater intensity increases the difference between the two [24, 26, 27]. The exergy input in the solar module was extracted into thermal and electrical exergy.
Figure 9 shows the input exergy with maximum, average, and minimum values of 83.20 W/m2, 66.53, and 44.76, respectively.
Figures 10, 11, and 12 shows that the extracted exergy input becomes the maximum thermal and electrical exergy with 39.07 W/m2 and 0.0113 W/m2. There is an unavoidable exergy loss due to the irreversibility of the DSSC module with a value of 44.12 W/m2. The electrical exergy value is smaller due to the DSSC ability to generate current from the fabrication process.
3.3 Efficiency energy and exergy
Figures 13 and 14 present the exergy efficiency and energy generated by the DSSC module. It shows that the energy efficiency fluctuated from ± 0.0041 – 0.0077%. In contrast, the exergy efficiency was larger, ranging from ±24.21% – 46.97%.
The results did not reach the 0.9% efficiency value of commercial DSSC in the market due to several factors, including the conductive glass conductivity, the TiO2 layer surface thickness, and the use of liquid electrolytes. Based on these results and the data, the voltage produced was good but the current was below optimal. This was because of the large DSSC resistance, causing the electrons injected from the dye to experience obstacles, reducing their number. Additionally, the dye function was not optimal in generating and injecting electrons into the electrode layers, and the light sources used affected the process. The intensity also greatly affected the output power of the DSSC, where high intensity increased the number of photons in the conversion process and the current generated.
The unstable output current was caused by several factors, including the particle size, thickness of the TiO2 paste deposited on the conductive glass, the duration of immersion in the dye, and the use of electrolytes [14, 16, 18]. Table 1 shows the DSSC fabricated performance, with each parameter showing the magnitude of the drinking, average, and maximum value.
Figure 13. DSSC efficiency energy curve
Figure 14. DSSC efficiency energy curve
Table 1. Result of performance DSSC
|
Parameter Unit |
Maximum Value |
Average Value |
Minimum Value |
|
Intensity (W/m2) |
208 |
166.3 |
111.9 |
|
Temperature module (℃) |
40.19 |
39.75 |
39.18 |
|
Temperature ambient (℃) |
35.19 |
34.75 |
34.18 |
|
Output current (A) |
1.80 |
1.82 |
1.65 |
|
Output voltage (V) |
0.02 |
0.02 |
0.02 |
|
Output power (W/m2) |
0.036 |
0.034 |
0.033 |
|
Exergy input (W/m2) |
83.20 |
66.53 |
44.76 |
|
Exergy losses (W/m2) |
44.12 |
41.20 |
33.92 |
|
Exergy thermal (W/m2) |
39.07 |
25.30 |
10.82 |
|
Exergy electricity (W/m2) |
0.0113 |
0.0108 |
0.0103 |
|
Efficiency exergy (%) |
46.97 |
36.95 |
24.21 |
|
Efficiency energy (%) |
0.0077 |
0.0053 |
0.0041 |
The results indicated that the DSSC fabrication process was successful. The tests showed that increasing the solar radiation intensity increased the power output and input exergy but produced higher exergy losses than the produced thermal and electrical exergy. The resulting voltage was good and constant, but the current was below optimal and fluctuated. The energy efficiency was smaller and fluctuated from 0.0041% to 0.0077%. On the other hand, the exergy efficiency was larger and fluctuated from 24.21% to 46.97%. The current and voltage greatly affected the output power, including the components in the DSSC layer and the applied light source. The module’s surface temperature largely effected the exergy efficiency but did not affect the energy efficiency. The DSSC energy and exergy values were strongly influenced by the good fabrication results and measurement methods. Furthermore, the results can be a recommendation for using the red fruit as a medium for DSSC absorption and increasing the efficiency through several manufacturing methods such as printing and sprayer.
The authors are grateful to the Universitas Musamus for hosting this study and Nanda Fergiansyah, the head of fundamental electric and measurement in the Mechanical Engineering laboratory, for setting up the experiments. This study was funded by the institute and community service, Universitas Musamus as the organizer of the 2021 UNMUS DIPA.
|
I |
Current, A |
|
V |
Voltage, V |
|
P |
Power, W |
|
A |
Module area, M |
|
G |
Irradiance, W.m-2 |
|
Exin |
Exergy input, W.m-2 |
|
Exout |
Exergy output, W.m-2 |
|
Exloss |
Exergy losses, W.m-2 |
|
Exth |
Exergy thermal, W.m-2 |
|
Exelec |
Exergy Electrical, W.m-2 |
|
Ta |
Temperature ambient, ℃ |
|
Tm |
Temperature module, ℃ |
|
Tsky |
Temperature sky, ℃ |
|
Greek symbols |
|
|
ε |
Emissivity (0,9) |
|
σ |
Stefan Boltzman constant (5.6x10⁻⁸ W.m-2.-K) |
|
Subscripts |
|
|
NOCT |
Nominal Operation Cell Temperature |
|
DSSC |
Dye-Sensitized Solar Cell |
|
PV |
Photovoltaic |
|
m |
minute |
[1] Tambunan, H.B., Hakam D.F., Prahastono, I., Pharmatrisanti, A., Purnomoadi, A.P., Aisyah, S., Wicaksono, Y. (2020). The challenges and opportunities of renewable energy source (RES) penetration in Indonesia: Case study of Java-Bali power system. Energies, 13(22): 01-22. https://doi.org/10.3390/en13225903
[2] Budiyanto, M.A., Lubis, M.H. (2020). Physical reviews of solar radiation models for estimating global solar radiation in Indonesia. Energy Reports 2020, 06(09): 1206-1211. https://doi.org/10.1016/j.egyr.2020.11.053
[3] Hariyanto, H., Parenden, D., Vincēviča-Gaile, Z., Adinurani, P.G. (2020). Potential of new and renewable energy in Merauke regency as the future energy. E3S Web Conference 2020, 190: 00012. https://doi.org/10.1051/e3sconf/202019000012
[4] David, T.M., Rizol, P.M.S.R., Machado, M.A.G., Buccieri, G.P. (2020). Future research tendencies for solar energy management using a bibliometric analysis, 2000-2019. Heliyon, 06(07): 01-10. https://doi.org/10.1016/j.heliyon.2020.e04452
[5] Li, D., King, M., Dooner, M., Guo, S., Wang, J. (2020). Study on the cleaning and cooling of solar photovoltaic panels using compressed airflow. Solar Energy, 221: 433-444. https://doi.org/10.1016/j.solener.2021.04.050
[6] Rabaia, M.K.H., Abdelkareem, M.A., Sayed, E.T., Elsaid, K., Chae, K.J., Wilberforce, T., Olabi, A.G. (2021). Environmental impacts of solar energy systems: A review. Science of Total Environment, 754(141989): 01-19. https://doi.org/10.1016/j.scitotenv.2020.141989
[7] Ziar, H., Manganiello, P., Isabella, O., Zeman, M. (2021). Photovoltatronics: Intelligent PV-based devices for energy and information applications. Energy Environmental Science, 14(01): 106-126. https://doi.org/10.1039/D0EE02491K
[8] Messenger, R.A. (2018). Photovoltaic Systems Engineering, CRC Press, 536.
[9] Kalyanasundaram, K. (2010). DYE-SENSITIZED SOLAR CELLS Fundamental, CRC Press, 621.
[10] Amogne, N.Y., Ayele, D.W., Tsigie, Y.A. (2020). Recent advances in anthocyanin dyes extracted from plants for dye sensitized solar cell. Materials for Renewable and Sustainable Energy, 9(4): 01-16. https://doi.org/10.1007/s40243-020-00183-5
[11] Achadiani, Sastramihardja, H., Akbar, I.B., Hernowo, B.S., Faried, A., Kuwano, H. (2013). Buah Merah (Pandanus conoideus Lam.) from Indonesian herbal medicine induced apoptosis on human cervical cancer cell lines. Obsity Research & Clinical Practice, 07(01): 31-32. https://doi.org/10.1016/j.orcp.2013.08.082
[12] Damayanti, L., Evaangelina, I.A., Laviana, A., Herdiyati, Y., Kurnia, D. (2020). Antibacterial activity of buah merah (pandanus conoideus lam.) against bacterial oral pathogen of streptococcus sanguinis ATCC10556, Streptococcus mutans ATCC 25175, and Enterococcus faecalis ATCC 29212: An in vitro study. The Open Dentistry Journal, 14(01): 113-119. https://doi.org/10.2174/18742106020140113
[13] Heriyanto, Gunawan, I.A., Fujii, R., Maoka, T., Shioi, Y., Kameubun, K.M.B., Limantara, L., Brotosudarmo, T.H.P. (2021). Carotenoid composition in buah merah (Pandanus conoideus Lam.), an indigenous red fruit of the Papua Islands. Journal of Food Composition and Analysis, 96(103722): 01-48. https://doi.org/10.1016/j.jfca.2020.103722
[14] Singh, L.K., Karlo, T., Pandey, A. (2014). Performance of fruit extract of Melastoma malabathricum L. as sensitizer in DSSCs. Spec-trochimica Acta Part A: Molecular and Biomolecular Spectroscopy 2014, 118: 938-943. https://doi.org/10.1016/j.saa.2013.09.075
[15] Al-Alwani, M.A.M., Laudin, N.A., Mohamad, A.B., Kadhum, A.A.H., Sopian, K. (2017). Extraction, preparation and application of pigments from Cordyline fruticosa and Hylocereus polyrhizus as sensitizers for dye-sensitized solar cells. Spectrochimica Acta Part A: Molecular and Biomolecular Spectroscopy, 179: 23-31. https://doi.org/10.1016/j.saa.2017.02.026
[16] Gomesh, N. (2019). Investigation of ‘Keriang’ fruit Dye application on the performance of Dye-Sensitized solar cell with anatase-rutile TiO2 Electrode. IEEE: TENCON 2019 - 2019 IEEE Region 10 Conference (TENCON), Kochi, India.
[17] Erande, K.B., Hawaldar, P.Y., Suryawanshi, S.R., Babar, B.M., Mohite, A.A., Shelke, H.D., Nipane, S.V., Pawar, U.T. (2021). Extraction of natural dye (specifically anthocyanin) from pomegranate fruit source and their subsequent use in DSSC. Materialstoday: Proceedings, 43(04): 2716-2720. https://doi.org/10.1016/j.matpr.2020.06.357
[18] Hariyanto, H., Fergiansyah, N., Rusdi, M., Parenden, D. (2020). Karakteristik Dye Sensitized Solar Cell (DSSC) dari ekstrak sari buah merah (Pandanus Coneideus). Musamus Journal of Electro & Mechanical Engineering 2020, 03(01): 31-39. http://ejournal.unmus.ac.id/index.php/Elektro/article/view/3455.
[19] Jha, P., Das, B., Gupta, R. (2019). Energy and exergy analysis of photovoltaic thermal air collector under climatic condition of north eastern India. Energy Procedia 2019, 158: 1161-1167. https://doi.org/10.1016/j.egypro.2019.01.299
[20] Huang, M., Wang, Y., Li, M., Keovisar, V., Li, X., Kong, D., Yu, Q. (2021). Comparative study on energy and exergy properties of solar photovoltaic/thermal air collector based on amorphous silicon cells. Applied Thermal Engineering, 185(116376): 01-22. https://doi.org/10.1016/j.egypro.2019.01.299
[21] Cheng, S., Zhao, G., Gao, M., Shi, Y., Huang M., Marefati, M. (2021). A new hybrid solar photovoltaic/ phosphoric acid fuel cell and energy storage system; Energy and Exergy performance. International Journal of Hydrogen Energy, 46(11): 8048-8066. https://doi.org/10.1016/j.ijhydene.2020.11.282
[22] Pandey, A.K., Pant, P.C., Sastry, O.S., Kumar, A., Tyagi, S.K. (2015). Energy and exergy performance evaluation of a typical solar photovoltaic module. Thermal Science, 19(02): S625-S636. https://doi.org/10.2298/TSCI130218147P
[23] Aktaş, M., Sözen, A., Tuncer, A.D., Arslan, E., Koşan, M., Çürük, O. (2019). Energy-exergy analysis of a novel multi-pass solar air collector with perforated fins. International Journal Renewble Energy Development, 08(1): 47-55. https://doi.org/10.14710/ijred.8.1.47-55
[24] Hariyanto, H., Parenden, D., Wullur, C.W., Sariman, F. (2021). Exergy modeling of monocrystalline silicon solar cells with spectral irradiation variations. IOP Conference Series Materials Science and Engineering, 1125(1): 012117. http://dx.doi.org/10.1088/1757-899X/1125/1/012117
[25] Sidibba, A., Ndiaye, D., Kobor, D., Bah, M.E., Bouhamady, S. (2018). Energy and exergy analysis of a solar photovoltaic module performance under the Sahelian Environment. International Journal of Physical Sciences, 13(12): 196-205. https://doi.org/10.5897/IJPS2018.4739
[26] Rawat, P. (2018). Exergy performance analysis of 300 W solar photovoltaic module. International Journal of Engineering Sciences & Research Technology, 6(3): 381-390. https://doi.org/10.5281/zenodo.438094
[27] Kareem, F.A., Khalaf, D.Z., Lafta, N.S., Lateef, Y.A. (2019). Energy and exergy analysis of a solar photovoltaic performance in Baghdad. Journal of Mechanical Engineering Research and Developments, 42(2): 44-49. https://doi.org/10.26480/jmerd.02.2019.44.49
[28] Rezky, A., Devara, K., Wardana, N.S., Ramadhanty, S., Abuzairi, T. (2018). Simple method for I-V characterization curve for low power solar cell using arduino nano. The 3rd International Tropical Renewable Energy Conference “Sustainable Development of Tropical Renewable Energy” (i-TREC 2018), Kuta, Bali, Indonesia, September 6-8, 2018.
[29] Hammoumi, A.El., Motahhir, S., Chalh, A., Ghzizal, A.El., Derouich, A. (2018). Low-cost virtual instrumentation of PV panel char-acteristics using Excel and Arduino in comparison with traditional instrumentation. Renewables: Wind, Water, and Solar, 5(1): 01-15. https://doi.org/10.1186/s40807-018-0049-0
[30] Aslam, A., Mehmood, U., Arshad, M.H., Ishfaq, A., Zaheer, J., Khan, A.U.H., Sufyan, M. (2020). Dye-sensitized solar cells (DSSCs) as a potential photovoltaic technology for the self-powered internet of things (IoTs) applications. Solar Energy, 207: 874-892. https://doi.org/10.1016/j.solener.2020.07.029
[31] Parenden, D., Hariyanto. (2019). Simulation of photovoltaic concentration with Fresnel lens using Simulink MATLAB. European Journal of Electrical Engineering, 21(2): 223-227. https://doi.org/10.18280/ejee.210214
[32] Michael, G. (2001). Photoelectrochemical cells. Nature, 414: 338-334. https://doi.org/10.1201/b19148
[33] Kosyachenko, L.A. (2011). Solar Cells – Dye-Sensitized Devices. INTECH Publisher, 2011. https://doi.org/10.5772/1757
[34] Wei, D. (2010). Dye Sensitized Solar Cells, International Journal of Molecular Sciences, 11(3): 1103-1113. https://doi.org/10.3390/ijms11031103
[35] Dahlan, M., Hayat, A., Erwin, A. (2018). Solar cell characterization based on pitaya dyes with conductive glass. International Journal of Scientific & Engineering Research, 9(11): 1552-1558.