Maryam Alaa Abdulhussein | Alaa Liaq Hashem*
© 2021 IIETA. This article is published by IIETA and is licensed under the CC BY 4.0 license (http://creativecommons.org/licenses/by/4.0/).
OPEN ACCESS
The increasing need to provide standard comfort requirements inside buildings has made the construction sector one of the dominant energy consumers and a contributor to greenhouse gas emissions. Improving the thermal insulation efficiency of the building envelope by improving the thermal behaviour of the walls leads to giving an impetus towards reducing energy consumption. In this paper, an experimental embedding of Phase Change Materials (PCM) with perforated bricks wall. For PCM (Paraffin wax) packaging purposes, two configurations are used; capsules were manufactured to fit the size of the holes inside the bricks and a square thin container. Both packages are made from iron and filled with Paraffin (147 kJ/kg latent heat, 38℃ solid phase and 43℃ liquid phase) and closed in a way that prevents leakage. The experiments included constructing a cube-shaped zone from the sandwich panels material with a square hole (0.5m×0.5m) was made in one of its walls to place the test samples in it. The indoor test proceeded with 900W/m2 light intensity applied directly on the sample external surface. Four different samples named C1, C2, C3, and C4 have been used in this study. When compared to a traditional wall C1, the results showed that the heat flow was reduced by 35.7%, 17.4%, and 13.9% for C2, C3, and C4 respectively. All the models that included PCM got a reduction in temperature increases and a slowdown of thermal diffusion. Placing the PCM layer inside the brick holes achieved a maximum reduction in the heat flux compared to the reference model.
phase change material, perforated bricks, energy reduction, walls insulation, thermal performance, PCM packaging
The high energy consumption that occurs in cities causes more than 70% of greenhouse gas emissions [1]. Buildings are major energy users, and by 2035, they will be the fourth-largest source of greenhouse gas emissions [2]. Developing new techniques to store renewable energy and further exploring heating strategies and passive cooling is a primary subject in sustainable building research. Phase change materials (PCM) have become necessary in building materials to maintain an efficient energy performance in buildings [3]. The primary advantage of this material is its ability to store higher energy due to latent heat instead of sensible heat in a constant volume. PCM's are applied to shift the peak-load to the off-peak-load, positively affecting the efficiency of the building.
Various studies have shown that integrating thermal mass into building structures may save 5% to 30% on cooling and heating energy in residential buildings [4]. The first experiment in research using PCM in buildings was conducted in 1948 [5, 6]. Parts of the solar heating system involves using metal containers filled with Glauber's salt in a 135 m² house. It included a solar heating system in which metal containers packaged with Glauber salt were used with a volume of 4 m3 integrated with a well-ventilated glazed front of the sunspace house. The experiment succeeded in heating the space during the heat generated by the passive solar system for two and a half seasons during the winter and cooling it in the summer.
The PCM integrated with building materials was studied numerically and experimentally by Silva et al. [7]. This was done by adding paraffin RT18 with a melting temperature of 18℃ to the typical Portuguese brick and evaluating its effect. Two working models included the construction of a horizontal hollow wall model of mud bricks (30cm×20cm×15cm) with mortar applied to the horizontal and vertical joints. The PCM- capsules have dimensions (30cm×17cm×2.8cm, and 0.75mm in thickness), were integrated into the voids of the middle bricks in one model. The two models have been examined in laboratory conditions for more than 28 days. The achieved a temperature reduction from 10℃ to 5℃, plus diminishing the fluctuation in the indoor space temperature achieved shifting reach to a three hours’ time-delay.
An experimental and numerical investigation used a configuration called PCM thermal shield (PCMTSs) from sandwiching PCM between two layers of covering aluminium foil encapsulating hydrated salt with a phase transition temperature range of 24-34℃ and latent heat was 140 kJ/kg packed in fat polyethylene bubbles by Jin et al. [8]. The experiment was conducted under laboratory conditions using a dynamic wall simulator. From the results, the maximal heat flow attenuation was 41%, with two hours for load shifting. On the other hand, the optimal location was approximately 1/5 of the surface of the heat-exposed layer.
Using composite PCM walls in an experimental room built with dimensions of (3.25m×3.86m×2.91m). The tested model with external conditions over three years, and temperature and thermal performance were monitored [9]. In this experiment, different scenarios were applied: room with AC turned off; room with cooling load in summer, and room with heating load in winter. The findings indicated that PCM walls saved energy by lowering the cooling load by 24.32% in the summer with time delay 1-2h, and lowering the heating load by 10-30% in the winter. Furthermore, this integration reduced surface heat loss by 9-72%, in the case of the room with air conditioning turned off.
Different PCM configurations on building surfaces were introduced and investigated [10]. The two wall models have built according to Iraqi standards, and one of them was treated by adding capsules containing paraffin wax in the outer layer. The dimensions of the wall were (240 mm x 300 mm x 300 mm) and consisted of an outer layer of cement with a thickness of 2 cm, a layer of ordinary bricks with a thickness of 24 cm, and an inner layer of gypsum with a thickness of 2cm. The paraffin wax was encapsulated with aluminium foil, and then an adhesive coating to prevent any leakages covered it. The capsule dimensions are (0.8cm×0.8cm). In the paraffin-wall model, the outer layer consisted of (80% cement and 20% paraffin wax capsules). The walls are insulated so that the energy is exchanged in one direction (the outer and inner surface). These models were exposed to an external heat source using a projector (1000 Watts). The results showed a difference (1.6℃) between treated and untreated walls. The heat flow towards the inner surface has reduced when added PCM due to its ability to store heat.
The effect of PCM phase change temperature range verifying the heat transfer and thermal comfort inside the building's wall was investigated experimentally [11]. The melting point of the PCM was 42-72℃. The results indicated that: choosing the location of the PCM layer near the heat source reduces heat gain and thus determines the rate of increase in the temperature of the interior space. A PCM wall produced a significant delay in the temperature gain compared to the other samples and reduced the zone temperature fluctuation with time. Finally, the maximum heat flux value in the case of the sample without PCM is higher than that with PCM because of its high latent energy.
The novelty of the current work is to study the effect of incorporating PCM components on the thermal behaviour of the perforated bricks wall and their effect on reducing heat gain experimentally. The test procedures are done through the use of:
(1) PCM-capsules located in bricks holes.
(2) PCM-metal containers have located in the middle of the wall as a first case and the outer surface as a second case.
2.1 Model configurations
Cube-shaped structure built using angle shape iron with 110cm ×110cm×110cm dimensions, as shown in Figure (1a).
2.2 PCM packaging
To make suitable packaging for the PCM a cylindrical capsule was made of thin iron shown in Figure (1b). The dimensions of the capsules chosen to be compatible with the dimensions of the holes in the standard perforated bricks used in walls construction in Iraq. So that, the appropriate dimensions would be 8cm high and 2.5cm diameter. A hollow gap was left between the two plates filling with PCM. The dimension of each plate was 15cm×15cm×0.4cm. The PCM was injected into the capsules and plates through a gap designated for that purpose. A thermal silicon glue was applied over the gaps between plates and capsules to prevent leakage.
Figure 1. a) Isolated room model with a solar simulator, and b) PCM cylindrical capsules and thin plate containers
Figure 2. Wall samples included: (a) PCM-capsules Case-2, (b) PCM container inside wall Case-3, and (c) PCM-containers outside wall Case-4
2.3 Wall samples
Four 50cm×50cm dimensions wall samples were built in the isolated frame inside the wall void. The first wall sample represents the traditional wall is composed of three layers: a 2cm layer of cement, followed by two rows of perforated brick, followed by a 2cm layer of cement, the thermal properties are summarized in Table 1 [12]. This wall model is referred to as Case-1 (C1). The second case: first-row perforated bricks were filled with capsules as shown in Figure 2 (a), was referred to as Case-2 (C2). The third case: the thin plate, was placed between the two rows of brick as shown in Figure 2 (b) and was referred to as Case-3 (C3). In the fourth case: the thin plates were fixed on the external surface of the wall as shown in Figure 2 (c) and were referred to as Case-4 (C4).
Table 1. Thermo-physical properties of wall construction materials [12]
|
Materials |
Conductivity (W/m.K) |
Specific heat (J/kg.K) |
Density (kg/m³) |
|
Cement |
0.99 |
2040 |
2020 |
|
Brick |
0.66 |
1060 |
1880 |
|
Mortar |
1.08 |
- |
2050 |
|
Air |
0.026 |
1005 |
1600 |
|
Sand |
0.25 |
800 |
1600 |
2.4 PCM material properties
Paraffin wax, which is referred to as RT-42 was used in this research as a latent heat material as shown in Figure 3. The liquid temperature of the paraffin is 43℃, and the temperature at which the material solidifies is 38℃. With latent heat of the material is 147 kJ/kg. Paraffin wax has a thermal conductivity equal to 0.2 W/m.K. Each capsule carried 30g of Paraffin wax.
In comparison, each plate carried 60g. Other Thermos-physical properties of Paraffin-wax materials used are found in Table 2 [13, 14].
Figure 3. Paraffin wax
Table 2. Thermo-physical properties of Paraffin wax-based on PCM [13, 14]
|
Property |
Values |
|
Melting temperature range |
38-43℃ |
|
Congealing temperature range |
43-37℃ |
|
Heat storage capacity |
174 kJ/kg |
|
Specific heats in both solid and liquid |
2 kJ kg-1.K-1 |
|
Density in solid state |
880 kgm-3 |
|
Density in liquid state |
760 kgm-3 |
|
Volume expansion (solid/liquid phase change) |
16% |
|
Thermal conductivity in both solid and liquid states |
0.2Wm-1 K-1 |
2.5 Experimental setup
The data logger (type AT45xx) used to record temperatures over time come with high-performance ARM microprocessor control. This instrument is small size compact and portable with 16-multi temperature types sensors input. The instrument is set so that temperature readings of the outer surface, the phase-change material layer, and the inner surface are recorded regularly and repeatedly over 10 minutes. Several thermocouple type-K is used for temperature measurement. The schematic diagram of the model and the thermocouple distribution is as shown in Figure 4.
Figure 4. Outline diagram of indoor experimental setup and apparatus connections
3.1 Phase change materials
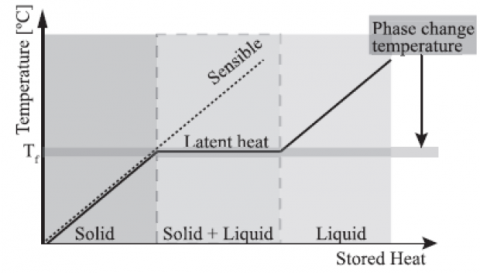
PCM is the material that undergoes solid-liquid phase transformation. The heat subtracted or absorbed in a phase shift process is known as latent heat of melting. The PCM characteristics of latent heat enable them to be an excellent storage material. While when the heat is stored sensibly in the material the temperature rises accordingly as shown in Figure 5 [15].
Figure 5. Sensible and latent heat storage behaviour under the heating process [15]
The main disadvantage when using sensible heat as a method of insulation is the use of large mass (high volume required) to store the heat which results in increasing the temperature. Whereas, latent heat storage materials (PCM), have a high energy storage density that reduces the amount of material used in the building structure and thus the volume. Since the PCM can exist in three states which are solid, mushy, and liquid, the density of the material change accordingly [2, 3].
Eq. (1) calculate the specific heat at these different states of PCM [16]. The term $\rho$ (kg/m3) refers to the density in (Kg/m³), $\mathrm{T}_{\text {liquid }}$ (℃) is the temperature at which the paraffin melting and $\mathrm{T}_{\text {solid }}$ (℃) is the temperature at which paraffin solidifies. The $\lambda$ represents the latent heat in kJ/kg, and:
$\rho C=\left\{\begin{array}{cc}(\rho C)_{\text {solid }} & T<T_{\text {solid }} \\ \frac{(\rho C)_{\text {solid }}+(\rho C)_{\text {liquid }}}{2}+\frac{\rho_{\text {solid }}+\rho_{\text {liquid }}}{2}\left(\frac{\lambda}{\Delta T}\right) & T_{\text {solid }} \leq T \leq T_{\text {liquid }} \\ (\rho C)_{\text {liquid }} & T>T_{\text {liquid }}\end{array}\right\}$ (1)
ΔT=Tliquid-Tsolid (2)
which is equal to 5℃ in the case of paraffin wax RT-42 [13, 14].
3.2 Composite wall
According to Fourier equation, heat flux Q (W) is generated in the wall layers due to the absorbed radiation at the external layer, which is directly proportional to the temperature difference dT, the thermal conductivity k (W/m.℃) of the wall layers, and the wall area A (m2), and inversely with the thickness of the wall x (m) as shown in Eq. (3) [17]:
$Q=-k \times A \times d T / d x$ (3)
When the wall has more than one material, and each material has different thermal conductivity (k), the temperature gradient happens at each layer. Moreover, the multilayer wall is called a composite wall, and the heat flow calculation is slightly different. The overall heat transfer term is used when more than one thermal resistance combines conduction and convection exists. Eq. (4) is the overall heat flow in Watt [17].
$Q=U \times A \times \Delta T$ (4)
Constant radiation of 900 W/m² was directed on the external surface of the wall for four hours, then the wall was left to cool naturally for two hours. Figure 6 shows the comparison of temperature change of the external test wall surfaces with time. After the light source is turned on, the temperature of the external surface rises sensibly and significantly in all cases. The temperature of the C1 continues to rise linearly during the first 30 minutes, reaching 54.02℃. The increase continues but less gradually and slows down with the end of the heating period after 4 hours where the temperature reaches its maximum value of 73.8℃. In all the other cases, the same scenario is observed above where the temperature starts to increase sensibly but at a slower rate compared to the case of a C1. As the heating process continues, the temperature begins to increase at a gradual rate until it reaches its highest values at the end of heating to: 55.42℃, 66.68℃, and 70.66℃, for C2, C3, and C4 respectively. The maximum temperature in all cases was less than the C1 temperature due to the added element of PCM.
After four hours of continuous heating the internal surface temperature of the C1, C2, C3, and C4 walls were at 23.1℃, 20.76℃, 22.06℃, and 24.18℃ respectively. The temperature continues rising even after the heat source was turned off, as shown in Figure 7, because of the stored heat in the wall layers and the time lag. The time lag happens due to the multiple resistance layers of the wall that suppress the travel of heat toward the internal surface lower temperature. After two hours of the cooling period, the internal surface temperature reached its maximum, the C1, C2, C3, and C4 walls' temperatures were equal to 25.96℃, 22.8℃, 24.32℃, and 25.76℃ respectively.
Figure 6. Comparison of exterior wall surface temperatures Tse variation for walls samples
Figure 7. Comparison of interior wall surface temperatures Tsi variation for walls samples
Table 3. Heat flux calculations for different wall configuration
|
Sample |
Tse (℃) |
Tsi (℃) |
ΔT (℃) |
Q (W) |
|
C1 |
73.8 |
23.1 |
50.7 |
33.8 |
|
C2 |
55.42 |
20.76 |
34.66 |
21.7 |
|
C3 |
66.68 |
22.06 |
44.62 |
27.9 |
|
C4 |
70.66 |
24.18 |
46.48 |
29.1 |
Table 3 shows the heat flux calculation generated in the wall layers at the end of the heating period. The highest heat flux was at the C1 and was equal to 33.8 W, while the minimum heat flux was at C2 and was equal to 21.7 W, which is the optimum case. This is due to the absorption and storage of thermal energy during the phase change process, which slows down the temperature increase. The capsules act as effective heat sinks and thus reduce heat gain transmitted through the wall to the interior. On the other hand, the persistence of this process for a longer period compared to the other cases shows that both the configuration and location within the brick holes and wall allows a slow PCM charge proportional to the rate of thermal diffusion inside.
The initial temperature of the C2-R1was reading 19.1℃ as shown in Figure 8. It took one hour and 38 minutes for the PCM temperature to reach 38.1℃. After the heating period of four hours reached to end, the paraffin temperature was equal to 50.6℃ which means that the paraffin of the first row of capsules was melted entirely when the external surface temperature reached its maximum. At the beginning of the experiment, the C2-R2 temperature was equal to 19.9℃. The temperature of the paraffin reached 7.3℃ after four hours of heating which means that the paraffin in all the radiation intensity of Case-2 was still in a solid state when the external temperature reached its maximum. The paraffin reached its maximum temperature of 39.5 at four hours and 41 minutes which the paraffin was partially melted without fully transitioning into the liquid state. After six hours, the temperature reaches 38.42℃.
Figure 8. Comparing the change in temperature of the first-row capsule, and second-row capsule
Figure 9. PCM-plates temperature located in internal wall (C3)
In C3, where the PCM plates were placed between the two rows of bricks in the wall, the paraffin was exposed to non-direct heating. The behaviour of the temperature curves of C3 holds a resemblance to the second row of capsules in C2, as shown in Figure 9. The initial temperature of the paraffin wax was 20.3℃. After four hours of heating, the temperature reached 35.35℃. This means that the paraffin acted as an added sensible resistance without fully utilizing its storage capability. The paraffin was still in a solid-state when the external surface temperature reached its maximum. After four hours and 37 minutes, the paraffin reached 38℃. After six hours, the paraffin temperature was equal to 37.65℃.
The PCM plates were fixed on the outer surface of the wall referred to as C4. Moreover, the PCM took the fastest time to melt due to the direct exposure to the heat source. At the beginning of the experiments, the paraffin temperature was read 21.5℃. It took 7 minutes for paraffin to reach 38.325℃ as shown in Figure 10. After four hours of heating, the paraffin temperature reached 70.2℃ for radiation intensity of 900W/m². Paraffin cools quickly compared to other cases because the PCM metal container is exposed to outside air and has a high rate of heat loss. Thus, the temperature reached 42℃ after 4 hours and 43 minutes. At this point, the process of solidification inside the paraffin began. When the temperature reaches 38℃ after 5 hours 10 minutes, all paraffin becomes solid and heat loss continues sensibly as well. Six hours later, the temperature was equal to 33.95℃. Since the amount of absorbed energy is determined by the complete charging and discharging processes for the PCM, choosing the location of the material very close or in direct contact with the heat source reduces the charging time and keeps the PCM in the liquid phase. Thus, increasing the temperatures significantly. So that, the C4 configuration disagreement with the thermal insulation mechanism using this material, which requires a charging time proportional to the period of thermal load.
Figure 10. PCM-plates temperature as in external wall surface (C4)
In this paper, an experimental study was carried out on parts of traditional perforated bricks wall that contain PCM. The effect of thermal behaviour in the building wall and the effectiveness of PCM in reducing the heat gain inside the space have been investigated. Three wall samples containing PCM were prepared and the fourth sample without PCM was used as a reference. The walls were subject to external heat load. The experimental results show that:
(1) The amount of absorbed energy is determined by the complete charging and discharging processes for the PCM. The location of the material very close or in direct contact with the heat source will reduce the charging time and keep the PCM in the liquid phase as in sample C4.
(2) In sample C3, when the PCM is located far from the heat source, it is still in a solid phase even when the temperature of the external surface has reached a maximum allowing thermal diffusion to continue.
(3) The effective time delay was observed in the C2 sample, where the charging time was more than four hours and succeeded in reducing the heat gain.
(4) The walls with PCM reduce the rising of the temperature because PCM absorbs a greater amount of heat compared to traditional building materials.
(5) The maximum heat flow reduction reached 35.7%, while the maximum energy absorbed was equal to 522kJ.
|
PCM |
Phase change material |
|
C |
Specific heat |
|
C1 |
Case 1 (traditional wall) |
|
C2 |
Case 2 (PCM capsules) |
|
C3 |
Case 3 (PCM plates inside wall) |
|
C4 |
Case 4 (PCM plates outside wall) |
|
R1 |
First raw of PCM-capsules |
|
R2 |
Second row of PCM-capsule |
|
Q |
Heat flux (W) |
|
T |
Temperature (°C) |
|
x |
Thickness (m) |
|
U |
Overall heat transfer coefficient |
|
A |
Area (m²) |
|
R |
Resistance (K.m²/W) |
|
Greek symbols |
|
|
ρ |
Density (kg/m³) |
|
λ |
Latent heat (kJ/kg) |
|
Subscripts |
|
|
se |
External surface of the wall |
|
si |
Internal surface of the wall |
|
liquid |
Liquid phase |
|
solid |
Solid phase |
[1] Ribeiro, H.V., Rybski, D., Kropp, J.P. (2019). Effects of changing population or density on urban carbon dioxide emissions. Nature Communications, 10: 3204. https://doi.org/10.1038/s41467-019-11184-y
[2] Abed, F.M., Al-Douri, Y., Al-Shahery, G.M. (2014). Review on the energy and renewable energy status in Iraq: The outlooks. Renewable and Sustainable Energy Reviews, 39: 816-827. https://doi.org/10.1016/j.rser.2014.07.026
[3] Shukla, N., Fallahi, A., Kosny, J. (2012). Performance characterization of PCM impregnated gypsum board for building applications. Energy Procedia, 30: 370-379. https://doi.org/10.1016/j.egypro.2012.11.044
[4] Fleischer, A.S. (2015). Thermal energy storage using phase change materials: fundamentals and applications. Springer International, Switzerland. https://doi.org/10.1007/978-3-319-14286-9
[5] Telkes, M. (1980). Thermal energy storage in salt hydrates. Solar Energy Materials, 2: 381-393. https://doi.org/10.1016/0165-1633(80)90033-7
[6] Kośny, J. (2015). PCM-Enhanced building components: an application of phase change materials in building envelopes and internal structures. Springer International Publishing, Switzerland. https://doi.org/10.1007/978-3-319-14286-9
[7] Silva, T., Vicente, R., Soares, N., Ferreira, V. (2012). Experimental testing and numerical modelling of masonry wall solution with PCM incorporation: A passive construction solution. Energy and Buildings, 49: 235-245. https://doi.org/10.1016/j.enbuild.2012.02.010
[8] Jin, X., Medina, M.A., Zhang, X.S. (2013). On the importance of the location of PCMs in building walls for enhanced thermal performance. Applied Energy, 106: 72-78. https://doi.org/10.1016/j.apenergy.2012.12.079
[9] Wang, X., Yu, H., Li, L., Zhao, M. (2016). Experimental assessment on the use of phase change materials (PCMs)-bricks in the exterior wall of a full-scale room. Energy Conversion and Management, 120: 81-89. https://doi.org/10.1016/j.enconman.2016.04.065
[10] Labed, O.R., Al-hadithi, M.B., Fadhil, O.T. (2018). Experimental investigation of heat reduction through walls using phase change material. Anbar Journal of Engineering Sciences, 7(3): 245-251.
[11] Khan, R.J., Bhuiyan, M.Z.H., Ahmed, D.H. (2020). Investigation of heat transfer of a building wall in the presence of phase change material (PCM). Energy and Built Environment, 1(2): 199-206. https://doi.org/10.1016/j.enbenv.2020.01.002
[12] Ministry of Construction, Housing and Public Municipalities: https://www.moch.gov.iq/.
[13] Salih, S.M., Jalil, J.M., Najim, S.E. (2019). Experimental and numerical analysis of double-pass solar air heater utilizing multiple capsules PCM. Renewable Energy, 143: 1053-1066. https://doi.org/10.1016/j.renene.2019.05.050
[14] Dukhan, W.A., Dhaidan, N.S., Al-Hattab, T.A. (2020). Experimental investigation of the horizontal double pipe heat exchanger utilized phase change material. In IOP Conference Series: Materials Science and Engineering, 671(1): 012148. https://doi.org/10.1088/1757-899X/671/1/012148
[15] Abuelnuor, A.A., Omara, A.A., Saqr, K.M., Elhag, I.H. (2018). Improving indoor thermal comfort by using phase change materials: A review. International Journal of Energy Research, 42(6): 2084-2103. https://doi.org/10.1002/er.4000
[16] Alawadhi, E.M. (2008). Thermal analysis of a building brick containing phase change material. Energy and Buildings, 40(3): 351-357. https://doi.org/10.1016/j.enbuild.2007.03.001
[17] Jack, P.H. (2010). Heat Transfer, tenth edition, McGraw Hill companies, New York NY, USA.