Tayeb Ouksel* | Abdelaziz Chelghoum | Abdelbaki Mameri
© 2021 IIETA. This article is published by IIETA and is licensed under the CC BY 4.0 license (http://creativecommons.org/licenses/by/4.0/).
OPEN ACCESS
The effect of fuel equivalence ratio Φ on the start of combustion (SOC) and emissions in a homogeneous charge compression ignition (HCCI) engine has been studied using methane CH4 as surrogate of natural gas (NG) fuel. To enable the use of natural gas in HCCI engines, higher compression ratios is required to ensure the auto-ignition. For this purpose, a 0 D multi-zone thermo-kinetic model was adopted with 10 zones using the CHEMKIN-PRO software. Only the closed portion of the cycle (from IVC to EVO) was simulated and no valve event or gas exchange process is considered in this model. The investigation was performed on a four-stroke single cylinder engine running at a fixed speed of 800 rpm. The operating conditions of the engine used in this work were an IVC pressure and temperature of 1.6 bar and 417 K respectively, compression ratio of 18.8:1, with varying fuel equivalence ratio Φ from 0.20 to 0.45 by step of 0.05. Since pressure and temperature profiles plays a very important role in reaction path at certain operating conditions, an attempt had been made here to present a complete reaction path investigation and absolute rate of production (ROP) on the formation/destruction of chemical species at peak temperature and pressure conditions in the first zone #1, middle zone #5 and last zone #10 for Φ = 0.20 and Φ = 0.45.
combustion, CO, CHEMKIN-PRO software, emissions, HCCI, NO, 0D multi-zones model
In an HCCI engine, combustion begins when the density and temperature conditions of the mixture auto-ignition are reached. As the mixture burns in one go, increasing equivalence ratio will results in high pressure, important heat peaks and also a higher risk of rattling. Moreover, most of the viable controls of these engines require the preheating of the mixture, which reduces the density, the mass of mixture in the cylinder and then the developed power. The auto-ignition process in HCCI engine is sensitive to many factors such as the intake air temperature and pressure, EGR level and fuel composition [1, 2]. Many previous studies show that the equivalence ratio has a significant effect on HCCI combustion phasing. The multi-zone simulation done by Amano et al. [3] has also indicated that the zone with the richest air/fuel mixture and the one with highest temperature have the significant impact on the combustion phasing. Furthermore, the in cylinder distribution of the equivalence ratio and temperature affect the pressure rise rate. The parametric studies on equivalence ratio by Babajimopoulos et al. [4], have showed that lower equivalence ratio leads to retarded ignition timing and longer combustion duration. In a multi-zone model coupled with detailed chemistry kinetics. A CFD model coupled with a reduced chemical mechanism is adopted by Noel et al. [5]. The authors compared the in-cylinder pressure curves for different equivalence ratios. Results showed the importance of the equivalence ratio influence on combustion timing and indicated that the HCCI combustion process isn’t efficient for the equivalence ratios lower than 0.3 at fixed intake temperature of 350K. Grenda [6] confirmed that the increase of 0.2 in equivalence ratio advances about 10 crank angle degrees in the start of combustion. Machrafi and Cavadiasa [7] performed a single zone simulations and indicated that the equivalence ratio has a little greater influence on the low-temperature reactions than the main combustion. To investigate parameters affecting natural gas combustion in an HCCI engine. Nobakht et al. [8] developed a 6 zone multi-zone combustion model to. Results showed that the equivalence ratio is the most effective parameters on the combustion phasing and performance of the engine.
Komninous et al. [9] studied the effect of compression ratio (CR) and temperature at IVC on SOC and peak pressure. They obtained that increasing the CR and temperature at IVC leads to earlier SOC and higher peak pressure.
Machrafi and Cavadiasa [7] studied the effect of equivalence ratio (ER) on the combustion of HCCI engine with n-heptane and primary reference fuels using experiments and simulation methods. They found that higher equivalence ratio does not necessarily mean shorter ignition delay which is due to compressive heating effect that reduces gas temperature at compression.
In this study, a 10 zones combustion model are coupled with a detailed chemistry mechanism to simulate an HCCI engine fueled with NG. The model uses the Grimech 3.0 mechanism [10], which involves 325 chemical reactions and 53 species, for describing combustion and determining species chemical production rates. The system of equations solved in the multi-zone HCCI combustion model is based on a fixed mass and variable volume reactor. The effect of the equivalence ratio Φ on the characteristics of SOC, the heat rate release in the HCCI engine and emissions have been investigated.
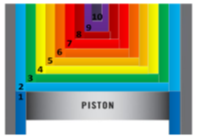
In the multi-zone model, the cylinder volume is divided into ten (10) imaginary zones according to the in-cylinder temperature distribution (Figure 1). The multi-zone model treats each zone as a closed homogeneous reactor, where the zone mass is conserved. Pressure is assumed to be constant for all zones and the total volume of all zones is equal to the instant volume of the cylinder. Heat transfer between zones isn’t considered. The only interaction between zones is through pressure work; if combustion takes place with a zone, it will expand to exert work on the other zones [2].
Figure 1. Schematic of the multi-zone model configuration
The instantaneous cylinder volume is function of the engine geometry and the crank angle degree at which the volume is desired to be calculated, it is given by the slider-crank relation [11]:
$\mathrm{V}_{\text {cylinder }}(\theta)=\mathrm{V}_{\mathrm{c}}\left[1+\frac{\mathbf{r}_{\mathrm{c}}-1}{2} \psi(\theta)\right]$ (1)
where,
$\psi(\theta)=\mathrm{R}+1-\cos (\theta)-\sqrt{\mathrm{R}^{2}-\sin ^{2}(\theta)}$
$R$ is the ratio of the connecting rod length to the crank arm radius, $V_{c}$ is the clearance volume and $\mathrm{r}_{c}$ is the compression ratio. The crank angle $\theta(\mathrm{rad})$, which is function of time is given by:
$\theta=\frac{2 \pi \mathrm{N}}{60} \mathrm{t}$ (2)
with N the engine speed in rpm.
2.1 Heat transfer model
The dominant heat transfer mechanism in the HCCI engine is the forced convection from the bulk gas to combustion chamber walls. The radiation effect is very small because of the low-soothing and the low temperature combustion of the premixed lean mixture in a typical HCCI engine. Among the existing heat transfer models suggested for IC engines, the modified Woschni model [12] is used in this study because of its simplicity and wide acceptance. The empirical constants of the modified Woschni equation adopted in this study have been derived from reference [2], where the modified heat transfer coefficient is given by:
$\mathrm{h}_{\text {new }}(\mathrm{t})=\alpha_{\text {scaling }} \mathrm{L}(\mathrm{t})^{-0.2} \mathrm{P}(\mathrm{t})^{0.8} \mathrm{~T}(\mathrm{t})^{-0.73} \mathrm{v}(\mathrm{t})_{\text {tuned }}^{0.8}$ (3)
where,
$\mathrm{v}(\mathrm{t})_{\text {tuned }}=\mathrm{C}_{1} \overline{\mathrm{S}}_{\mathrm{p}}+\frac{\mathrm{C}_{2}}{6} \frac{\mathrm{v}_{\mathrm{d}} \cdot \mathrm{T}_{\mathrm{r}}}{\mathrm{P}_{\mathrm{r}} \cdot \mathrm{V}_{\mathrm{r}}}\left(\mathrm{P}-P_{\text {motored }}\right)$ (4)
The constant $\mathrm{C}_{1}=\left(\mathrm{C}_{11}+\mathrm{C}_{12} \frac{\mathrm{V}_{\text {swirl }}}{\bar{s}_{\mathrm{p}}}\right)$ and $\bar{S}_{p}$ is the mean piston speed.
In the above formulas $C_{11}, C_{12}$ and $\mathrm{C}_{2}$ are modeling parameters, $V_{\text {swirl }}$ is the swirl velocity, $V_{d}$ is the displacement volume, $\mathrm{P}$ and $P_{\text {motored }}$ are respectively the instantaneous pressure and the corresponding motoring pressure at the same firing condition. $\mathrm{T}_{\mathrm{r}}, \mathrm{P}_{\mathrm{r}}$ and $\mathrm{V}_{\mathrm{r}}$ are respectively the temperature, pressure and volume at the Intake Valve Closing (IVC) moment.
The modified model [2] has three differences from the original Woschni model [12]. The instantaneous chamber height $L(t)$ is used as the characteristic length scale, the temperature exponent is modified to be 0.73 and C2is reduced to the 1/6 of the original value.
2.2 Operating conditions engine specifications
The experimental data are taken from the study [2], the engine specifications are listed in Table 1.
Table 1. Engine parameters used in the model
|
Engine |
Yanmar TS230R single cylinder |
|
Bore |
112 mm |
|
Stroke |
115 mm |
|
Displacement volume |
1.132 Liter |
|
Compression ratio |
18.8:1 |
|
Connecting rod to Crank radius ratio |
3.43 |
|
Intake valve closing (IVC) |
48° CA bBDC |
|
Exhaust valve opening (EVO) |
55° CA aBDC |
|
Fuel surrogate (mole fraction) |
Natural Gas (NG) 90%CH4, 6% C2H6, 4% C3H8 |
Table 2. Zone mass distribution configuration used by the multi-zone model
|
Zone Number |
ZMF |
EHLAF |
|
Zone #1 |
0.02 |
0.05 |
|
Zone #2 |
0.01 |
0.05 |
|
Zone #3 |
0.01 |
0.05 |
|
Zone #4 |
0.01 |
0.10 |
|
Zone #5 |
0.02 |
0.10 |
|
Zone #6 |
0.05 |
0.15 |
|
Zone #7 |
0.10 |
0.15 |
|
Zone #8 |
0.18 |
0.15 |
|
Zone #9 |
0.25 |
0.10 |
|
Zone #10 |
0.35 |
0.10 |
The zone numbering is considered in an ascending order from the combustion chamber wall to the in-cylinder core region (i.e., from zone #1 with the lowest temperature to zone #10 with the highest temperature) (Figure 1).
where, ZMF stands for Zone Mass Fraction and EHLAF External Heat Loss Area Fraction (See Table 2).
$\mathrm{EHLAF}=\frac{\text { Ai }}{\text { At }}=\frac{\text { External Area for Zone } i}{\text { Exposed total cylinder Area }(\theta)}$ (5)
$\mathrm{ZMF}=\frac{m i}{m t}=\frac{\text { zone mass }}{\text { Total mass }}$ (6)
In addition to the data given in the above tables, the Woshni correlations of the average in cylinder gas velocity constants used are C11=2.28, C12=0.308, C2=3.24.10-3, the heat transfer correlation constants are a=0.035, b=0.73, c=0.0, the ratio of the swirl velocity to mean piston speed is 0.5 and the transition crank angle is $\theta_{t}$=25 bTDC.
Computations are achieved for 280 degrees starting at -132º bTDC. IVC temperature and pressure of 417 K and 1.6 bars respectively. The equivalence ratio is varied from 0.2 to 0.45 with a step of 0.05. Finally, the in-cylinder wall temperature is assumed to be constant throughout the cycle $\left(T_{W a l l}=450 \mathrm{~K}\right)$ and the engine speed is 800 rpm.
In a first set of curves, the results are shown in terms of the in-cylinder parameters such as pressure, temperature, net heat release and heat loss. The maximum and the end point of each parameter is plotted against equivalence ratio and time zone average. The second set of curves considers the emissions from the combustion process. The major species CO, CO2 and the minor species OH and NO are considered in function of the equivalence ratio and the time zone average.
3.1 In cylinder parameters variation with equivalence ratio
(a)
(b)
(c)
Figure 2. In-cylinder pressure for zone average (10 zones) vs Φ and time (sec) (a). Pressure zone avg. max point vs Φ. (b) Pressure zone avg. end point (Pa) vs Φ (c)
The Figure 2 shows the variation of the maximum and the end point pressure in function of the equivalence ratio and time zone average. It can be seen from Figures (2.a) and (2.b) that varying the Equivalence Ratio (ER) of the fuel mixture from 0.20 to 0.45, increases the maximum pressure Pmax from 85 bar to 103.5 bar or relatively by 21.76%. Similarly, from Figure (2.c) it can be seen that the increase in ER within the considered limits causes a rise in the pressure of the gas towards the end of the expansion stroke from 1.8 bars to 2.28 bars. This is explained by the fact that the increase in ER causes an increase in the amount of fuel in the mixture, which causes an increase in Pmax and the pressure at the end of expansion stroke.
In the Figure 2 is shown the variation of the maximum and the end point temperature as function of the equivalence ratio and time zone average. From Figures (3.a) and (3.b) it is noticed that by varying the ER of the fuel mixture from 0.20 to 0.45 the maximum average temperature (calculated as the average temperature of the 10 zones) increases from 1840 K to 2280 K (a relative increase of 23.91%). Similarly, from Figure (3.c) it is seen that the increase of the ER within the considered limits causes a rise of the temperature of the gas towards the end of the expansion stroke from 700 K to 890 K. That is explained by the fact that the increase of the ER leads to an increase of the fuel quantity in the mixture, which causes an increase of the quantity of heat released by the combustion of the fuel and consequently an elevation of Tmax and of the temperature at the end of expansion stroke. It should also be noticed that the enrichment of the fuel mixture leads to significant heat losses carried by the exhaust gas.
(a)
(b)
(c)
Figure 3. In-cylinder temperature for zone average (10 zones) vs Φ and time (sec) (a). Temperature zone avg. max point vs Φ (b). Temperature zone avg. end point (Pa) vs Φ (c)
(a)
(b)
Figure 4. Net Heat Release (NHR) per Crank Angle (CA) for average zone (10 zones) vs Φ and time (a). NHR per CA for Avg zone max point vs Φ (b)
The net heat released by combustion process in function of equivalence ratio is depicted by Figure 4. It can be seen from Figure (4.a) that at low ER (0.2 to 0.3), the net rate of heat release is very low. After that the heat release increases rapidly to reach 3.8 KJ/degree for an ER of 0.45. It should also be noted that the enrichment of the fuel mixture from 0.30 to 0.45 generates a relative increase of heat release by about 53.3%.
(a)
(b)
(c)
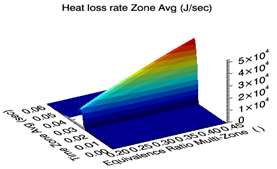
Figure 5. Heat Loss Rate (HLR) for avg. zone (10 zones) vs Φ and time (a). HLR for Avg zone max point vs Φ (b). HLR for Avg zone end point vs Φ (c)
The heat loss rate from the walls in function of the equivalence ratio is shown by Figure 5. It is noticed from Figures 5 (a) and 5 (b) that by varying the ER of the fuel mixture from 0.20 to 0.45, the average gas-wall heat exchange rate increases by 16 (KJ/sec) to 52 (KJ/sec) (a relative increase of 42%). Similarly, from Figure 5(c), it can be seen that the increase in equivalence ratio within the limits considered leads to an increase in this rate from 0.2 (KJ/sec) to 0.3(KJ/sec). This is explained by the fact that the increase in ER leads to an increase in the temperature difference between the gas and the walls. It should be mentioned here that the average temperature of the walls is kept constant at 417 K independently of the ER. In Figure 5(c), the rate of gas-wall heat transfer towards the end of expansion stroke becomes very low, this is because the difference between the gas and wall temperature Tgaz – Twall is very small.
The Figures 6 to 8 show the emissions produced by combustion in function of equivalence ratio and time. The considered species are: The OH species which indicates the reaction strength, the CO is an indicator of the fuel unburnt, the NO species is the most harmful one, the CO2 is a stable species but it is a greenhouse one and finally H2O which is a neutral stable species. The averaged maximum over all zone is plotted against the equivalence ratio and time for each species.
3.2 The OH species formation
(a)
(b)
Figure 6. Mole Fraction (MF) of OH for average zone (10 zones) vs Φ and time (a). MF of OH for Avg zone max point vs Φ (b)
The instantaneous molar fraction of the OH radical in the mean zone and the maximum one during the combustion process are respectively presented in Figures 6 (a) and (b). It can be seen from these figures that, by varying the ER (from 0.20 to 0.45), the maximum molar fraction of OH is reached during the combustion phase and increases in a parabolic way from 0.0002 for Φ = 0.20 up to 0.0022 for Φ = 0.45 (a relative increase of 1000%). Indeed, with the increase in the equivalence ratio, the concentration of methane CH4 increases, which causes according to the reaction (7) an increase in the content of OH radical.
$\mathrm{CH}_{4}+\mathrm{O}=\mathrm{CH}_{3}+\mathrm{OH}$ (7)
The subsequent oxidation of CH3 also leads to the formation of formaldehyde CH2O and OH depending on the reaction (8):
$\mathrm{CH}_{3}+\mathrm{O}_{2}=\mathrm{CH}_{2} \mathrm{O}+\mathrm{OH}$ (8)
The formaldehyde CH2O will then oxidize to give CO2 and H2O. In addition, with the increase in ER, the concentration of ethane $C_{2} H_{6}$ increases, which leads to the formation of the OH radical from the following reaction:
$\mathrm{C}_{2} \mathrm{H}_{6}+\mathrm{O}=\mathrm{C}_{2} \mathrm{H}_{5}+\mathrm{OH}$ (9)
The OH radical also comes from the oxidation of propane $C_{3} H_{8}$ contained in the NG.
$C_{3} H_{8}+O_{ }=C_{3} H_{7}+O H$ (10)
It is noticed that the amount of OH formed from the last 2 reactions is very small because the mole fractions of ethane and propane in the fuel are insignificant (the molar fractions XC2H6=0.06 and XC3H8=0.04).
3.3 The CO species formation
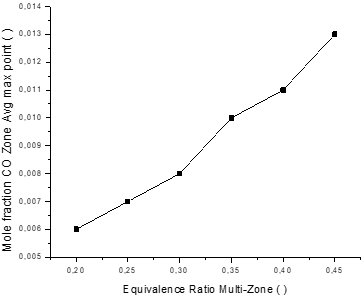
The instantaneous mole fraction of carbon monoxide CO in the middle zone and the maximum one during the combustion process are shown by Figures 7 (a) and (b). It can be noticed that the increase of the equivalence ratio (from 0.20 to 0.45) increases the maximum molar fraction of CO, which is reached during the combustion phase. This maximum increases from 0.006 for Φ = 0.20 to 0.0132 for Φ = 0.45 which represents 120% of augmentation. To understand the mechanisms responsible for the formation and consumption of carbon monoxide CO, the reaction schemes corresponding to the first zones 1, intermediate zone 5 and last zone 10 are shown below when the temperature reaches its maximum value.
Zone 1: The formation of CO in the first zone comes from the oxidation of HCO according to the reaction below:
$\mathrm{HCO}+\mathrm{O}_{2}=\mathrm{HO}_{2}+\mathrm{CO}$ (11)
It is noticed from this reaction that the increase in the equivalence ratio within the limits considered, causes a decrease in the concentration of O2 in the fuel mixture and therefore a decrease in the amount of CO formed. This can be seen from the Rate of Production (ROP) of CO which varies from 9.2 10-13 (mol/cm3sec) for an ER of 0.20 to 3.29 10-14 (mol / cm3sec) for Φ = 0.45. Finally, it is noticed that the maximum temperature of the combustion products in the zone 1 is of the order of 800K and exhibits small variations with ER.
Zone 5: The consumption of CO in the fifth zone is mainly done according to the reaction:
$\mathrm{CO}+\mathrm{OH}=\mathrm{CO}_{2}+\mathrm{H}$ (12)
It should be emphasized that the CO ROP of this reaction is -9.67 10-5 (mol/cm3sec) for an ER of 0.20 and -9.82 10-6 (mol/cm3sec) for Φ= 0.45. Finally, we note that the maximum temperature of the products of combustion in this zone increases as the equivalence ratio increases (Indeed, T5.max (Φ = 0.20) = 1598 K and T5.max (Φ = 0.45) = 2051 K).
The reaction below also contributes to the consumption of CO especially at the ER of 0.45.
$\mathrm{CO}+\mathrm{HO}_{2}=\mathrm{CO}_{2}+\mathrm{OH}$ (13)
Indeed, the ROP of the CO from this reaction is -1.07 10-7 (mol/cm3sec) for an ER of 0.45.
Zone 10: The formation of CO in the last zone comes from the reaction (14):
$N+C O_{2}=N O+C O$ (14)
(a)
(b)
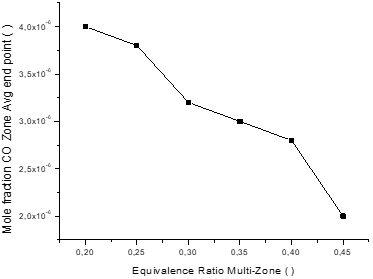
(c)
Figure 7. Mole fraction (MF) of CO for average zone (10 zones) vs Φ and time (a). MF of CO for Avg zone max point vs Φ (b). MF of CO for Avg zone end point vs Φ (c)
Here, it is noted that the ROP of the CO by this reaction is 7.13 10-9 (mol/cm3sec) for an equivalence ratio of 0.20 and is increased to 6.54 10-6 (mol/cm3sec) for Φ = 0.45. At the same time, CO is consumed by the reaction (12).
The CO ROP by this reaction is -3.62.10-8 (mol / cm3.sec) for an ER of 0.20 and it is increased to -1.43 10-5 (mol/cm3.sec) for Φ = 0.45. Finally, it is noticed that the maximum temperature of the products of combustion in this zone increases with ER (T10.max (Φ = 0.20) = 1929 K and T10.max (Φ = 0.30) = 2335 K).
3.4 The formation of NO species
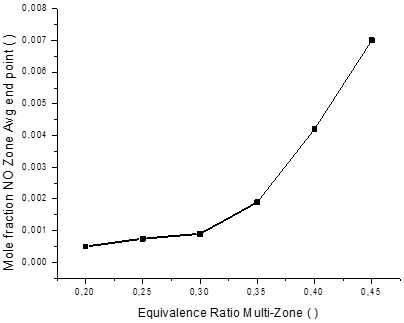
The instantaneous mole fraction of azote monoxide NO in the middle zone and the maximum one during the combustion process are shown respectively in Figures 8 (a) and (b). It can be seen from these figures that, by varying the equivalence ratio (from 0.20 to 0.30), the maximum and final molar fraction of NO is almost zero. While the subsequent enrichment of the fuel mixture (from 0.30 to 0.45) results in an increase of the maximum mole fraction of NO from 400 ppm to 7200 ppm (a relative increase of 1700%) (Figure 8 (b)). Similarly, the increase in the final molar fraction in Figure 8 (c) reached at the end of the expansion stroke is almost zero for ER <= 0.30, it increases to 600 ppm for Φ = 0.30 and to 7000 ppm for Φ = 0.45 (a relative increase of 1067%).
To understand the mechanisms responsible for the formation and consumption of NO, the reaction schemes corresponding to zones 1, 5 and 10 are presented below when the temperature reaches its maximum value.
Zone 1: The formation of the NO in the first zone comes from the oxidation of the atmospheric nitrogen of the air according to the two reactions below:
$O+N_{2}=N+N O$ (15)
$N+O_{2}=O+N O$ (16)
It is noted from these reactions that the increase in the equivalence ratio within the limits considered, causes a decrease in the concentration of O2 in the fuel mixture and therefore a decrease in the amount of NO formed. It can be noted here that the NO ROP by these two reactions is 1.09 10-26 (mol/cm3sec) for an ER of 0.20 and decreases to 1.41 10-28 (mol/cm3sec) for Φ = 0.45. Finally, it is noticed that the maximum temperature of the combustion products in this zone (zone 1) varies little with the ER and is of the order of 800 K. Therefore, the contribution of zone 1 to the formation of NO is negligibly small and it can be considered as null whatever the ER of the fuel mixture.
(a)
(b)
(c)
Figure 8. Mole fraction (MF) of NO for average zone (10 zones) vs Φ and time (a). MF of NO for Avg zone max point vs Φ (b). MF of NO for Avg zone end point vs Φ (c)
Zone 5: The formation of the NO in the fifth zone comes from the oxidation of the atmospheric nitrogen of the air according to the same reactions as zone 1, namely: (15) and (16). It can be noted that the maximum temperature of the products of combustion in this zone (zone 5) increases as the ER increases (Indeed, T5.max (Φ = 0.20) = 1598 K and T5.max (Φ = 0.45) = 2051 K). This leads to an increase in NO with increasing ER, the ROP of NO by the above reactions is 3.38 10-8 (mol/cm3.sec) for Φ = 0.20 and increases to 5.39 10-6 (mol/cm3.sec) for Φ = 0.45. In addition, the angle corresponding to the SOC in the 5th zone increases as the ER increases (see Figure 9).
Additionally, the reaction (17) given below also contributes to the formation of the NO.
$O+N_{2} O=2 N O$ (17)
And which a less important contribution, the reactions (R188), (R189) and (R199) also produce NO species.
$O+\mathrm{NO}_{2}=\mathrm{NO}+\mathrm{O}_{2}$ (18)
$H+\mathrm{NO}_{2}=\mathrm{NO}+\mathrm{OH}$ (19)
$\mathrm{H}+\mathrm{N}_{2} \mathrm{O}=\mathrm{NO}+\mathrm{NH}$ (20)
Zone 10: Also, the formation of the NO in the tenth zone comes from the oxidation of the atmospheric nitrogen of the air according to the same reactions as zone 1, namely: (15) and (16). It is noted that the maximum temperature of the combustion products in this zone (zone 10) increases as the ER increases (Indeed, T10.max (Φ = 0.20) = 1929 K and T10.max (Φ = 0.45) = 2335 K). This leads to an increase in NO with increasing ER. Obviously, the ROP of NO by the above two reactions is 1.8110-6 (mol/cm3.sec) for Φ = 0.20 and increases to 3.39.10-4 (mol / cm3.sec) for Φ = 0.45. Moreover, the angle corresponding to the SOC in the 10th zone increases as the ER increases (see Figure 9). This guarantees that combustion products in this zone have a high temperature retention time, which favors the formation of NO.
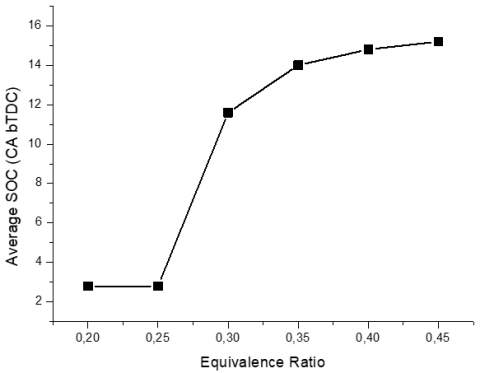
Finally, the start of combustion (SOC) in the different zones and in the average zone according to the ER is presented in Figures 9 and 10. As can be seen, the increase in ER within the limits considered leads to an advance of the beginning of combustion compared to the TDC, this is explained by the fact that the enrichment of the fuel mixture causes the temperature to increase. This results in an advance of the start of combustion.
Figure 9. Zonal - SOC (CA bTDC) vs zone number at different equivalence ratio Φ
Figure 10. Average SOC (CA bTDC) vs equivalence ratio Φ
This paper was dedicated to study the effect of equivalence ratio on the SOC and emissions in an HCCI engine fulled with NG using Chemkin-Pro Multizone code, and the following results were obtained.
|
bTDC |
Befor Top Dead Center, deg |
|
CAD |
Crank Angle Degree |
|
CO2 |
Carbon Dioxide |
|
CO |
Carbon Monoxide |
|
CH4 |
Methane |
|
C2H6 |
Ethane |
|
C3H8 |
Propane |
|
CR |
Compression Ratio |
|
ER |
Equivalence Ratio |
|
EHLAF |
External Heat Loss Area Fraction |
|
EVO |
Exhaust Valve Opening |
|
HCCI |
Homogeneous Charge Compression Ignition |
|
H2O |
Water Vapor |
|
HLR |
Heat Loss Rate, J /sec |
|
IVC |
Intake Valve Closure |
|
$L(t)$ |
Instantaneous chamber Height, m |
|
MF |
Mole Fraction |
|
NG |
Naturel Gaz |
|
NO |
Oxide of Nitrogen |
|
N2 |
Nitrogen Gas |
|
NHR |
Net Heat Release, J /degree |
|
N |
Engine speed, rpm |
|
O2 |
Oxygen Gas |
|
P |
Pressure, Pascal |
|
ROP |
Rate Of Production, mol /cm3 sec |
|
rc |
Compression ratio |
|
SOC |
Start Of Combustion, deg |
|
$\bar{S}_{p}$ |
Mean Piston speed, m / s |
|
TDC |
Top Dead Center |
|
T |
Temperature, K |
|
V |
Volume, m3 |
|
$V_{\text {swirl }}$ |
Swirl velocity, m / s |
|
Vc |
Clearance volume, m3 |
|
ZMF |
Zone Mass Fraction |
|
Greek symbols |
|
|
Φ |
Equivalence ratio |
|
Θ |
Crank angle, deg |
|
Subscripts |
|
|
Avg |
Average |
|
P |
Piston |
[1] Chang, J., Güralp, O., Filipi, Z., Assanis, D., Kuo, T.W., Najt, P., Rask, R. (2004). New heat transfer correlation for an HCCI engine derived from measurements of instantaneous surface heat flux. SAE Transactions, 113: 1576-1593.
[2] Aceves, S.M., Flowers, D.L., Westbrook, C.K., Smith, J. R., Pitz, W., Dibble, R., Johansson, B. (2000). A multi-zone model for prediction of HCCI combustion and emissions. SAE Transactions, 109: 431-441.
[3] Amano, T., Morimoto, S., Kawabata, Y. (2001). Modeling of the effect of air/fuel ratio and temperature distribution on HCCI engines (No. 2001-01-1024). SAE Technical Paper. https://doi.org/10.4271/2001-01-1024
[4] Babajimopoulos, A., Lavoie, G.A., Assanis, D.N. (2003). Modeling HCCI combustion with high levels of residual gas fraction-A comparison of two VVA strategies (No. 2003-01-3220). SAE Technical paper. https://doi.org/10.4271/2003-01-3220
[5] Noel, L., Maroteaux, F., Ahmed, A. (2004). Numerical study of HCCI combustion in diesel engines using reduced chemical kinetics of n-heptane with multidimensional CFD code (No. 2004-01-1909). SAE Technical Paper. https://doi.org/10.4271/2004-01-1909
[6] Grenda, J.M. (2005). Numerical modeling of charge stratification for the combustion control of HCCI engines (No. 2005-01-3722). SAE Technical Paper. https://doi.org/10.4271/2005-01-3722
[7] Machrafi, H., Cavadiasa, S. (2008). An experimental and numerical analysis of the influence of the inlet temperature, equivalence ratio and compression ratio on the HCCI auto-ignition process of Primary Reference Fuels in an engine. Fuel Processing Technology, 89(11): 1218-1226. https://doi.org/10.1016/j.fuproc.2008.05.019
[8] Nobakht, A.Y., Saray, R.K., Rahimi, A. (2011). A parametric study on natural gas fueled HCCI combustion engine using a multi-zone combustion model. Fuel, 90(4): 1508-1514. https://doi.org/10.1016/j.fuel.2010.12.026
[9] Komninos, N.P., Hountalas, D.T., Kouremenos, D.A. (2004). Development of a new multi-zone model for the description of physical processes in HCCI engines (No. 2004-01-0562). SAE Technical Paper. https://doi.org/10.4271/2004-01-0562
[10] Gri-mech http://www.me.berkeley.edu/gri-mech/version30/text30.html, accessed on 13 May 2021.
[11] Heywood, J.B. (2018). Internal Combustion Engine Fundamentals. McGraw-Hill Education. Inc., New York.
[12] Woschni, G. (1967). A universally applicable equation for the instantaneous heat transfer coefficient in the internal combustion engine (No. 670931). SAE Technical paper. https://doi.org/10.4271/670931