Ajay K. Gupta | Manoj Kumar* | Ranjit K. Sahoo | Sunil K. Sarangi
© 2021 IIETA. This article is published by IIETA and is licensed under the CC BY 4.0 license (http://creativecommons.org/licenses/by/4.0/).
OPEN ACCESS
Plate-fin heat exchangers provide a broad range of applications in many cryogenic industries for liquefaction and separation of gasses because of their excellent technical advantages such as high effectiveness, compact size, etc. Correlations are available for the design of a plate-fin heat exchanger, but experimental investigations are few at cryogenic temperature. In the present study, a cryogenic heat exchanger test setup has been designed and fabricated to investigate the performance of plate-fin heat exchanger at cryogenic temperature. Major parameters (Colburn factor, Friction factor, etc.) that affect the performance of plate-fin heat exchangers are provided concisely. The effect of mass flow rate and inlet temperature on the effectiveness and pressure drop of the heat exchanger are investigated. It is observed that with an increase in mass flow rate effectiveness and pressure drop increases. The present setup emphasis the systematic procedure to perform the experiment based on cryogenic operating conditions and represent its uncertainties level.
plate fin heat exchanger, effectiveness, friction factor, cryogenics
Compacts heat exchangers provide a broad range of applications such as aerospace, automobiles, radiators, condensers, evaporators, etc. To enhance the rate of heat transfer, different types of fins (plain, offset, perforated, louver, wavy, etc.) were used in heat exchangers. Starting earlier from 1942, Norris and Spofford [1] had reported the first experimental results on offset strip fin. Three types of offset fins were tested and draw out the effect of heat transfer coefficient, friction factor, and Colburn factor by varying its length, thickness and pitch of fins. Joyner [2] conducted an experimental analysis to measure total heat transfer and pressure drop of five serrated fins of different lengths. The results illustrated the local heat-transfer coefficient, Nusselt number, Reynolds number, and friction factor. Manson [3] predicted the first empirical correlation on which one equation was for heat transfer over the entire range of conditions was proposed. He concluded that the friction factor data was required for a separate correlation below and above the transition Reynolds number (3500). However, the database comprised of different geometries such as louvered fins, finned flat tubes, and offset strip fins. Kays and London [4, 5] carried out the experimental investigations for offset fin geometry in two parts. In the first part, a detailed descriptions of the experiment apparatus and method for test data analysis were provided whereas in the second part the correlation for Colburn factor (j) and friction factor (f) for two different offset strip fins cores were proposed. Later on, the j and f design data of three offset plate-fin was summarized [6].
Further, Kays [7] explored the research on analogous geometry along with six more heat transfer surface that was the first effort for calculating the overall efficiency of the finned passage. Briggs and London presented design data of j and f for eleven compact plate-fin surfaces (five surfaces for offset rectangular-fin type and six for plain triangular-fin type) [8, 9]. The cores were made of aluminum and the rest part were of an alloy of stainless steel and nickel that was suitable for high-temperature applications. London and Shah [10] extended the work on heat transfer and flowed friction design data of nine offset rectangular plate-fin surfaces two of them was made up of stainless steel. Voronin and Dubrovsky [11] developed a correlation for friction factor and Nusselt number. They found that the flow separation due to interruption played a significant role. Wieting [12] set up the statistical relationship between the variable from earlier experimental heat transfer and flow friction data of an offset fin for the plate-fin heat exchanger. By using these statistical relationship, untested offset fin geometries can be predicted realistically and accurately within the parametric range of previously tested data. The connection between the various data based on information collected from 22 balance-offset fins and provided the correlation for both the range laminar and turbulent regions furthermore created connections for discriminating Reynolds number. Mochizuki and Yagi [13] experimentally analyzed the optimized value of fin length. The study demonstrated the optimized value of the fin length for better performance of heat exchanger (seven aluminum fin cores).
Sparrow and Hajiloo [14] demonstrated the uses of the naphthalene sublimation technique to achieve the heat transfer effects via the heat and mass transfer analogy on the flow over serrated offset strip fins. Webb and Joshi [15, 16] presented experimental study on the friction factor data for the offset strip fin matrix with no burred fin edge and suggested that the burrs have not provided so much effect on the heat transfer rate of the heat exchanger. Kays and London [9] compiled the previously reported data of twenty-one offset fin to develop a correlation. Joshi and Webb [17] developed an analytical model to correlate the j and f factors related to the waking region in boundary layer separation of the fins. The offset fin arrays were used to anticipate the wake during the transition areas from laminar to turbulent flows.
The equation of Reynolds number for the wake width, i.e., the transition Reynolds number, was formulated and then j and f factors correlations for the laminar and turbulent flow were proposed to visualize the flow patterns in the fin wake to analyze the stress on transition. Mochizuki et al. [18] presented the graphical representation of j and f data and its correlation for offset plate-fin. They found that offset configuration provides a better result in comparison to slotted and plain straight fins. Dubrovsky and Vasiliev [19] developed a correlation to determine the Nusselt number, coefficient of friction, pressure loss, Reynolds number, and the fin geometrical parameters from eleven interrupted surface. The Reynolds number was varied in the range of 500 to 10000 during the process using air as working fluid. Brackmeier et al. [20] proposed the best execution qualities by using a vortex generator surface on permitting a decrease in heat transfer surface area of about 76% without altered its pumping power and heat capacity. He suggested that it was beneficial to reduce the obligatory heat transfer zone to dismiss capital expenses. Dubrovsky [21, 22] analyzed the result of precise exploratory examinations into the rational improvement of convective heat transfer in the passages of the plate-fin heat exchanger. A laminar stream of Reynolds number 550–1100, which was done in this study, made it conceivable to reach inferences that are imperative in a pragmatic admiration.
Manglik and Bergles [23] selected an experimental data of 18 offset plate-fin surfaces from Kays and London [9], London and Shah [10], and Waiters [24]. The investigation concluded the impact of the non-dimensional constraints on the performance of a heat exchanger. They analyzed the warm pressure-driven relationships and distinguished the asymptotic conduct in the laminar and turbulent flow regime. The usage of plate-fin heat exchanger of offset, rectangular fin in the solar air collector was proposed by Youcef-Ali [25]. It enhanced the heat transfer between the fluid and the absorber plate, which intensified the performance of solar collector thermally as compared to the conventional flat plate solar collector. Youcef-Ali and Desmons [26] worked on plate collector and predicted the results by developing a mathematical model. Peng et al. [27] experimentally examined fins with the different air streams and a consistent vapor flow over a range of Reynolds number (500-5000). Dong et al. [28] developed a correlation based on the experimental datasets and regression analysis. To find the thermal-hydraulic performance of the offset strip fin NTU approach was used. Dong et al. [29] provided the design procedure for heat exchangers and plotted the graph between coefficients of heat transfer versus the pumping power per unit frontal area. Most of the research work performed using air as working fluid; very few works were performed using the liquid as coolants in offset Plate fin heat exchanger to visualize its performance. A comparative investigation had been done in the area of liquid-cooled modules. For improved thermal management and heat transfer coefficients, liquid cooling is considered in this review. An experimental test was performed by Robertson [30] using liquid nitrogen on offset fin at 80 K with Prandtl number of 24. They added a relationship; that the boiling heat transfer coefficient works out as a function of local mass and the inlet Reynolds number.
Robertson [31] carried out very similar boiling characteristics for the same test section, with Freon-11 as a test fluid under comparable flow conditions. At low Reynolds number in both water and air streams on the plate were tried by Roadman and Loehrkeon [32]. Brinkmann et al. [33] performed an experiment on heat transfer effect on four types of offset strip fin, using dielectric fluorocarbon with liquid coolant water. For that, the Prandtl number was selected in the range of 6 to 25. Hou [34] conducted the experimental study of 80 rows of fins for different set of Prandtl number (7 to 70) and Reynold number (30 to 2,700). The test results indicate that the Colburn and flow friction factors are different for various types of fluids. Marr [35] recommended that by adjusting the correlations of air-cooled, heat transfer to a single-phase the aspect Prandtl numbers can estimate liquid at the liquid temperature and surface temperature. Tinaut et al. [36] showed a validated correlation to estimate the heat transfer and flow friction coefficients of a water-cooled engine oil compact heat exchanger. Levasseur [37] have done the assessment of transferring maximum surface temperature using water flow through an SEM-E electronic module. The work reported the effects of Prandtl number on the heat exchanger, but the effect of Prandtl number did not adequately define because of the restricted nature of the offset fin.
Hu and Herold [38] showed the significant effect of Prandtl number on the Nusselt number for liquid coolants (poly alpha-olefin and water) on offset fins compact heat exchanger. The heat transfer and pressure drop inside the heat exchanger had been investigated for the Prandtl number variation in the range of 3 to 150. Herold et al. [39] identified the effect on performance of a heat exchanger for high Prandtl number fluids. He demonstrated that the Colburn factor increased by increasing Prandtl number without more changes in Fanning friction.
Dejong and Jacobi [40] conducted the comparison of two different geometry offset strip and louvered fin. The effect of mass transfer phenomenon, friction factor on vortex flow were carried out. It was concluded that the higher heat transfer and pressure drop were obtained from louvered fin. However, offset strip fins might remain impartial appropriate if the overall heat exchanger efficiency is essential. Peng and Ling [41, 42] performed a series of experimental studies of flow over offset strip fins using oil as functioning fluid at low Reynolds number. Alur [43] represented a preliminary set to show the significant heat transfer process, and pressure drop in between liquid-liquid plate-fin heat exchanger of titanium brazed offset strip fins. The correlation was also developed to define the single-phase convection heat transfer coefficients to the Reynolds number as a function that validates with another experimental research. In contrast to the above work, a comparable solution presented by flowing helium as working fluid by Jiang et al. [44] and compare j and f factor with existing data. Kumar et al. [45] conducted an experimental investigation of solidification and remelting of a brine solution over a cryocooled sphere. Kumar et al. carried out the experimental analysis to understand the performance of plate-fin heat exchangers at different cryogenic operating conditions [46-48].
The paper aims to develop an experimental setup and to yield the data to appraise the performance response of a counter flow offset plate-fin heat exchanger using cold test analysis at cryogenic temperature. A corresponding simulation has been conducted using ASPEN MUSE to confirm the validity of the experimental data within an acceptable margin of error. The experiment is performed to obtain the heat exchanger performance of a specified heat exchanger under steady-state conditions.
The heat transfer performance of the plate-fin heat exchanger has been investigated at a different mass flow rate and operating temperature using nitrogen. The cryogenic temperature has been achieved by a plate-fin heat exchanger. The inlet of the cold side is made of coil type heat exchanger which is dipped inside a nitrogen bath. The change in temperature on the four sides of the heat exchanger is noted using ADAM module through RTD’s. Manometers are provided to observe the differences in the pressure between the high and low-pressure side and also for calculating mass flow rate using the orifice plate. The experimental datasets have been recorded and for the validation of simulated results from Aspen software. Also, the present results are validated with different correlations of the literature. Finally, effectiveness of the heat exchanger has been observed from the uncertainty analysis of the test rig. The application of the present article reaches the other researcher, to perform an experimental test on different types of heat exchangers at cryogenic temperature.
The plate-fin heat exchanger is first designed by using the available correlations in the open literature. In the present investigation, three significant correlations have been taken into consideration, such as Joshi and Webb [17], Manglik and Bergles [23], Gupta et al. [49]. The Coburn factor and friction factor are two important non-dimensional parameters to designate the performance of heat exchangers. The correlations of various models are presented in Tables 1, 2, and 3 respectively for Maiti and Sarangi [46], Manglik and Bergles [23], Joshi and Webb [17]. The equations have been solved in MATLAB environment.
Maiti and Sarangi correlations [46]:
$j=0.36{{(\operatorname{Re})}^{-0.51}}{{(h/s)}^{0.275}}{{(l/s)}^{-0.27}}{{(t/s)}^{-0.063}}$ (1)
$f=4.67{{(\operatorname{Re})}^{-0.70}}{{(h/s)}^{0.196}}{{(l/s)}^{-0.181}}{{(t/s)}^{-0.104}}$ (2)
$j=0.18{{(\operatorname{Re})}^{-0.42}}{{(h/s)}^{0.288}}{{(l/s)}^{-0.184}}{{(t/s)}^{-0.05}}$ (3)
$f=0.32{{(\operatorname{Re})}^{-0.286}}{{(h/s)}^{0.221}}{{(l/s)}^{-0.185}}{{(t/s)}^{-0.023}}$ (4)
$\operatorname{Re}*=648.23{{(h/s)}^{-0.06}}{{(l/s)}^{0.1}}{{(t/s)}^{-0.196}}$ (5)
$\operatorname{Re}*=648.23{{(h/s)}^{-0.06}}{{(l/s)}^{0.1}}{{(t/s)}^{-0.196}}$ (6)
Manglik and Bergles correlation [23]:
$j=\text{ }0.6522\text{ }{{\operatorname{Re}}^{-0.5403}}\text{ }{{\alpha }^{-0.1541}}{{\delta }^{0.1499}}\gamma {{\text{ }}^{-0.0678}}$ (7)
$j=\text{ }0.2435\text{ }\operatorname{Re}{{\text{ }}^{-0.4063}}\text{ }{{\alpha }^{-0.1037}}{{\delta }^{0.1955}}\gamma {{\text{ }}^{-0.1733}}$ (8)
$f=4.67{{(\operatorname{Re})}^{-0.70}}{{(h/s)}^{0.196}}{{(l/s)}^{-0.181}}{{(t/s)}^{-0.104}}$ (9)
$f\text{ }=\text{ }1.8699\text{ }\operatorname{Re}{{\text{ }}^{-\text{ }0.2993}}\text{ }{{\alpha }^{-\text{ }0.0936}}{{\delta }^{0.6820}}\gamma {{\text{ }}^{-\text{ }0.2423}}$ (10)
${{\operatorname{Re}}^{*}}=257{{\left( \frac{l}{s} \right)}^{1.23}}{{\left( \frac{t}{l} \right)}^{0.58}}{{D}_{h}}{{\left[ t+1.328{{\left( \frac{\operatorname{Re}}{l{{D}_{h}}} \right)}^{-0.5}} \right]}^{-1}}$ (11)
Joshi and Webb correlation [17]:
$j=0.53{{\operatorname{Re}}^{-0.5}}{{(l/{{D}_{h}})}^{-0.15}}{{\alpha }^{-0.14}}$ (12)
$j=0.21{{\operatorname{Re}}^{-0.40}}{{(l/{{D}_{h}})}^{-0.24}}{{(t/{{D}_{h}})}^{0.02}}$ (13)
$f=8.12{{\operatorname{Re}}^{-0.74}}{{(l/{{D}_{h}})}^{-0.41}}{{\alpha }^{-0.02}}$ (14)
$f=1.12{{\operatorname{Re}}^{-0.36}}{{(l/{{D}_{h}})}^{-0.65}}{{(t/{{D}_{h}})}^{0.17}}$ (15)
${{\operatorname{Re}}^{*}}=257{{\left( \frac{l}{s} \right)}^{1.23}}{{\left( \frac{t}{l} \right)}^{0.58}}{{D}_{h}}{{\left[ t+1.328{{\left( \frac{\operatorname{Re}}{l{{D}_{h}}} \right)}^{-0.5}} \right]}^{-1}}$ (16)
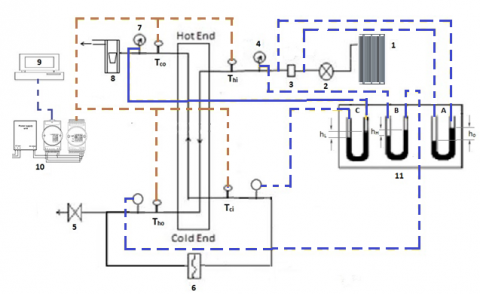
Figure 1 represents the schematic diagram of the experimental setup. The experimental setup comprises of counter flow offset plate-fin heat exchanger as a test piece along with another component whose details are described below:
The pressurized nitrogen gas from the liquid nitrogen storage tank through the vaporizer is made to pass through the plate-fin heat exchanger on the high-pressure side and is chilled with the help of chiller and passages again to the low-pressure side. The mass flow rate for both the side is set to be the same and constant for a single set of analysis. Proper measurements of outlet and inlet temperature and pressure are measured when the steady state condition is reached. The same procedure is repeated for different mass flow rates.
The pressurized nitrogen is used as a working fluid from the vaporizer; that is collected in the reservoir tank. Nitrogen gas supplies to the test system is highly pure to avoid the fouling factor. The control valve has been used to manage the mass flow rate of the working fluid.
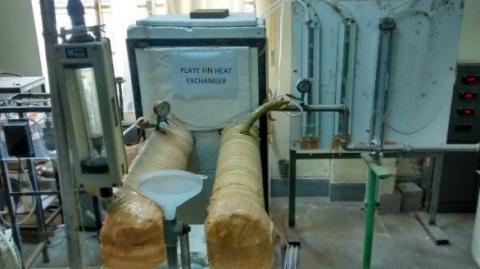
The gas enters the high-pressure entry side of the heat exchanger and comes out from the high-pressure exit side and then it is allowed to pass through the chiller unit. The chiller unit is comprised of the cryogenic vessel (wide neck Dewar) in which a coil type heat exchanger is dipped in the liquid nitrogen bath in which the temperature of nitrogen gas decreases. At that point, the chilled gas is directed back to the heat exchanger through the low-pressure section side of the heat exchanger where it exchanges the heat from high temperature to the low temperature, which can be realized by visualizing Figure 2 (during the commissioning process of experimental test plant). After that, the air comes out from the heat exchanger through the low-pressure exit side of the heat exchanger. In the earlier investigation, we observed that there is a variation in the calculated correlated value and experimental value; this may be due to heat leak. Therefore, the insulation of perlite powder (grade 45) and nitrile rubber is added to the flow pipe as shown in Figure 3.
Figure 1. Schematic “Process Flow & Instrumentation” diagram of the experimental test rig (1: Vaporizer, 2: Control Valve, 3: Orifice, 4: Inlet Pressure Indicator, 5: Bypass valve, 6: Chiller Unit (Sub cooler), 7: Outlet Pressure Indicator, 8: Rotameter, 9: Monitor, 10: ADAM View, 11: Manometer’s)
Thi, Tho, Tci, Tco: PT100 Resistance Temperature Detectors (RTD’s).
Figure 2. Images of experimental setup during commissioning
Figure 3. Image of final experimental setup
4.1 Effectiveness of plate-fin heat exchanger at different mass flow rate
Effectiveness is one of the measure parameter to test out the thermal performance of a heat exchanger. Effectiveness defines as the actual rate of heat transfer to that of the maximum rate of heat transfer. The highest rate of heat transfer means to insist on one inlet temperature of the fluid to reach up to the other inlet temperature of another fluid. The tendency of doing so causes the increment in heat exchanger effectiveness. Statistically the value of heat exchanger effectiveness lies between 0 to 1. Ideally, the heat loss by the one stream (hot stream) must gain by the other fluid (cold stream), but there is always heat loss due to heat imbalance that occurred during the experiment even after maintaining perfect insulation. Hence, the loss of energy in the form of heat developed the differences in the effectiveness of both sides of the heat exchanger, i.e., εh and εc respectively. To achieve a more efficient heat exchanger, the effectiveness should approach one.
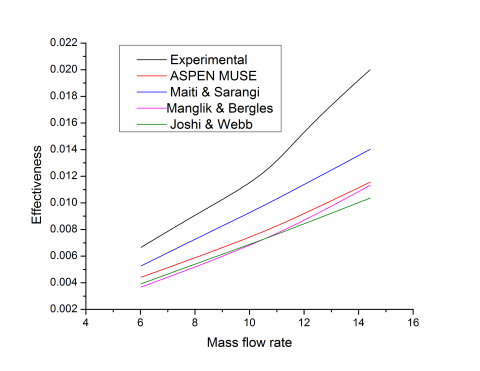
The Effectiveness of a plate-fin heat exchanger for different mass flow rates at various inlet temperatures is represented by in Figure 4. Volumetric flow rate of Nitrogen varies from 300 liters/min to 650 liters/min for both hot and cold sides. The effect of the mass flow rate on the effectiveness of the heat exchanger is illustrated. It is observed that the effectiveness of a given heat exchanger increases with the increase of mass flow rate. The increment in the flow rate causes the turbulence in the flow due to which the interaction of fluid stream with the fins increases. It does not allow the heat to be accumulated in one place in the heat exchanger. Although, the flow boundary layers are laminar, the wake effect due to the offset fins the flow behaves as turbulent flow in these regions. The flow rate enhances the performance of the heat exchanger up to a certain extent by increasing the heat transfer rate. Table 1 represents the test data for a range of mass flow rates at cold inlet temperature.
Table 1. Test data for a range of mass flow rate at cold inlet temperature of 107 K
|
300 |
0.05 |
0.037 |
5 |
5 |
307.5 |
128.2 |
107.8 |
281.5 |
|
400 |
0.09 |
0.059 |
7 |
6 |
307.4 |
127.0 |
106.7 |
282.1 |
|
500 |
0.14 |
0.089 |
9 |
8 |
307.4 |
124.6 |
106.1 |
282.5 |
|
550 |
0.16 |
0.097 |
11 |
10 |
308.1 |
124.8 |
106.8 |
283.1 |
|
600 |
0.18 |
0.119 |
13 |
12 |
307.9 |
125.2 |
107.8 |
282.6 |
|
650 |
0.20 |
0.147 |
15 |
14 |
308.2 |
125.0 |
108.1 |
282.6 |
|
Mass flow rate (Lt/min) |
Hot inlet Pressure |
Cold inlet pressure |
Pressure drop Hot Inlet |
Pressure drop Cold Inlet |
Hot Inlet Temperature |
Hot Outlet Temperature |
Cold Inlet Temperature |
Cold Outlet Temperature |
Table 2. Compared error percentage of correlations, MUSE with experiment
|
Mass flow rate (kg/s) |
Error Percentage (%) |
|||
|
Maity and Sarangi |
Manglik and Bergles |
Joshi and Webb |
Muse |
|
|
6.029 |
3.94 |
2.72 |
4.76 |
1.73 |
|
8.201 |
4.05 |
2.63 |
5.03 |
1.77 |
|
10.52 |
3.60 |
1.87 |
4.62 |
1.76 |
|
11.68 |
3.53 |
1.67 |
4.57 |
1.75 |
|
12.98 |
3.51 |
1.50 |
4.56 |
1.75 |
|
14.41 |
3.43 |
1.27 |
4.50 |
1.75 |
Table 3. Uncertainty assessment in the effectiveness in different mass flow rate at 107 K
|
6.02 |
307.5 |
128.2 |
107.8 |
281.5 |
144.29 |
0.000243 |
0.004356 |
0.005008 |
0.004495 |
0.049501 |
|
8.20 |
307.4 |
127.0 |
106.7 |
282.1 |
106.60 |
0.000248 |
0.004356 |
0.004983 |
0.004478 |
0.037323 |
|
10.52 |
307.4 |
124.6 |
106.1 |
282.5 |
83.26 |
0.000255 |
0.004355 |
0.004968 |
0.004511 |
0.029982 |
|
11.68 |
308.1 |
124.8 |
106.8 |
283.1 |
74.97 |
0.000256 |
0.004351 |
0.004968 |
0.004523 |
0.027172 |
|
12.98 |
307.9 |
125.2 |
107.8 |
282.6 |
67.33 |
0.000262 |
0.004368 |
0.004998 |
0.004561 |
0.024935 |
|
14.41 |
308.2 |
125.0 |
108.1 |
282.6 |
60.48 |
0.000268 |
0.004359 |
0.004998 |
0.004573 |
0.022947 |
|
g/s |
Th,i |
Th,o |
Tc,i |
Tc,o |
$\frac{\delta \eta}{\delta m_{1}}=\frac{\delta \eta}{\delta m_{2}}$ |
$\delta \mathrm{m}_{1}$ |
$\frac{\delta \eta}{\delta \mathrm{T}_{1}}$ |
$\frac{\delta \eta}{\delta T_{2}}$ |
$\frac{\delta \eta}{\delta \mathrm{T}_{3}}$ |
$\delta \eta$ |
4.2 Heat exchanger effectiveness at different mass flow rates
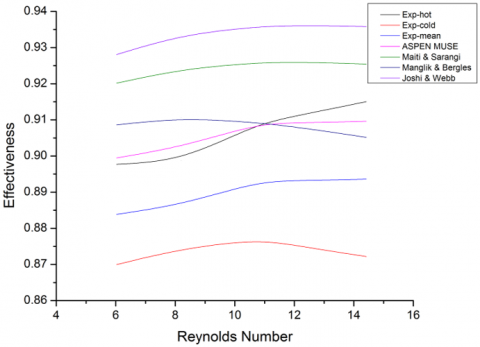
Figure 4 shows the variation between experimental data and simulation and predicted results from different correlations. The variation in the mean experimental value with simulated and analytical value is due to the error or uncertainty of which equations. The change in mean experimental value with the multiple correlation results because of uncertainty and the leakage of heat to the surrounding, considering the effect of longitudinal heat conduction. On the other hand, the variation between the mean experimental value and the Aspen Muse value is due to the longitudinal heat conduction and heat leakage. The average percentage error for Maiti & Sarangi [46], Manglik & Bergles [23], and Joshi & Webb [17] is 3.68%, 1.94%, and 4.67 respectively; whereas the mean percentage error between the MUSE and experimental values is 1.75% as described in Table 2.
Figure 4. Variation of effectiveness with mass flow rate (kg/s)
4.3 Uncertainty assessment in experimental results
The uncertainty in the calculated effectiveness can also be determined. The error estimation is shown in Table 3 for the cold inlet temperature of 107 K. It seems that the uncertainty decreases with the increase in mass flow rate.
4.4 Comparison of effectiveness of cold and hot tests
In the present investigation performance at cold inlet temperature is compared with the earlier experimental performance data at hot inlet conditions by Alur [43]. The comparison is made for a set of data at an inlet temperature of 107 K for the cold test and inlet temperature of 369 K from the hot test. Figure 5 represents the two different sets of data have been used for the hot and cold analysis. The mass flow rate is varied in the range of 300 liters/min to 650 liters/min. It is observed that the initial gain in the effectiveness of the heat exchanger at cold test goes almost the same for further increment in mass flow rate at the hot test.
Figure 5. Comparison of effectiveness of cold and hot test
4.5 Effect of heat transfer to surrounding
The performance of the plate-fin heat exchanger is evaluated under the steady-state condition so that the heat loss by the hot system is carried out by the cold system. The heat balance determines the amount of heat loss or gains by the system. To maintain heat balance in the system high quality of insulation is provided even though there is a certain degree of heat leak from the system. Due to the heat loss, the temperature difference between the hot and cold fluid varies. The divergence of the noted value from the actual value shows the heat loss. Thus, the different value of effectiveness is evaluated for the hot side and cold side.
The heat balance equation for the heat exchanger is as follows:
$\dot{m}{{c}_{p}}({{T}_{co}}-{{T}_{ci}})=\dot{m}{{c}_{p}}({{T}_{hi}}-{{T}_{ho}})$ (17)
For steady flow operation under unbalanced condition.
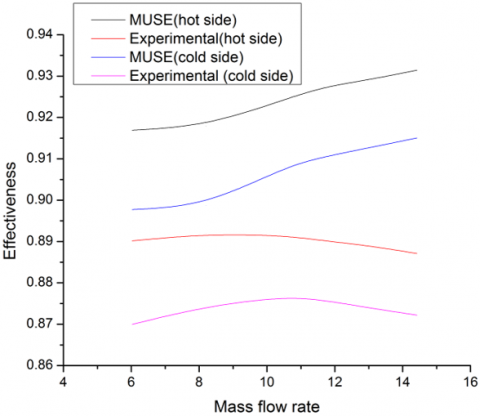
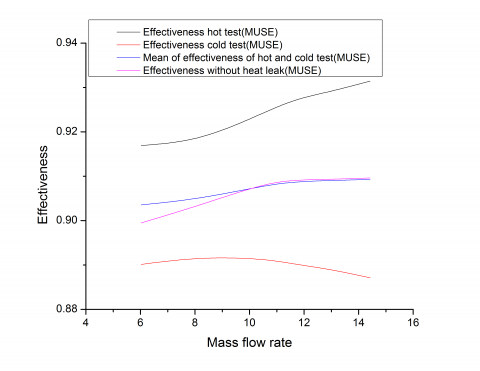
The calculated heat leak value is substituted in the leak heat option in the process of ASPEN MUSE. The process of simulation also generates the two considerable values of effectiveness which is indicated in Figure 6. The values obtained from the simulation under the same operating condition, i.e., at the same mass flow rate and an inlet temperature of 107 K. Since the simulation does not consider the uncertainty, the result deviates from the experimental result, but the trend of the line is almost similar (Figure 6). The variations of effectiveness with respect to mass flow rate for cold and hot test of experimental analysis and MUSE is presented in Figure 7.
Figure 6. Variation of effectiveness with mass flow rate
Figure 7. Variation of effectiveness with mass flow rate (kg/s)
4.6 Heat transfer and friction factor of heat exchanger
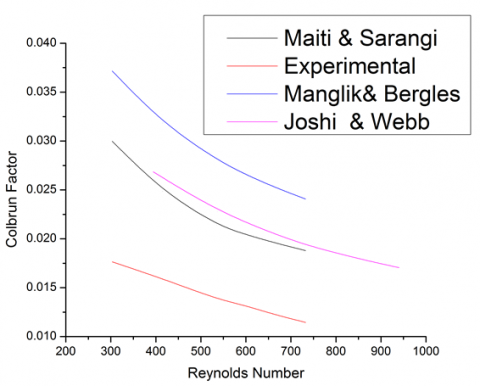
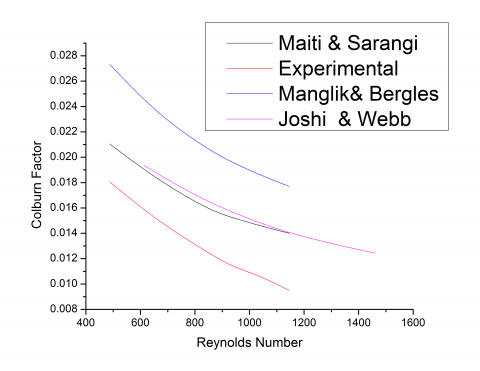
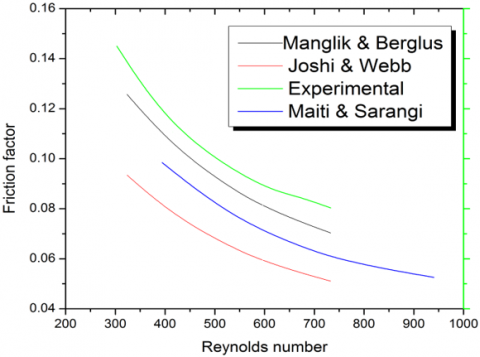
The Colburn and friction factor variation for plate fin heat exchanger is represented in Figures 8-10. Earlier mentioned correlations are used to calculate Colburn factors based on given parameters. From the present experimental data, the Colburn factor is determined for different mass flow rate at 107 K inlet temperature. The experimental data of Colburn factor and the analytical data calculated from the correlation shown in Table 4 and 5. The trend variation of Colburn factor with Reynolds number is plotted in Figure 8 and 9 for hot side and cold side respectively. Table 6 and 7 shows the calculated data of friction factors by using correlations and experimental investigations for hot side and cold side respectively. From Figures 10 and 11, it is clear that the experimental friction factor is higher than the evaluated value. Even though the variation in the calculation, the declination is very well followed by the experimental data and the trends remain same.
Figure 8. Variation of Colburn factor with Reynolds number (hot side)
Figure 9. Variation of Colburn factor with Reynolds number (cold side)
Figure 10. Variation of friction factor with Reynolds number (hot side)
Table 4. Colburn factor at 107 K on hot side of PFHX
|
Mass flow rate (kg/s) |
Experiment |
Maity |
Manglik |
joshi |
|
6.06 |
0.020592 |
0.015230 |
0.013985 |
0.013225 |
|
8.25 |
0.012575 |
0.012071 |
0.029987 |
0.023845 |
|
10.60 |
0.021424 |
0.020521 |
0.019632 |
0.018783 |
|
11.74 |
0.026851 |
0.022807 |
0.020006 |
0.018983 |
|
13.08 |
0.017991 |
0.017057 |
0.037166 |
0.031837 |
|
14.51 |
0.028085 |
0.026700 |
0.025347 |
0.024063 |
Table 5. Colburn factor at 107 K on Cold side of PFHX
|
Mass flow rate (kg/s) |
Experimental |
Maity and Sarangi [46] |
Manglik and Bergles [23] |
Joshi and Webb [17] |
|
6.06 |
0.017688 |
0.013075 |
0.012002 |
0.011349 |
|
8.25 |
0.010789 |
0.010355 |
0.020047 |
0.017645 |
|
10.60 |
0.015908 |
0.015258 |
0.014618 |
0.014001 |
|
11.74 |
0.019365 |
0.016495 |
0.014513 |
0.013794 |
|
13.08 |
0.013099 |
0.012441 |
0.027325 |
0.023403 |
|
14.51 |
0.020641 |
0.019625 |
0.018636 |
0.017693 |
Table 6. Friction factor at 107 K on Hot side of PFHX
|
Mass flow rate (kg/s) |
Exp. |
Maity and Sarangi [46] |
Manglik and Bergles [23] |
Joshi and Webb [17] |
|
6.06 |
0.165002 |
0.130767 |
0.107365 |
0.108323 |
|
8.25 |
0.105478 |
0.100348 |
0.130479 |
0.104657 |
|
10.60 |
0.087554 |
0.081485 |
0.075690 |
0.070316 |
|
11.74 |
0.11843 |
0.096172 |
0.083297 |
0.079273 |
|
13.08 |
0.075706 |
0.072605 |
0.097127 |
0.077247 |
|
14.51 |
0.064163 |
0.059534 |
0.055124 |
0.051042 |
Table 7. Friction factor at 107 K on Cold side of PFHX
|
Mass flow rate (kg/s) |
Exp. |
Maity and Sarangi [46] |
Manglik and Bergles [23] |
Joshi and Webb [17] |
|
6.06 |
0.133633 |
0.110048 |
0.091218 |
0.09285 |
|
8.25 |
0.091655 |
0.088548 |
0.086977 |
0.070312 |
|
10.60 |
0.059159 |
0.055185 |
0.055142 |
0.053548 |
|
11.74 |
0.075038 |
0.061949 |
0.054736 |
0.052489 |
|
13.08 |
0.050460 |
0.048636 |
0.061251 |
0.048699 |
|
14.51 |
0.040439 |
0.037529 |
0.034763 |
0.032193 |
Table 8. Percentage of error between experimental values Vs predicted & simulated with the uncertainty at 107 K cold inlet temperature
|
|
Error Percentage (%) |
||||
|
|
Muse |
Maity and Sarangi [46] |
Manglik and Bergles [23] |
Joshi and Webb [17] |
Uncertainty |
|
|
1.73 |
3.94 |
2.72 |
4.76 |
4.95 |
|
|
1.77 |
4.05 |
2.63 |
5.03 |
3.73 |
|
|
1.76 |
3.60 |
1.87 |
4.62 |
3.00 |
|
|
1.75 |
3.53 |
1.67 |
4.57 |
2.72 |
|
|
1.75 |
3.51 |
1.50 |
4.56 |
2.49 |
|
|
1.75 |
3.43 |
1.27 |
4.50 |
2.29 |
|
Avg. |
1.75 |
3.68 |
1.94 |
4.67 |
3.20 |
4.7 Effect of pressure drops with mass flow rate
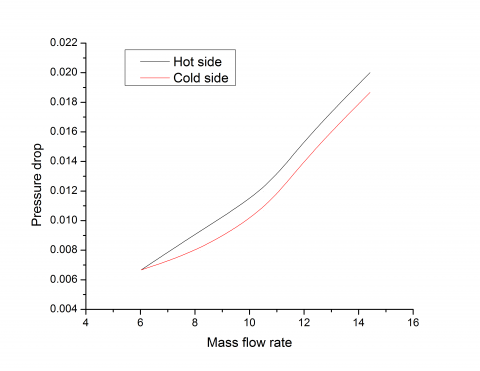
It is observed that the flow disturbance arises due to the Fins. Fins behave as an obstacle to the flow which is responsible for the heat transfer and pressure drop. Pressure drop is the parameter which emphasizes the characterization of the heat exchanger. Increasing the size or quantity of fin increases the pressure drop although heat transfer is also increasing. However, the pressure drop is dependent on the mass flow rate as shown in Figures 12 to 14. It indicates that the pressure drop obtained from the test set up is higher than the simulated and correlated values. This extra pressure drop is due to the friction factor developing by the ports. Eventually, the pressure drops occurred in the experiment is under reasonable or allowable limit, i.e., 0.05 bars.
For the present experimental mass flow rate from 0.006 to 0.021 g/s, the pressure drop varies from 0.0066 to 0.020 bars. In concern, ensure that the pressure drop across the channel should not exceed more than the allowable pressure drop. The pressure drops across the channel of both sides of heat exchanger illustrated in Figure 14. It shows that there is a slight variation in the pressure drop of the cold and hot side which is due to the differences in inlet pressure, temperature, and geometry. Table 8 represents the uncertainty obtained in the experimental test rig with respect to MUSE and proposed correlations.
Figure 11. Variation of friction factor with Reynolds No. (cold side)
Figure 12. Variation of friction factor with mass flow rate (kg/s) at 107 K (hot side)
Figure 13. Variation of friction factor with mass flow rate (kg/s) at 107 (cold side)
Figure 14. Pressure drop (bar) across the channel of both side
The experiments have been performed to evaluate the performance of a plate fin heat exchanger under cryogenic temperature. The analysis demonstrates the effect of mass flow rate on the effectiveness and pressure drop inside the PFHX. The calculated effectiveness and pressure drop obtained from the experimental results are validated with the values obtained using different correlations from the available literature (Maiti and Sarangi [46], Manglik and Bergles [23] and Joshi and Webb [17]). Eventually, the following conclusions were drawn out from the present study:
●Variation of Effectiveness on mass flow rate
Effectiveness gives the scheme to predict the performance of a specified heat exchanger. The outlet temperatures can be obtained from the predicted effectiveness. The obtained value of effectiveness shows the validity with the predicted values by Maiti and Sarangin [46], Manglik and Bergles [23] and Joshi and Webb [17] along with them it is also compared with the simulation software Aspen Muse. The mean percentage error for Maity and Sarangi, Manglik and Bergles, and Joshi and Webb are 3.68%, 1.94%, and 4.67% respectively. Whereas the mean percentage error between the ASPEN MUSE and experimental values is 1.75%.
●Variation of heat transfer and flow friction with Reynolds number
The effect of Reynolds number on heat transfer and flow friction characteristics is studied for various mass flow rates. A discrepancy is noted between the experimental and the predicted data for Colburn factor and friction factor. It is examined that as Reynolds number increases both the quantity ‘j’ and ‘f’ factor decreases. The predicted Colburn factor through correlations is higher than the experimentally measured Colburn factor whereas experimental friction factor is higher than the evaluated value. However, the trend remains the same as that of the predicted value by the correlation.
●Variation of Pressure drops with respect to mass flow rate
The elevation in pressure drop is due to the obstacles of fins, which causes the friction factor. The slight increment in the measured friction factor than that of predicted one is due to the hose as well as because of intermittent connections.
The reported experimental setup is thus an appropriate configuration and a benchmark for computing another type heat exchanger under cryogenic temperature.
|
A |
Heat transfer area of the heat exchanger with subscripts h or c denoting hot and cold fluid, m2 |
|
Aff |
Free flow area available for hot or cold fluid with subscripts h or c respectively, m2 |
|
Afr |
Frontal area available for hot or cold fluid with subscripts h or c respectively, m2 |
|
Aw |
A Total wall area for transverse heat conduction from the hot fluid to cold fluid, m2 |
|
a |
Plate thickness, m |
|
af |
Fin surface area, m2 |
|
aff |
Free flow area (fin), m2 |
|
afr |
Frontal area (fin), m2 |
|
as |
Heat transfer area (fin), m2 |
|
aw |
Total wall cross sectional area for longitudinal conduction, m2 |
|
C |
Flow stream heat capacity rate with subscript h or c for hot and cold fluids, W/K |
|
Cd |
Coefficient of discharge |
|
Cmin |
Minimum of Cc or hc, W/K |
|
Cp |
Specific heat at constant pressure, J/kg-K |
|
Cr |
Heat capacity rate ratio |
|
De |
Equivalent diameter of the flow passage, m |
|
f |
Fin frequency, Number of fins per meter length, fins/m |
|
f |
Fanning friction factor |
|
G |
Core mass velocity, kg/m2s |
|
H |
No flow height (stack height) of the heat exchanger core, m |
|
h |
Height of fin, m |
|
h |
Convective heat transfer coefficient, W/m2 K |
|
j |
The Colburn factor |
|
KcK |
Contraction coefficient |
|
Keek |
Expansion coefficient |
|
Kffk |
Conductivity of the fin material, W/m- K |
|
Kwwk |
Conductivity of the wall material, W/m- K |
|
L |
Fluid flow (core) length on one side of the heat exchanger, m |
|
l |
Fin flow length on one side of a heat exchanger, m |
|
le |
Effective fin length for efficiency determination with subscripts h and c denoting hot and cold fluids, m |
|
m |
Mass flow rate, kg/s |
|
N |
Total number of layers or total number of fluid passages |
|
NTU |
Number of heat transfer units, UA/Cmin |
|
ntuc |
Number of heat transfer units based on cold fluid side |
|
ntuh |
Number of heat transfer units based on the hot fluid side |
|
Pf |
Fin pitch,1/ f, m |
|
Pr |
Prandtl number of the fluid |
|
Q |
Heat load, W |
|
Re |
Reynolds number |
|
Re * |
Critical Reynolds number with subscripts j or f for heat transfer and pressure drop considerations |
|
s |
Spacing between adjacent fins, m |
|
T |
Temperature of the fluid (with subscripts c, h or i, o) |
|
t |
Thickness of fin, m |
|
Uo |
Overall heat transfer coefficient. W/m2 K |
|
W |
Width of the core, m |
|
Subscripts |
|
|
c, i |
cold inlet |
|
c, o |
cold outlet |
|
h, i |
hot inlet |
|
h, o |
hot outlet |
[1] Norris, R., Spofford, W. (1942). High-performance fins for heat transfer. Trans. ASME, 64: 489-496.
[2] Joyner, U.T. (1943). Experimental Investigation of Entrance-Region Heat-Transfer Coefficients, DTIC Document.
[3] Manson, S. (1950). Correlations of heat-transfer data and of friction data for interrupted plane fins staggered in successive rows.
[4] Kays, W., London, A. (1950). Heat transfer and flow friction characteristics of some compact heat exchanger surfaces Part I. Test system and procedure. Trans. ASME, 72: 1075-1097.
[5] Kays, W., London, A. (1950). Heat transfer and flow friction characteristics of some compact heat exchanger surfaces Part II. Design data for thirteen surfaces. Trans. ASME, 72: 1075-1097.
[6] Kays, W.M., London, A.L. (1955). Compact Heat Exchangers: A Summary of Basic Heat Transfer and Flow Friction Design Data. National Press.
[7] Kays, W. (1960). The basic heat transfer and flow friction characteristics of six compact high-performance heat transfer surfaces. Journal of Engineering for Gas Turbines and Power, 82(1): 27-34. https://doi.org/10.1115/1.3672713
[8] Briggs, D., London, A.L. (1964). The heat transfer and flow friction characteristics of five offset rectangular and six plain triangular plate-fin heat transfer surfaces. Technical Report No. 49., Stanford Univ., Calif.
[9] Kays, W.M., London, A.L. (1964). Sun. "Compact Heat Exchangers". United States.
[10] London, A.L., Shah, R.K. (1968). Offset rectangular plate-fin surfaces—heat transfer and flow friction characteristics. Journal of Engineering for Gas Turbines and Power, 90(3): 218-228. https://doi.org/10.1115/1.3609175
[11] Voronin, G., Dubrovsky, E. (1973). Effective Heat Exchangers. Mashinostroenie, Moscow.
[12] Wieting, A.R. (1975). Empirical correlations for heat transfer and flow friction characteristics of rectangular offset-fin plate-fin heat exchangers. Journal of Heat Transfer, 97(3): 488-490. https://doi.org/10.1115/1.3450412
[13] Mochizuki, S., Yagi, Y. (1977). Heat transfer and friction characteristics of strip fins. Heat Transfer-Jpn. Res, 6(3): 36-59.
[14] Sparrow, E., Hajiloo, A. (1980). Measurements of heat transfer and pressure drop for an array of staggered plates aligned parallel to an air flow. Journal of Heat Transfer, 102(3): 426-432. https://doi.org/10.1115/1.3244317
[15] Webb, R., Joshi, H. (1982). Friction factor correlation for the offset strip-fin matrix. Pennsylvania State Univ., University Park (USA). Dept. of Mechanical Engineering.
[16] Webb, R., Joshi, H. (1983). Prediction of the friction factor for the offset strip-fin matrix. Pennsylvania State Univ., University Park (USA). Dept. of Mechanical Engineering.
[17] Joshi, H.M., Webb, R.L. (1987). Heat transfer and friction in the offset stripfin heat exchanger. International Journal of Heat and Mass Transfer, 30(1): 69-84. https://doi.org/10.1016/0017-9310(87)90061-5
[18] Mochizuki, S., Yagi, Y., Yang, W.J. (1987). Transport phenomena in stacks of interrupted parallel-plate surfaces. Experimental Heat Transfer an International Journal, 1(2): 127-140. https://doi.org/10.1080/08916158708946336
[19] Dubrovsky, E., Vasiliev, V.Y. (1988). Enhancement of convective heat transfer in rectangular ducts of interrupted surfaces. International Journal of Heat and Mass Transfer, 31(4): 807-818. https://doi.org/10.1016/0017-9310(88)90138-X
[20] Brockmeier, U., Guentermann, T. Fiebig, M. (1993). Performance evaluation of a vortex generator heat transfer surface and comparison with different high performance surfaces. International Journal of Heat and Mass Transfer, 36(10): 2575-2587. https://doi.org/10.1016/S0017-9310(05)80195-4
[21] Dubrovsky, E.V. (1993). Highly effective plate-fin heat exchanger surfaces from conception to manufacturing. Proceedings of the First International Conference on Aerospace Heat Exchanger Technology, Palo Alto, CA, United States, pp. 501-548.
[22] Dubrovsky, E.V. (1995). Experimental investigation of highly effective plate-fin heat exchanger surfaces. Experimental Thermal and Fluid Science, 10(2): 200-220. https://doi.org/10.1016/0894-1777(94)00100-M
[23] Manglik, R.M., Bergles, A.E. (1995). Heat transfer and pressure drop correlations for the rectangular offset strip fin compact heat exchanger. Experimental Thermal and Fluid Science, 10(2): 171-180. https://doi.org/10.1016/0894-1777(94)00096-Q
[24] Waiters, F. (1969). Hypersonic Research Engine Project—Phase IIA, Category I Test Report on Fin Heat Transfer and Pressure Drop Testing. Data Item.
[25] Youcef-Ali, S. (2005). Study and optimization of the thermal performances of the offset rectangular plate fin absorber plates, with various glazing. Renewable Energy, 30(2): 271-280. https://doi.org/10.1016/j.renene.2004.04.009
[26] Youcef-Ali, S., Desmons, J.Y. (2006). Numerical and experimental study of a solar equipped with offset rectangular plate fin absorber plate. Renewable Energy, 31(13): 2063-2075.
[27] Peng, H., Ling, X., Li, J. (2014). Performance investigation of an innovative offset strip fin arrays in compact heat exchangers. Energy Conversion and Management, 80: 287-297. https://doi.org/10.1016/j.renene.2005.10.008
[28] Dong, J., Chen, J., Chen, Z., Zhou, Y. (2007). Air-side thermal hydraulic performance of offset strip fin aluminum heat exchangers. Applied Thermal Engineering, 27(2-3): 306-313. https://doi.org/10.1016/j.applthermaleng.2006.08.005
[29] Dong, J., Chen, J., Chen, Z. (2008). Flow and heat transfer in compact offset strip fin surfaces. Frontiers of Energy and Power Engineering in China, 2(3): 291-297. https://doi.org/10.1007/s11708-008-0061-y
[30] Robertson, J. (1979). Boiling heat transfer with liquid nitrogen in brazed-aluminum plate-fin heat exchangers. AIChE Symposium Series.
[31] Robertson, J. (1981). Boiling heat transfer with Freon-l 1 in brazed-aluminum plate-fin heat exchangers. AIChE Symposium Series.
[32] Roadman, R., Loehrke, R. (1981). Low Reynolds number flow between interrupted flat plates. Journal of Heat Transfer, 105(1): 166-171. https://doi.org/10.1115/1.3245536
[33] Brinkmann, R., Ramadhyani, S., Incropera, F.P. (1987). Enhancement of convective heat transfer from small heat sources to liquid coolants using strip fins. Experimental Heat Transfer, 1(4): 315-330. https://doi.org/10.1080/08916158708946349
[34] Hou, K.S. (1989). Thermal performance of offset strip fins under unsymmetrical heating condition for various fluids. (1989): 0139-0139.
[35] Marr, Y. (1990). Correlating data on heat-transfer in plate-fin heat-exchangers with short offset fins. Thermal Engineering, 37(5): 249-252.
[36] Tinaut, F.V., Melgar, A., Ali, A.R. (1992). Correlations for heat transfer and flow friction characteristics of compact plate-type heat exchangers. International Journal of Heat and Mass Transfer, 35(7): 1659-1665. https://doi.org/10.1016/0017-9310(92)90136-G
[37] LeVasseur, R. (1991). Liquid cooled approaches for high density avionics. IEEE/AIAA 10th Digital Avionics Systems Conference, Los Angeles, CA, USA, 1991, pp. 147-152. https://doi.org/10.1109/DASC.1991.177157
[38] Hu, S., Herold, K.E. (1995). Prandtl number effect on offset fin heat exchanger performance: Experimental results. International Journal of Heat and Mass Transfer, 38(6): 1053-1061. https://doi.org/10.1016/0017-9310(94)00220-P
[39] Herold, K.E., Sridhar, S., Hu, S. (1992). Cooling of electronic boards using internal fluid flows. ASME, NEW YORK, NY(USA), 1: 285-290.
[40] DeJong, N.C., Jacobi, A. (1995). An experimental study of flow and heat transfer in offset strip and louvered-fin heat exchangers. Air Conditioning and Refrigeration Center. College of Engineering. University of Illinois at Urbana-Champaign.
[41] Peng, H., Ling, X. (2008). Numerical modeling and experimental verification of flow and heat transfer over serrated fins at low Reynolds number. Experimental Thermal and Fluid Science, 32(5): 1039-1048. https://doi.org/10.1016/j.expthermflusci.2007.11.021
[42] Peng, H., Ling, X. (2011). Analysis of heat transfer and flow characteristics over serrated fins with different flow directions. Energy Conversion and Management, 52(2): 826-835. https://doi.org/10.1016/j.enconman.2010.08.008
[43] Alur, S. (2012) Experimental studies on plate fin heat exchangers. PhD diss.
[44] Jiang, Q., Zhuang, M., Zhang, Q., Zhu, Z., Geng, M., Sheng, L., Zhu, P. (2018). Experimental study on the thermal hydraulic performance of plate-fin heat exchangers for cryogenic applications. Cryogenics, 91: 58-67. https://doi.org/10.1016/j.cryogenics.2018.02.006
[45] Kumar, M., Biswal, R., Kumar, A. (2019). Experimental investigation of solidification and remelting over cryocooled sphere using different concentrations of brine solution as phase change material. International Journal of Heat and Technology, 37(1): 22-32. https://doi.org/10.18280/ijht.370103
[46] Maiti, D.K., Sarangi, S.K. (2002). Heat transfer and flow friction characteristics of plate fin heat exchanger surfaces- a numerical study. PhD Dissertation, Indian Institute of Technology, Kharagpur.
[47] Kumar, M., Behera, S.K., Kumar, A., Sahoo, R.K. (2019). Numerical and experimental investigation to visualize the fluid flow and thermal characteristics of a cryogenic turboexpander. Energy, 189: 116267. https://doi.org/10.1016/j.energy.2019.116267
[48] Kumar, M., Panda, D., Behera, S.K., Sahoo, R.K. (2019). Experimental investigation and performance prediction of a cryogenic turboexpander using artificial intelligence techniques. Applied Thermal Engineering, 162: 114273. https://doi.org/10.1016/j.applthermaleng.2019.114273
[49] Gupta, A.K., Kumar, M., Panda, D., Sahoo, R.K. (2018). Experimental analysis to predict the performance of a plate fin heat exchanger at cryogenics temperature. Instrumentation, Mesure, Metrologie, 17(2): 315. https://doi.org/10.3166/i2m.17.315-329