Muwaffaq Kensara | Adel M. Abdel Dayem | Abdelaziz Nasr*
© 2021 IIETA. This article is published by IIETA and is licensed under the CC BY 4.0 license (http://creativecommons.org/licenses/by/4.0/).
OPEN ACCESS
A case study of designing of a reverse osmosis (RO) desalination plant using a Solar Photovoltaic (PV) system is investigated in this work. The RO system is a desalination plant providing pure water to the Shoiaba power generation plant. The system consists of a PV array connected to an inverter for day time or batteries for night time. The PV is designed to meet the high-pressure pumps’ load that is about 13649 kWh a day. Because the plant is operated 24 hours a day the PV panels are divided into two parts, one to cover the day time load and the second to cover night load that is stored in batteries. Based on weather conditions of solar radiation of the shortest day and maximum ambient temperature the PV is sizing and a storage system is determined. The system is modeled by the TNSYS software to simulate the performance of the system during the year. The annual performance of system proves that the system is able to meet the required load during the year. It can be concluded that it is a great opportunity to install photovoltaic panels and increase the efficiency of Reverse Osmosis Desalination Plant.
solar desalination, reverse osmosis, photovoltaic, PV sizing, numerical simulation, TRNSYS, annual performance, power plant
Several regions of the world, such as Arab counties in the Middle East, are facing a problem of drink water. While the heat is the main energy source for the thermal desalination processes, the electricity is commonly used energy bases for Reverse Osmosis and electrodialysis. Reverse Osmosis and electrodialysis are more efficient than thermal desalination processes for energy basis. Using diesel generators in arid areas can be considered a lower initial investment where the grid is not there. In such areas using of photovoltaic systems, PV as an energy source for desalination can be cheaper and renewable with low maintenance as well.
In osmosis process the water is physically moved from low salt concentration side to high salt concentration side. That is done by the difference in osmotic pressure between both two sides. In reverse osmosis an external pressure can force the water to flow in the reverse direction through a permeable membrane. A high-pressure pump is normally used to obtain that high pressure. On the other hand, the membrane is used to keep the flow in one direction from high salt concentration to low salt concentration.
Solar photovoltaic driven reverse osmosis desalination system is the most promising renewable energy that can replace the fossil fuels as conventional energy. Using of photovoltaic can reduce operational costs, and improve environmental sustainability. It was achieved efficient reverse osmosis salt water desalination without energy recovery or pressure exchanger devices. Comparison of the two processes; operated at similar permeate-water recovery ratios and throughputs. In the constant flow process, the permeate-water flow full at the first module and the flow drips at each successive module [1].
PV system is actuality worldwide direction. It was presented a practical method for PV sizing. PV sizing technique is still complicated as inventors and researchers are thinking. The calculations were developed for both PV stand alone and PV hybrid system. A limited photovoltaic (PV) powered reverse osmosis (RO) plant is intended to operate at variable flow and pressure conditions for stand-alone submissions in equatorial zones to desalinate salty water [2]. It was simulated and compared two operation plants. Plant 1 used two modules for the RO pumps where Plant 2 used three modules for both applications. Results shown that Plant 2 has an improved performance, such as: growth of 60% in the daily permeate output and of 32% in the daily operation time [3].
A valuation of a number of researches in relations of their technical and economic performance with feasibility was presented. Also, he discussed the several lessons that have been educated through the process and maintenance and considered the several reasons fundamental moreover their success and failure [4].
Reverse Osmosis (RO) plants driven by photovoltaic (PVRO) panels at public scale for remote areas are increasing in importance. Using of solar energy as a clean source of energy and minimum operating costs is advantageous. Moreover, continuing of the PV performance improvement make using of PV competitor. Therefore, a study aimed to determine the RO plant outline that enables the maximum recovery rate and principals to the lowest global cost for small PVRO plants. The objective was to develop an integrated method in terms of separation process, energy supply and efficiency [5].
It was demonstrated how saltwater reverse osmosis (SWRO) plants, required to meet growing future global water demand. Also he provided a global estimation of the water production costs for 2030 distillation demand with renewable electricity [6].
A paper presented a state of art in wind and solar-PV powered large scale RO plants. This review discussed and identified technical challenges and potential solutions [7]. Hybrid Optimization Model for Electric Renewable (HOMER) to find the greatest photovoltaic system PV in Oman’s conditions and to study the costs and the resulting contaminating emissions studied by Abdul-Wahab et al. [8]. Using HOMER was serving to determine the greatest location in Oman to exploit solar energy production. HOMER simulation grades showed that the greatest type of PV for Oman was 1164 kVA with generic PV.
PVROPRO Photovoltaic Reverse Osmosis Pressure Retarded Osmosis plant was developed and studied. His proposal is based on the hourly solar data of Australia (Perth) in a year. Annual production was amplified more than nine times related to the stand-alone PVRO plant. The water production rate is decreased in the range of 16% and the overall annual reduction is 18.07% [9].
Solar photovoltaic PV energy is a probable solution to decrease the energy costs of creating distilled water. A model was developed to simulate the membrane distillation unit attached with solar PV system in order to examine the steady-state performance of each component. The results showed the influence of external and internal parameters on the working characteristics of the membrane distillation unit attached with solar PV system [10].
It was established means of releasing water for domestic and industrial users. For most manufacturing RO applications, raising recovery, thus reducing waste brine generation, signifies the greatest cost-saving opportunities [11]. For saltwater RO, reducing energy consumptions has the highest prospect for dropping overall costs. Cost effectiveness of reverse osmosis (RO) desalination plant integrated with a solar photovoltaic (PV) source for Masdar Organization studied by [12]. The proposed scheme does not depend on expensive batteries and extremely decreases the government expenses to fund water production cost by $1.34 /m3.
A short review was presented showing efficiency and applicability of RO technology for some water desalination industries like distillery spent wash, ground water treatment, recovery of phenol compounds, and reclamation of wastewater and sea water reverse osmosis (SWRO) treatment [13].
An exergy analysis was established on cycle components. It is indicated that recuperator irreversibility has a significant influence on the cycle performance [14]. In work of Bilton et al. [15] it was focused on improving the feasibility Small-scale photovoltaic-powered reverse osmosis (PVRO), a methodology to estimate the economic feasibility was developed. He showed that growing the efficiency of PVRO systems can extend their feasibility to presently marginal or un- feasible locations.
It was gathered Photovoltaic thermal collector PV/T to desalinate water especially with reverse osmosis. It was developed a mathematical model with multi-inputs and multi outputs based on energy balance equations. He presented the performance of the system elements based on the parameters and correlations [16]. An economic study was established for photovoltaic-powered reverse osmosis for 79 global experimental and design systems. He showed that the unit can cost as low as 2–3 US$/m3 [17].
By the way if the overall efficiency of Photovoltaic Reverse Osmosis PVRO system is improved that can increase the usages of it [18]. While the system efficiency is dependent on the efficiency of individual system components, such as control system and reverse osmosis membranes improving of the efficiency of those components is a subject of the research [19]. However, Saudi Arabia as a leading oil manufacturer, it considers a special attention to utilization of solar energy in the most important field of water desalination.
To achieve these purposes of PVRO system models, the connection between solar power and desalination plant explained below. A large-scale investigational system was simulated to validate the system design characteristics. Details calculation of the system designing and gathering data are presented. Re-designing of RO system in local power plant by convert the electrical power supply consumed from auxiliary power in the power plant to solar photovoltaic system estimation in two conditions day and night time, mathematical modeling, numerical simulation and cost effectiveness.
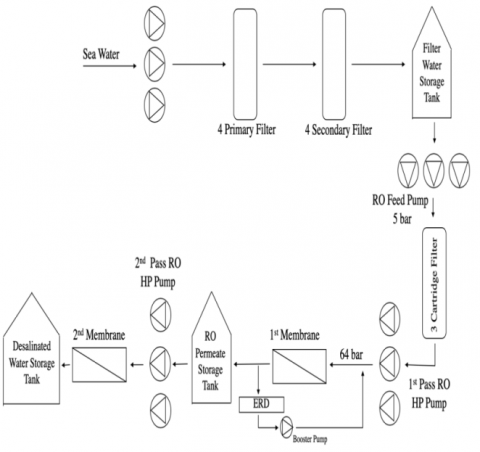
Figure 1. Schematic diagram of reverse osmosis (RO) system
Figure 1 explains the process description of actual Reverse Osmosis desalination plant in Shoaiba Saudi power plant (21 °N). The system consists of five phases, phase-1 is a suction of the sea water provided by three pumps to pump sea water into phase-2, which contains two stages of filters and each stage contains four internal integrated filters and then the purified water is stored in the filtered water tank. In phase-3 the water is pumped from the tank by three RO feed pumps to 5 bar pressure through three Cartridge Filters. In phase-4 the water is pressurized up to 64 bar by 1st pass RO high pressure (HP) pumps through 1st membrane and then it is stored in RO permeate storage tank. The water is pressurized to 11 bar by 2nd pass RO high pressure (HP) pumps in phase-5 through 2nd membrane and finally it is stored in desalinated water storage tank. The RO plant produces approximate 50 t/ h of distillate water to be used as makeup of a combined power plant.
The solar radiation data considered in that study are taken from the Photovoltaic Geographical Information System PVGIS [20] data sources. In that model it is assumed that the solar constant is approximate 1361-1362 W/m2. That radiation incident on a rays perpendicular plane outside the atmosphere The model considers different processes of radiation scattering, absorption and dispersion during the atmosphere. That reduces the values of the solar radiation reaching the ground. The atmosphere components of ozone, CO2, aerosols and water vapor are the reasons of radiation reduction. However, the water vapor is the cause of attenuation that affects the wavelength and spectral distribution of solar radiation.
3.1 Calculation of Solar Radiation from satellite
The solar radiation collected on the ground surface are three components, beam, diffuse and reflected radiation. The beam or direct radiation is the solar radiation reaching directly to the ground surface. The second is the diffuse radiation that is reflected or scattered by the atmosphere components. The reflected radiation is reflected solar radiation from the surroundings.
In calculation of solar radiation, the darkness of the sky is determined from the image of the sky taken along the day and year. The reflectivity of the clouds is calculated from the sky images. The clearest image during a month is taken as a clear sky and other images are estimated as a fraction of clear sky. By that method the clear sky radiation is the maximum radiation during a month where other values of radiation can be calculated as a percentage of that value depending on the darkness of the image taken [20].
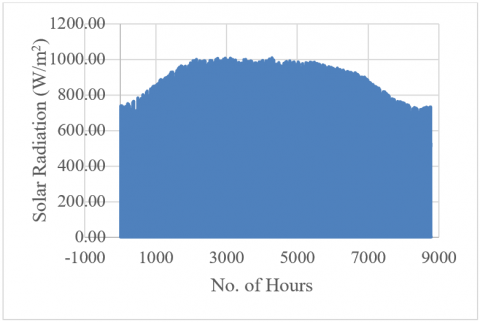
Figure 2 explains the annual estimated hourly solar radiation (W/m2) from satellite for Shoaiba region 21 °N. As expected, the highest values of solar radiation shown as following is during summer days. That was the best time of high performance for photovoltaic system. The maximum solar radiation is ranged between 750 to 1000 W/m2 and that is good enough to install a successful solar system in that area.
Figure 3 explains the measured solar irradiance for December 21 as the shortest day of the year for which the PV sizing is provided. Normal hourly variation can be found in the figure which presents a similar variation for both before and after noon hour. The maximum solar radiation at noon is found about 900 W/m2 and it is good enough to produce a valuable amount of energy. The daily solar radiation can be collected in such day can be estimated as 5956 Wh/m2.
Figure 2. Hourly average solar radiation of KSA
Figure 3. Average solar irradiance of December 21
This section describes the local power plant area weather conditions for nine years from 2011 to 2019. That data was collected from The General Authority of Meteorology & Environmental Protection (PME) [21]. The Figures below explain the yearly hourly average of ambient temperature, wind speed and humidity. Figure 4 illustrates the measure average hourly weather temperature. The expected highest temperatures are obtained during summer which reaches above 40℃. That can negatively affect the output voltage of photovoltaic system, so the temperature parameter is considered in the PV modeling.
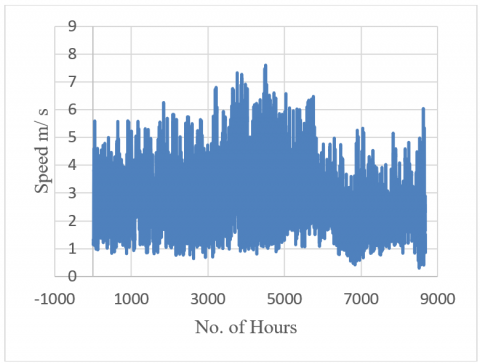
Figure 5 presents the measured average hourly wind speed (in m/s). The figure explains that the region of Shoaiba is a windy area and the wind speed is varied from 4 to 7 m/s. That makes a dusty weather which has a bad effect on the performance for photovoltaic system. Moreover, that forces to more considerations about the system frame and the initial cost as well. Therefore, actual weather data are used in the system modeling and simulated results.
In Figure 6 it is obtained the measured average hourly weather relative humidity (%) for nine years. The relative humidity seems high and it reaches above 70%. That can be seen as fog weather. In that case the diffuse radiation is found high compared with the clear sky radiation. Accordingly, the beam radiation is affected by such weather and it can be found lower than the clear sky radiation. That has a significant influence on the performance of photovoltaic system, the output power is lowered. The results shown below are obtained by taken weather data in consideration.
Figure 4. Hourly average weather temperature, KSA
Figure 5. Hourly average wind speed at KSA
Figure 6. Hourly average humidity at KSA
5.1 RO plant technical data
A large-scale investigational PVRO system is designed to confirm the system need of power supply. Normally the auxiliary power of the plant covers the RO plant power consumption. In that study a PV solar system is used to cover the power needed to RO plant. The PV panels can be connected to the RO system as shown in Figure 7. The PV system is sizing to cover the power of the four pumps installed in the RO plant, intake pump, RO feed pump, 1st and 2nd HP pimps. Because the RO and its pumps are working 24 a day, storage is needed to the night work.
The technical specifications of the RO components are illustrated in Table 1. It is indicated the maximum pressure required, flow rate, power and voltage for each component.
Fortunately, the voltage required for all pumps are the same so one system can supply power to all pumps. Two PV systems are proposed to power the plant pumps, one for day operation and the other for the night operation. The system for the day operation is connected directly to the pumps and it does not need storage where the night system needs storage in batteries. Therefore, the electrical load depends on two situations day and night loads. The required energy load is estimated for the longest day (June 21) for the day load where it is estimated for the longest night (Dec. 21) for the night load. The day length can be found for 21 °N for June 21and Dec. 21, it is found as 13.2 and 10.8 hours respectively. Therefore, the day length is 13.2 hours on June 21 and the night length is 13.2 hours at Dec. 21. They are equal as expected. The day and night loads can be simply calculated as the required power multiplied by operating hours. By summarizing the power from Table 1 the required load is found 6,824,400 Wh for both day and night.
5.2 Photovoltaic PV panel sizing
A photovoltaic panel is selected as a famous manufacturer of Canadian Solar in the worlds [22]. The panel model HiKu has a high-power output, 30% more power from back side, 24% more front side power than conventional modules, low temperature coefficient (Pmax): -0.37%/℃, efficient under high temperature.
As shown in Figure 8 the photovoltaic panel I–V curve in left explains the PV performance under different conditions of solar radiation where the left curve illustrates the effect of ambient temperatures on the I-V curve.
Power required at day time as per calculated = 6,824,400 Wh.
The number of PV panels can be estimated as follows [23].
- Corrected power output/ panel/ day = 415 W * $\frac{5.956 \mathrm{kWh} / \mathrm{m}^{2}-\mathrm{day}}{1 \mathrm{~kW} / \mathrm{m}^{2}}$= 2471.7 Wh/ day
No. of PV panel required at daytime =$\begin{gathered}\frac{\text { day time load }\left(\frac{W h}{\text { day }}\right)}{\text { panel output }\left(\frac{W h}{\text { day }}\right)} =\frac{6,824,400\left(\frac{W h}{d a y}\right)}{2471.7\left(\frac{W h}{d a y}\right)}=2,769\end{gathered}$ (1)
panels No. of PV panel required at night time
PV arrays area at day time = 2108 mm * 1048 mm * 2769 panels= 6,118 m2 = PV array area at night time (2)
Table 1. Reverse osmosis equipment specification
|
Equipment |
Max. Pressure (bar) |
Capacity (m3/ h) |
Rated Power (kW) |
Voltage (V) |
|
3 * RO Feed Pump |
9 |
133 |
45 |
460 |
|
3 * 1st Pass RO HP Pump |
80 |
55.6 |
150 |
460 |
|
2 * Energy Recovery Device |
82 |
76 |
0 |
460 |
|
2 * RO Booster Pump |
83 |
76 |
18.5 |
460 |
|
3 * 2nd Pass RO HP Pump |
15 |
56 |
45 |
460 |
Figure 7. PV system power supply to RO reverse osmosis desalination plant
Figure 8. PV panel performance with standard test condition
Table 2. Specifications of PV Panel
|
Classification |
|
|
Brand |
Canadian Solar |
|
Model |
HiKu |
|
Operating Voltage Operating Current |
39.3 V 10.56 A |
|
Power rate Corrected power rate (calculated) Model Efficiency Operating Temperature |
415 W 187.25 W 18.79% -40℃ ~ +85℃ |
|
Physical Data |
|
|
Cell Arrangement Dimension Weight |
144 cm [2 x (12 cells x 6 cells)] 2108 X 1048 X 40 mm 24.9 kg |
|
Construction |
|
|
Cell Type Front Cover |
Poly-crystalline 3.2 mm tempered glass |
Due to system voltage is 480 V and PV panels voltage is 39.3 as in Table 2, thirteen panels should be connected in series and 213 panels in parallel. Then the number of PV panels required is 2769 panels for each system.
5.3 Inverter selection
It is proposed to use the inverter of Canadian Solar to convert the panel DC current into Pumps AC current the technical specifications are indicated in Table 3.
Table 3. Specification of inverter selected [24]
|
Classification |
|
|
Brand |
Canadian Solar |
|
Model |
CSI-66KTL-GS |
|
DC Input |
|
|
Max. PV Power |
90 kW (22.5 kW/ MPPT) |
|
Operating DC Input Voltage Range Operating Current (Imp) |
200 - 850 VDC 114 A (28.5 A per MPPT) |
|
AC Output |
|
|
AC Power Output rate Rated Output Voltage |
66 kW 480 VAC |
|
Nominal AC Output Current @ 480 Vac |
79.4 A |
|
Rated Output Frequency |
60 Hz |
|
Power Factor |
1 default (+_0.8 adjustable) |
|
System |
|
|
Max. Efficiency CEC Efficiency Night Consumption |
98.8% 98.4% < 1 W |
|
Environment |
|
|
Operating Temperature Storage Temperature |
-25℃ to +60℃ -40℃ to +70℃ |
|
Operating Humidity |
0 – 100% |
|
Operating Altitude |
4000 m |
|
Mechanical Data |
|
|
Dimensions (W/ H/ D) |
630 x 1034 x 354 mm |
|
Weight |
78 kg |
|
Installation Angle |
15-90 degrees from horizontal |
5.4 Battery sizing
The solar battery storage is selected as a more reliable manufacturer, Greensun Solar in the worlds [25]. The battery model and type (LFB12-300), (LiFePO4) has a good capacity rate of 300 Ah where it has long cycle life by 100% DOD after 800 cycles 80% capacity remain, small size, light weight than Lead acid battery and low self- discharge rate less than 3% per month as shown in Table 4.
Table 4. Specification battery
|
Classification |
|
|
Brand |
Greensun Solar or OEM Service |
|
Model |
LFP12-300 |
|
Type |
Lithium Iron Phosphate (LiFePO4) |
|
Capacity Rate |
300 Ah |
|
Rated Volt |
12.8 V |
|
Rated Power |
3840 Wh |
|
Physical Data |
|
|
Overall Height |
269 mm |
|
Width |
220 mm |
|
Length |
520 mm |
|
Weight |
38 kg |
|
Construction |
|
|
Container Material |
ABS/ PVC/ IRON |
|
Terminal material |
Steel |
|
Battery Cell |
Cylindrical/ Prismatic |
As per the longest night time in the year (Dec. 21) its length is 13.2 as operating hours. Power storage required as per calculated = 6,876.1 kWh. For battery charging efficiency of 75% and Maximum depth 70% dependent on Greensun Solar batteries [25].
5.5 Battery storage sizing
Assuming of three days cloudy days so three nights load is assumed to be stored in batteries. It can be calculated the number of batter ties as follows.
Storage load $=\frac{6,824,400 \mathrm{Wh} * 3 \text { days }}{07 \times 075}=38,996,571.4 \mathrm{Wh}$ (3)
No. Of Battery $=\frac{\text { Storage load }}{A h * V}=\frac{38,996,571.4 W h}{300 A h * 12.8 V}=10,155.4$ batteries, round to 10,156 batteries (4)
The voltage of the RO pumps is 480 Volt so it is needed 38 batteries connected in series. Therefore, the total number of batteries required is 10,184 batteries.
5.6 Approximate initial cost and pay back
In any project study, capital cost becomes as an important factor foe decision maker in top management. For this study, the capital cost is very high but also the price of PV panels is not fixed. The price can be changed when dealing with manufacturer vendors due to the huge numbers of panels and batteries. The following calculations demonstrate initial cost and pay back.
The initial cost is estimated in Table 5 the price of the system components is considered for 2019 manufacturer prices.
Table 5. Initial cost of photovoltaic panel and battery
|
Items |
Price (US$) |
Required No. |
Cost (US$) |
|
PV Panel |
435 |
2,769 * 2 |
2,409,030 |
|
Battery |
398 |
10,184 * 2 |
8,106,464 |
|
Total Initial Cost |
US$10,515,494 |
||
With neglecting of any other economic parameter like depreciation, interest, operating costs, taxes, worth etc. the payback period can be estimated as follows. It is Noted that as Saudi Electricity Company prices the price of kWh is SR0.30/ kWh.
Power consumption of RO system is 13 MWh/ day as calculated before.
Per day = 12000 kWh/day * SR0.30/ kWh = SR3600/ day
Per year = SR3600 * 365 = SR1,314,000/ year
Pay back = $\frac{\$ 10,515,493 * 3.75}{S R 1,314,000}$ = 30 years
TRNSYS software is a transient numerical simulation of thermal systems. The system is built in TRNSYS environment. It is a complete and extensible simulation software to develop a transient simulation of systems. TRNSYS environment as components interconnected together to simulate prescribed system. Each engineering equipment is a separate subroutine that can be interconnected to other component/s. The outputs of each equipment may be connected to the inputs of other equipment to simulate a complete system. Each equipment has its own simulation of a transient mathematical model. The equations are solved numerically by Modified Euler method for a predetermined time step and accuracy. The weather data are the inputs to the system to simulate the annual performance.
6.1 Photovoltaic module description
It is predicted the current-voltage characteristics of a PV-module. Normally the PV circuit consists of a DC current source, diode, and a resistor. The PV module is affected by the solar radiation and ambient temperature. While high solar radiation improves the module voltage, the voltage is decreased during high ambient temperature. The operating current and voltage are determined at maximum power point that is the intersection of current-voltage curve. That can be obtained from the current-voltage curve that the manufacturer developed. The results for a single module equivalent circuit are extrapolated to predict the performance of a multi-module array. Those values of current and voltage are corrected depending on available solar radiation and ambient temperature. The mathematical model equations including the effect of solar radiation and ambient temperature are indicated in the TRNSYS manual [25]. The parameters of the PV, pumps, batteries and inverter module those should be described to the program as constant during the simulation running are the specifications of each. Because the PV modules are flat, they are fixed, sloped by 21.5° (city latitude) with horizontal and it is oriented to the equator (south direction). Therefore, at early morning and late evening the PV performance is expected low.
6.2 PVRO system diagram in TRNSYS environment
As showing in Figure 9 the Photovoltaic Reverse Osmosis (PVRO) in TRNSYS environment is clearly presented. The performance of PVRO Desalination Plant depends on capacity and rated power of sea water pump, feed water pumps, high pressure (HP) pump, booster pump, photovoltaic panel, inverter and batteries.
6.3 Simulation results
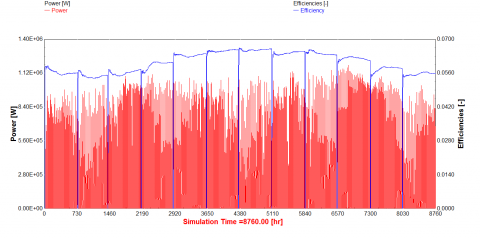
Figure 10 presents the yearly performance of the PVRO system. The PV modules power is illustrated annually and its variation is similar to the solar radiation. The PV module efficiency variation is described annually. The efficiency seems low which is slightly above 6% along the year. The low value compared with the efficiency in the PV catalogue is due to low radiation received and high ambient temperature. To avoid the bad effect of ambient temperature cooling of PV should be integrated.
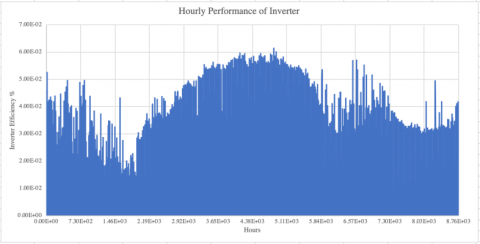
The inverter efficiency variation is shown in Figure 11 and it is not similar to the received solar radiation by the PV module. The efficiency is lowered during the winter where it is increased in summer due to long days in summer. The inverter efficiency is relatively low and it is not higher than 60% and that because the PV voltage is sensitive to the weather conditions. That variation depends on the output voltage of the PV module.
The variation of the solar radiation incident on the PV surface and produced distilled water flow rate are shown in Figure 12. Comparing the PV power (Figure 10) and solar radiation (Figure 11) it is obtained that they are completely similar. It shows the variation solar radiation received by the PV module surface where the module is tilted 21 (Shoaiba latitude). Therefore, that angle reduces the received solar radiation in both summer and winter where it good in both outman and spring. The figure shows also the RO pump flow rates along the year. It is shown that the pumps produced the required flow rates unless very few hours especially in winter season. That proves that the size of PV modules is enough for the determined loads.
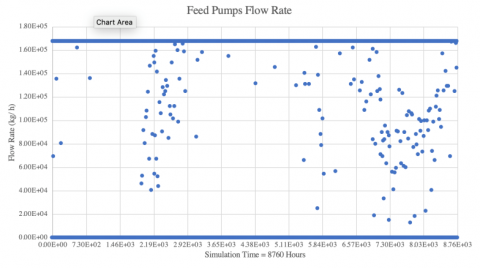
Similarly Figure 13 presents the annual variation of the feed pump flow rates. The performance of the pumps is good enough to provide the required flow rate along the year. During few hours of cloudy days, the flow rate is decreased due to low solar radiation.
As shown in Figure 14 the 1st pass high pressure RO pumps flow rate is constant and it is maximized along the year. The figure illustrates a good performance of the pumps.
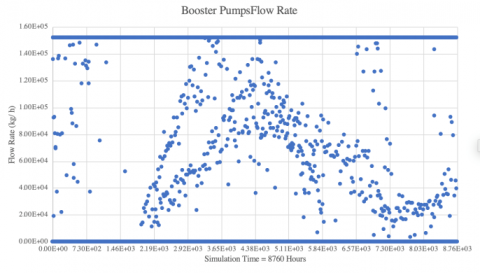
The booster pump flow rate as shown in Figure 15 is relatively constant unless few hours of cloudy days. In general, the performance of the pumps is acceptable along the year and the PV size is enough to supply power to the pumps. Also, the flow rates of the 2nd pass pump are relatively constant as shown in Figure 16.
Figure 9. Flow diagram of PVRO System in TRNSYS environment
Figure 10. Hourly variation of PV power and efficiency under weather conditions
Figure 11. Annual variation of inverter efficiency
Figure 12. Hourly PV radiation and RO pump flow rate
Figure 13. Hourly Performance of Feed Water Pumps
Figure 14. Hourly performance of 1st Pass HP Pumps
Figure 15. Hourly performance of booster pumps
Figure 16. Hourly performance of 2nd Pass HP Pumps
A case study of using of PV solar system to supply power into a RO desalination plant was considered in this study. The auxiliary power which is usually used in such plants is replaced by PV solar system. Sizing of the PV solar system was provided as a large-scale system with about 5538 modules and 10184 batteries based on the local weather conditions. The payback of the proposed system based on the initial cost of the system is about 30 years and that is acceptable compared to the previous solar systems considered. Moreover, a numerical simulation of the designed system was provided including the PV modules, inverter, batteries, and pumps. The annual performance variation is completely similar to the incident solar radiation as expected. The flow rates of the system pumps those are the purpose of the desalination plant are relatively constant during the year and they are equal the required flow rates. That proves that the proposed PV system is good enough to supply power into the desalination plant.
[1] Lachish, U. (2002). Optimizing the efficiency of reverse osmosis seawater. Desalination https://doi.org/10.13140/RG, 2(12099.20003).
[2] Skunpong, R., Plangklang, B. (2011). A Practical Method for Quickly PV Sizing. Procedia Engineering, 8: 120-127. https://doi.org/10.1016/j.proeng.2011.03.022.
[3] Riffel, D.B., Carvalho, P.C. (2009). Small-scale photovoltaic-powered reverse osmosis plant without batteries: Design and simulation. Desalination, 247(1-3): 378-389. https://doi.org/10.1016/j.desal.2008.07.019
[4] Alawaji, S.H. (2001). Evaluation of solar energy research and its applications in Saudi Arabia-20 years of experience. Renewable and Sustainable Energy Reviews, 5(1): 59-77. https://doi.org/10.1016/s1364-0321(00)00006-x
[5] Monnot, M., Carvajal, G.D.M., Laborie, S., Cabassud, C., Lebrun, R. (2018). Integrated approach in eco-design strategy for small RO desalination plants powered by photovoltaic energy. Desalination, 435: 246-258. https://doi.org/10.1016/j.desal.2017.05.015
[6] Caldera, U., Bogdanov, D., Breyer, C. (2016). Local cost of seawater RO desalination based on solar PV and wind energy: A global estimate. Desalination, 385: 207-216. https://doi.org/10.1016/j.desal.2016.02.004
[7] Mito, M.T., Ma, X., Albuflasa, H., Davies, P.A. (2019). Reverse osmosis (RO) membrane desalination driven by wind and solar photovoltaic (PV) energy: State of the art and challenges for large-scale implementation. Renewable and Sustainable Energy Reviews, 112: 669-685. https://doi.org/10.1016/j.rser.2019.06.008
[8] Abdul-Wahab, S., Charabi, Y., Al-Mahruqi, A.M., Osman, I., Osman, S. (2019). Selection of the best solar photovoltaic (PV) for Oman. Solar Energy, 188: 1156-1168. https://doi.org/10.1016/j.solener.2019.07.018
[9] He, W., Wang, Y., Shaheed, M.H. (2015). Stand-alone seawater RO (reverse osmosis) desalination powered by PV (photovoltaic) and PRO (pressure retarded osmosis). Energy, 86: 423-435. https://doi.org/10.1016/j.energy.2015.04.046
[10] Boukhriss, M., Zhani, K., Bacha, H.B. (2016). Optimization of membrane distillation (MD) technology for specific application desalination. The International Journal of Advanced Manufacturing Technology, 88(1-4): 55-66. https://doi.org/10.1007/s00170-016-8756-4
[11] Stover, R. (2014). (PDF) A Primer on Reverse Osmosis Technology. Retrieved from https://www.researchgate.net/publication/293238201_A_Primer_on_Reverse_Osmosis_Technology.
[12] Alsheghri, A., Sharief, S.A., Rabbani, S., Aitzhan, N. Z. (2015). Design and cost analysis of a solar photovoltaic powered reverse osmosis plant for Masdar Institute. Energy Procedia, 75: 319-324. https://doi.org/10.1016/j.egypro.2015.07.365
[13] Garud, R.M. (2011). A Short Review on Process and Applications of Reverse Osmosis. Retrieved from http://www.environmentaljournal.org/1-3/ujert-1-3-2.pdf.
[14] Novales, D., Erkoreka, A., Peña, V.D., Herrazti, B. (2019). Sensitivity analysis of supercritical CO2 power cycle energy and exergy efficiencies regarding cycle component efficiencies for concentrating solar power. Energy Conversion and Management, 182: 430-450. https://doi.org/10.1016/j.enconman.2018.12.016
[15] Bilton, A.M., Kelley, L.C., Dubowsky, S. (2011). Photovoltaic reverse osmosis-Feasibility and a pathway to develop technology. Desalination and Water Treatment, 31(1-3): 24-34. https://doi.org/10.5004/dwt.2011.2398
[16] Ammous, M., Chaabene, M. (2017). Photovoltaic thermal collectors: Reverse osmosis desalination system as an application. Applied Solar Energy, 53(2): 152-160. https://doi.org/10.3103/s0003701x17020049
[17] Davies, P. (2011). A solar-powered reverse osmosis system for high recovery of freshwater from saline groundwater. Desalination, 271(1-3): 72-79. https://doi.org/10.1016/j.desal.2010.12.010
[18] Bilton, A.M., Kelley, L.C., Dubowsky, S. (2011). Photovoltaic reverse osmosis-Feasibility and a pathway to develop technology. Desalination and Water Treatment, 31(1-3): 24-34. https://doi.org/10.5004/dwt.2011.2398
[19] Bilton, A.S., Wiesman, R., Arif, A., Zubair, S., Dubowsky, S. (2016). On the feasibility of community-scale photovoltaic-powered reverse osmosis desalination systems for remote locations. Renewable Energy, 36(12): 3246-3256. https://doi.org/10.1016/j.renene.2011.03.040
[20] National Center for Metrology, Weather Properties. (n.d.), https://www.pme.gov.sa/ar/Pages/default.aspx, accessed on July 15, 2018.
[21] Canadian Solar Inc. (n.d.). BiHiKu, https://www.canadiansolar.com/solarPanels/detail/53, accessed on June 17, 2018
[22] Kalogirou, S.A. (2009). Solar Thermal Power Systems. Solar Energy Engineering, 521-552. https://doi.org/10.1016/b978-0-12-374501-9.00010-8
[23] Canadian Solar INC. Three phase string inverter 50-66 KW, CS_Datasheet, https://www.canadiansolar.com/, accessed on June 17, 2018.
[24] Green sun Solar, Rechargeable Lithium Iron Battery. https://www.greensunpv.com/rechargeable-lithium-iron-battery-pack-12v-200ah-lifepo4-deep-cycle_p72.html, accessed on Aug. 20, 2018.
[25] TRNSYS 17, Manual, Solar Energy Laboratory, Univ. Of Wisconsin-Madison, http://sel.me.wisc.edu/trnsys, accessed on April 19, 2019.