Lirong Ding | Chun Chen*
© 2021 IIETA. This article is published by IIETA and is licensed under the CC BY 4.0 license (http://creativecommons.org/licenses/by/4.0/).
OPEN ACCESS
Improving the thermal environment quality of residential buildings under the demand of low-carbon operation is beneficial to residents' physical and mental health. The existing research has not dynamically simulated the indoor thermal environment of residential buildings for longer time, nor has linked the low-carbon demand with the thermal environment optimization method of residential buildings. Therefore, this study relates to the optimization strategies and energy-saving technologies on thermal environment of residential buildings under the demand of low-carbon operation. Firstly, it analyzes the indoor thermal environment of residential buildings based on the external disturbance conditions, internal disturbance conditions and ventilation, developed the heat transfer model for the facade of residential buildings, and calculates the indoor air temperature. Then, it explores the indoor heat distribution mechanism of residential buildings under the heating mode of concentrated heat source, and analyzes the generation process of hot jet above the heat source and the influence of concentrated heat source on temperature distribution. Finally, the study provides the calculation method of carbon emission from common energy sources in residential buildings. Experimental results verify the effectiveness of the proposed method, and the corresponding suggestions on thermal environment optimization and energy saving for residential buildings are provided.
low-carbon operation, residential buildings, thermal environment optimization, energy saving
Influenced by the industrial revolution, the CO2 content in the atmosphere increased sharply from the original stable value of 190 ~ 290ppm. Because carbon emissions account for 37%-39% of the global total emissions, the construction industry has become one of the national key emission reduction fields. As an important part of the construction industry, it is of great significance for residential buildings to carry out production and operation activities with the goal of controlling carbon emissions to achieve short-term emission reduction targets [1-4]. Improving the thermal environment quality of buildings under the demand of low-carbon operation is beneficial to residents' physical and mental health, and also puts forward higher requirements for the design of thermal environment optimization of residential buildings.
The core reason for such problems as high overall energy consumption and poor thermal environment in traditional residential buildings is the lack of heat preservation and insulation measures in its enclosure structure [5, 6]. Morovat and Athienitis [7] investigates the main characteristics and construction forms of traditional residential buildings, and numerically simulates the energy consumption of various typical residential buildings based on DesignBuilder software, thus completing the optimization and renovation of interior design based on the comfort of human thermal environment. Residential buildings before and after the heating period have the problems of indoor cold, and poor thermal comfort with high humidity. At the same time, the simultaneous use of artificial heating equipment and humidification equipment also causes energy waste [8-11]. Wang et al. [12] carries out subsequent characteristic analysis and thermal environment test on the city where a residential building is located and puts forward suggestions for improving the relevant enclosure structure and applying the building energy-saving mode according to the analysis of the characteristics and influencing factors of indoor thermal comfort of the buildings. Hospitals, as public buildings, need to provide healthy, hygienic and efficient indoor thermal environment for patients and it’s necessary to carry out further study on whether it's energy-saving for the ways and means used to maintain the stability of thermal environment by HVAC [13-15]. Reddy et al. [16] combines the discussion of patient rehabilitation, thermal comfort and hygiene standards, gives thermal environment standards and the range of temperature and humidity indexes of the ward buildings, and optimizes the plane selection and detailed layout design in combination with the actual evaluation results so as to realize the rationalization and energy saving of the thermal environment of the ward buildings. The deterioration of thermal environment in urban residential buildings seriously threatens the health of residents in buildings [17-19]. Zhang et al. [20] uses Mann-Kendall trend method to analyze the temporal and spatial evolution characteristics of thermal environment of urban residential buildings in China, analyzes the driving mechanism of indoor thermal comfort evolution of residential buildings, and reveals the comprehensive adjustment mechanism by the use of green building materials on indoor thermal environment and human comfort. In the construction industry, the tall space buildings with the characteristics of huge volume, high population density and complex thermal environment is the highest carbon emission intensity. The research on architectural design from the perspective of low carbon is of great significance to the control of global greenhouse effect [21-25]. Oshio et al. [26] relates to the low carbonization of large space buildings in areas hot in summer and cold in winter, puts forward matters needing attention in the rational utilization of natural lighting and natural ventilation and the rational selection of building materials, and studies the selection of natural ventilation channels and enclosure materials from the above two perspectives. Hu et al. [27] optimizes the comprehensive evaluation indexes of low-carbon buildings, realizes the analysis and calculation of carbon emission index, analyzes the influencing factors hindering the development of low-carbon buildings, and gives the evaluation method of low-carbon building structure.
To sum up, under the background of advocating energy saving and emission reduction, low carbonization of residential buildings is imminent. Most of the existing researches focus on the dynamic simulation of building energy consumption or carbon emissions quantification methods of different buildings. They have not carried out a long-term dynamic simulation of the indoor thermal environment of residential buildings, nor have they linked the low-carbon demand with the thermal environment optimization methods of residential buildings. Therefore, this study relates to the optimization strategies and energy-saving technologies on thermal environment of residential buildings under the demand of low-carbon operation. The paper mainly involves the following aspects: The indoor thermal environment of residential buildings is dynamically simulated in the second part of the paper, and the analysis is made around three aspects including the external disturbance conditions of the thermal process, the internal disturbance conditions of the thermal process and the ventilation of the thermal process; the heat transfer model for the facade of residential buildings is constructed and the calculation of indoor air temperature is completed in the third part of this paper; the indoor heat distribution mechanism of residential buildings under the heating mode of concentrated heat source is studied, the generation process of heat jet above the heat source is analyzed, and the influence of concentrated heat source on temperature distribution is explored in the fourth part; the calculation of carbon emissions from common energy sources in residential buildings is conducted the fifth part; the experimental results in the sixth part verify the effectiveness of the proposed method and the corresponding suggestions on thermal environment optimization and energy saving of residential buildings are provided.
Generally speaking, in order to simulate and study the optimization control system of thermal environment of residential buildings, it's necessary to simulate the thermal process of residential buildings at first. Essentially, it's to study the temperature change of residential buildings, that's, under the condition of knowing the adjustment strategies of residential thermal environment and the evolution law of local meteorological data, the indoor temperature of residential buildings is calculated and predicted with the change trend of indoor temperature over time, and the calculation and prediction results of temperature change trend under various residential building facade structures are further obtained. The thermal process of residential buildings mainly includes three thermal processes: external environment with building facade, indoor and ventilation.
The factors affecting the heat transfer between the external environment and the building facade include the thermal convection and long-wave radiation of the building facade, and the solar radiation of infrared ray and visible light, and the radiation forms also include direct radiation, scattering and ground reflection. Assuming that the outdoor air temperature is represented with τOA, the building facade temperature and convective heat transfer coefficient with τES and βC, the direct sunlight and sky scattering radiation heat with εS, and the ground reflected radiation heat and long-wave radiation heat with εG and εLW, the heat transfer per unit area of the building facade can be calculated with Eq. (1):
$\varepsilon ={{\beta }_{C}}\left[ \left( {{\tau }_{ES}}+\frac{{{\varepsilon }_{S}}+{{\varepsilon }_{G}}}{{{\beta }_{C}}}-\frac{{{\varepsilon }_{LW}}}{{{\beta }_{C}}} \right)-{{\tau }_{OA}} \right]$ (1)
As can be seen from that above equation, the influence of external environment on the thermal process of residential buildings is great and complex. In order to make the calculation of energy transfer from the external environment to the building facade more convenient and concise, it is generally characterized with the outdoor comprehensive air temperature, which reflects the comprehensive influence intensity of the air temperature, solar radiation intensity, ground reflected radiation intensity and long-wave radiation intensity of the building facade, and can be calculated with Eq. (2):
${{\tau }_{T}}={{\tau }_{A}}+\frac{{{\varepsilon }_{S}}+{{\varepsilon }_{G}}}{{{\beta }_{C}}}-\frac{{{\varepsilon }_{LW}}}{{{\beta }_{C}}}$ (2)
Ignoring the heat dissipation of artificial lighting and human body, the heat generated by the indoor heat source can be equivalent to the sum of the convective heat transfer between the indoor wall surface and the indoor air and the radiant heat between the indoor wall surface and the indoor environment in the analysis and calculation of the indoor thermal process of the residential buildings. Assuming that the heat source and indoor air temperature are represented with τH and τRA, and the convective heat transfer and convective heat transfer coefficient of indoor wall surface with εLW and βLW, the convective heat transfer per square meter of indoor wall surface can be expressed with Eq. (3):
${{\varepsilon }_{LW}}={{\beta }_{LW}}\left( {{\tau }_{H}}-{{\tau }_{RA}} \right)$ (3)
Assuming that the radiation coefficient is represented with ξ, the radiation heat per square meter of indoor wall surface can be expressed with Eq. (4):
${{\varepsilon }_{G}}=\xi \left[ {{\left( \frac{{{\tau }_{H}}}{100} \right)}^{4}}-{{\left( \frac{{{\tau }_{RA}}}{100} \right)}^{4}} \right]$ (4)
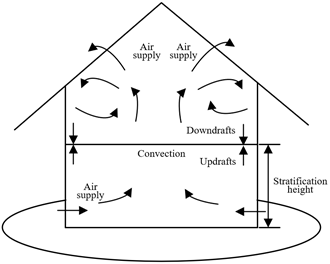
Because natural ventilation is affected by uncertain wind pressure, it is difficult to realize organized and controllable residential ventilation. Therefore, when calculating and analyzing the parameters of the ventilation and thermal process of residential buildings, only the heat-pressed natural ventilation realized by the infiltration of gaps in the facade of buildings or doors, windows and other openings is usually considered. Figure 1 shows a schematic diagram of indoor thermal convection and thermal stratification in residential buildings under natural ventilation. Because the calculation methods of air volume from gap infiltration and opening ventilation are different, assuming that the length and air volume of gap infiltration are represented with k and TA, the thermal pressure difference between the inner and outer sides of the opening with ∆θ, the characteristic coefficient of opening structure with e, and the air tightness coefficient with s, the air volume of gap infiltration can be calculated with Eq. (5):
Figure 1. Schematic diagram of indoor thermal convection and thermal stratification of residential buildings under natural ventilation
$TA=e\Delta {{\theta }^{s}}k$ (5)
Assuming that the opening ventilation rate and equivalent effective area are represented with Q and D, the buoyancy flux with Φ0, and the indoor space and thermal stratification height with GR and GT, the opening ventilation rate can be calculated with Eq. (6):
$Q={{D}^{\frac{2}{3}}}{{\left[ 2{{\Phi }_{0}}\left( {{G}_{R}}-{{G}_{T}} \right) \right]}^{\frac{1}{3}}}$ (6)
If the indoor thermal environment demand and air quality cannot be met by natural ventilation, mechanical ventilation can be adopted to complete ventilation. The ventilation rate of mechanical ventilation can be calculated based on the ventilation frequency method. Assuming that the heat gain from indoor ventilation is represented with WIV, the air specific heat capacity with σA, the air density with ρ, and the air quality with QA, the total heat gain from mechanical ventilation with air exchange times NA can be obtained with Eq. (7):
${{W}_{IV}}={{\sigma }_{A}}\cdot \rho \cdot {{Q}_{A}}\cdot {{N}_{A}}\cdot \left( {{\tau }_{RA}}-{{\tau }_{OA}} \right)$ (7)
When the wall thickness of building facade is smaller compared to the height and width of the building, the heat transfer process can be treated as one-dimensional transient heat conduction process, and the solution error can be controlled within 0.01. Assuming that the thermal diffusion coefficient and thermal conductivity of the building facade are represented with βH and μ, the time variable with φ, the convective heat transfer coefficient of the inner and outer surfaces of the facade with βO and βI, the long-wave radiation and short-wave radiation of the indoor wall surface with EKW and ESW, and the transient heat transfer model of the building facade is expressed with Eq. (8) on the premise that the physical parameters of the building facade are constant:
$\begin{align} & \frac{\partial \tau }{\partial \phi }={{\beta }_{H}}\frac{{{\partial }^{2}}\tau }{\partial {{a}^{2}}} \\ & -\mu \frac{\partial \tau }{\partial a}{{|}_{a=0}}={{\beta }_{O}}\left( {{\tau }_{T}}-{{\tau }_{a=0}} \right) \\ & -\mu \frac{\partial \tau }{\partial a}{{|}_{a=L}}={{\beta }_{I}}\left( {{\tau }_{a=L}}-{{\tau }_{RA}}\left( \phi \right) \right)+{{E}_{KW}}-{{E}_{SW}} \\ & \tau \left( a,0 \right)=g\left( a \right) \\\end{align}$ (8)
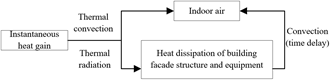
Figure 2. Schematic diagram of instantaneous heat gain of indoor air
As the most important factor affecting the indoor thermal environment of residential buildings, dry bulb temperature can be obtained by analyzing the instantaneous heat gain balance equation of air based on the principle of energy conservation. In this paper, the lumped parameter method is used to construct the indoor air temperature and heat balance equation in a time step. Figure 2 shows the instantaneous heat gain of indoor air. Assuming that the indoor air temperature variable and space volume are represented with ∆τRA and VRA, the convective heat transfer between indoor wall and indoor air, indoor heat source and indoor air, and ventilation air flow with W1, W2, and W3 respectively, based on the conservation principle of indoor air heat gain in residential buildings, the indoor temperature heat balance equation shown in Eq. (9) can be constructed:
$\int_{\phi }^{\phi +\Delta \phi }{\left( {{W}_{1}}+{{W}_{2}}+{{W}_{3}} \right)}d\varphi =\Delta {{\tau }_{RA}}{{V}_{RA}}{{\sigma }_{A}}\left( {{\tau }^{\varphi +\Delta \varphi }}-{{\tau }^{\varphi }} \right)$ (9)
where the W1 value is determined by the indoor wall temperature, while the heat conduction process of the building facade, the solar radiation heat through the door and window openings and the indoor heat radiation jointly affect the indoor wall temperature value. The thermal process of convection heat transfer between indoor wall and indoor air can be analyzed with the steady-state calculation method to analyze the thermal conduction differential equations of the external facades of related buildings. Assuming that the convective heat transfer coefficient and temperature of the indoor i-th surface in the residential buildings are represented with βi and τSi, the area of the i-th surface with Si, the heat transfer coefficient and area of doors and windows with LCW and SW, the dry bulb temperature of outdoor air with τD, and the convective heat transfer between the inner surface of each indoor wall and indoor air can be calculated with Eq. (10):
${{W}_{1}}=\sum{{{\beta }_{i}}\left( {{\tau }_{Si}}-{{\tau }_{RA}} \right){{S}_{i}}+{{L}_{CW}}{{S}_{W}}\left( {{\tau }_{D}}-{{\tau }_{RA}} \right)}$ (10)
During the indoor heating of residential buildings, the heat dissipation of indoor heat source is relatively great. The convection heat transfer W2 between indoor heat source and indoor air is only generated by the radiant heat of indoor heat source acting on indoor walls and transferred to indoor air by convection heat transfer, so the radiant heat of indoor air by indoor heat source can be characterized in W1. Assuming that the ventilation volume is represented with TAV, W3 can be calculated with Eq. (11):
${{W}_{3}}={{\sigma }_{A}}\cdot \rho \cdot {{Q}_{A}}\cdot T{{A}_{V}}\cdot \left( {{\tau }_{OA}}-{{\tau }_{RA}} \right)$ (11)
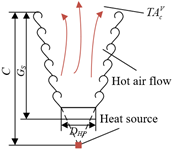
Figure 3. Schematic diagram of hot jet of the concentrated heating
Under the indoor heating mode of concentrated heat source, the hot jet above the concentrated heat source is mainly generated via the heat dissipation of the heating equipment itself or the convection heat transfer between the heating equipment and the indoor air. Figure 3 shows the schematic diagram of the hot jet of the concentrated heating. The transient flow state of hot air flow above the concentrated heat source makes it difficult to accurately measure its heat dissipation and AC heat transfer. Assuming that the convective heat transfer of the concentrated heat source is represented with WHS, the hot jet rate can be calculated based on empirical Eq. (12):
$TA_{c}^{V}=\text{0}.\text{04}\sqrt[\text{3}]{W}\cdot \sqrt[\text{3}]{C}$ (12)
Assuming that the distance between the concentrated heat source and the section of the required solution and the horizontal projection diameter are represented with GS and DHP respectively, then:
$C={{G}_{S}}+1.26{{D}_{HP}}$ (13)
The cross-sectional diameter of the hot jet above the concentrated heat source at GS height can be obtained with Eq. (14):
${{F}_{C}}=0.36{{G}_{S}}+D$ (14)
Assuming that the area of the concentrated heat source and the temperature difference between it and the surrounding air are represented with SHS and ∆τHS, and the corresponding convective heat transfer coefficient is represented with βLW, the convective heat transfer of the concentrated heat source can be expressed as:
$W={{\beta }_{LW}}{{S}_{HS}}\Delta {{\tau }_{HS}}$ (15)
Assuming that the coefficient characterizing the structural characteristics of the heat dissipation surface is represented with D, and the vertical heat dissipation surface and the horizontal heat dissipation surface take values of 1.2 and 1.67 respectively, βLW can be obtained with Eq. (16):
${{\beta }_{LW}}=D\sqrt[\text{3}]{\Delta \tau } $ (16)
Under the indoor heating mode of the concentrated heat source, the hot jet form of the concentrated heat source and the distribution of ventilation airflow jointly determine the indoor heat distribution of residential buildings. The heat in the indoor working and living area mainly comes from three sources. Assuming that the ventilation heat transfer and the heat dissipation of the concentrated heat source are represented with WTF and WHD, and the heat brought in by the return flow of air in the upper indoor space with WRT, then:
$W={{W}_{TF}}+{{W}_{HD}}+{{W}_{RT}}$ (17)
As can be seen from the above equation, the knowledge of the heat composition and distribution in the indoor working and living area needs to be based on the analysis results of the influencing factors of the indoor vertical temperature distribution, i.e. the in-depth discussion of the heat distribution of the air return flow. Indoor vertical temperature distribution is most affected by the area occupied by concentrated heat sources and the number of heat sources, followed by the height of the heat source itself, the initial height of the heat source, the heat intensity of the heat source, the surface temperature of the heat source, the height of the indoor space and other factors. Assuming that the acceleration of gravity is represented with g, the fixed length with KF, the air outlet speed of the opening or vent with δWI, and the air supply temperature difference with ∆τWI, the AR benchmark value representing the air flow with density difference in the indoor working and living area can be expressed as:
$AR=g\times {{K}_{F}}\times \Delta {{\tau }_{WI}}/\left( {{\delta }_{WI}}^{2}\times {{\tau }_{AR}} \right)$ (18)
The larger the AR value is, the more prominent the effect of hot air buoyancy force is, the more intense the air vortex movement caused by hot jet is, and the greater the possibility of air return in the upper indoor space is, resulting in the increase of indoor vertical temperature gradient.
5.1 Calculation of carbon emissions from commonly used energy in residential buildings
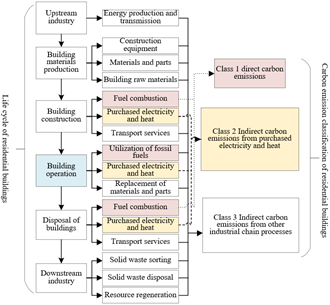
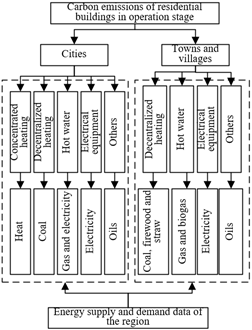
Figure 4 shows the classification of carbon emissions in the life cycle of residential buildings. As can be seen from the figure, the carbon emissions during the operation phase of the buildings involve a three-level emission route: direct carbon emissions caused by fuel combustion, indirect carbon emissions caused by purchased electricity and heat and indirect carbon emissions caused by other industrial chain processes and services. The data basis for carbon emission analysis and calculation during the operation stage of residential buildings is to accurately calculate the carbon emission coefficients of energy and materials during operation.
Energy consumption is the main source of carbon emissions during the operation stage of residential buildings. Assuming that the carbon content, calorific value and oxidation rate of the fuel consumed to maintain the stability of the indoor thermal environment during the operation phase of the residential building are respectively represented with TC, TV and ηO, and the default emissions of CH4 and N2O released during fuel combustion are respectively represented with DE1 and DE2, the carbon emission coefficient CAC of the fuel consumed can be calculated with the empirical formula shown in Eq. (19):
$C{{A}_{C}}=\left( \text{3}\text{.67}{{T}_{V}}{{\eta }_{O}}+\text{28}D{{E}_{1}}+2\text{65}D{{E}_{2}} \right)\cdot {{T}_{C}}\times 1{{0}^{-6}}$ (19)
Figure 4. Classification of carbon emissions in the life cycle of residential buildings
Based on the baseline emission factor, this study calculates the carbon emission coefficient of electricity used for electric heating or air conditioning cooling of residential buildings. The specific steps are as follows:
(1) According to the local thermal power generation, the carbon content, carbon oxidation rate, low heating value, effective CO2 emission coefficient, CH4 emission coefficient, N2O emission coefficient, carbon emission coefficient and other parameters that characterize the level of carbon emissions are calculated.
(2) Based on the primary energy power production, the total amount of non-thermal power generation is calculated, and the same system boundary condition as thermal power is constructed, which is approximately "zero emission".
(3) The thermal power generation and non-thermal power generation are superimposed to calculate the total power generation of the regional power grid, and further obtain the total carbon emissions caused by the energy consumption of thermal power generation. Assuming that the total amount of carbon emissions from the power supply of the i-th regional power grid is represented with TRG-i and the total amount of power supply with IARG-i, the carbon emission coefficient CAC1-i from the power supply of the i-th regional power grid can be calculated with Eq. (20):
$CA_{\text{1}-i}^{C}={{T}_{RG-i}}/I{{A}_{RG-i}}$ (20)
(4) According to the actual power grid layout structure around buildings, the power exchange between regional power grids is analyzed. It is assumed that the electric energy transmitted by the i-th regional power grid to the j-th regional power grid is represented with IAi-j, and the total amount of electric energy returned by the j-th regional power grid to the i-th regional power grid with IAj-I, the regional carbon emission coefficient CAC2-i without considering line loss including M regional power grids can be calculated with Eq. (21):
$CA_{\text{2-}i}^{C}=\frac{CA_{\text{1-}i}^{C}\cdot \left[ I{{A}_{RG-i}}-\sum\limits_{j=1,j\ne i}^{M}{I{{A}_{i-j}}} \right]+\sum\limits_{j=1,j\ne i}^{M}{CA_{\text{1},j}^{C}\cdot I{{A}_{j-i}}}}{I{{A}_{RG-i}}-\sum\limits_{j=1,j\ne i}^{M}{I{{A}_{i-j}}}+\sum\limits_{j=1,j\ne i}^{M}{I{{A}_{_{j-i}}}}}$ (21)
(5) Assuming that the power transmission loss of the i-th regional power grid is represented with IAL-i and the corresponding power terminal consumption with IAPT-i, the line loss ratio μL-i of each regional power grid can be calculated with Eq. (22):
${{\mu }_{L\text{-}i}}=I{{A}_{L\text{-}i}}/\left( I{{A}_{PT\text{-}i}}+I{{A}_{L\text{-}i}} \right)$ (22)
(6) According to the calculation results of μL-i and CAC2-i, the electric carbon emission coefficients CAC,i of residential buildings considering line loss for electric heating or cooling by air conditioning can be calculated with Eq. (23):
$C{{A}_{C\text{-}i}}=CA_{\text{2-}i}^{C}/\left( 1-{{\mu }_{L\text{-}i}} \right)$ (23)
Based on the energy balance table of thermal production, the carbon emission coefficient of concentrated heating in residential buildings is calculated by using the energy consumption and heat supply of thermal heating. Based on the input and output of processing conversion heating, the total heating carbon emission TWU-i in the i-th concentrated heating area is calculated, and the corresponding thermal energy output PRWU-i of thermal heating is further obtained. Ignoring the heat loss ratio of heat supply, the heating carbon emission coefficient CAWU-i of the i-th concentrated heating area can be calculated with Eq. (24):
$C{{A}_{WU\text{-}i}}={{T}_{WU\text{-}i}}/P{{R}_{WU\text{-}i}}$ (24)
If only the production and use process of energy is considered, it can be considered that the carbon emissions of clean energy sources such as nuclear power, wind power and solar energy are approximately zero. Compared with traditional fossil fuels, clean energy and biomass energy have relatively lower carbon emission levels in the construction, maintenance and production services of energy facilities, which can be ignored. In the time range studied, when analyzing and calculating the energy consumption in the operation stage of residential buildings, it is necessary to summarize the total consumption of all kinds of energy as standard coal converted from low calorific value, and then calculate the total carbon emission based on the consumption and energy utilization efficiency of all kinds of energy to further obtain the corresponding comprehensive carbon emission coefficient.
5.2 Carbon emission calculation of residential buildings in operation stage
In this study, the evaluation indicators on energy-saving effect of thermal environment optimization of residential buildings under the requirements of low-carbon economy operation are constructed:
Level 1 (evaluation objectives):
TEA={TEA1, TEA2}={ Technical evaluation and economic evaluation};
Level 2 (primary indicators):
TEA1={TEA11, TEA12, TEA13, TEA14}={energy use management, green material resource utilization, outdoor thermal environment, indoor thermal environment};
TEA2={TEA21, TEA22}={operating cost and benefit};
Level 3 (Detailed indicators):
TEA11={TEA111, TEA112, TEA113}={clean energy utilization, energy saving of equipment system, energy saving of use and maintenance};
TEA12={TEA121, TEA122, TEA123, TEA124}={use of green building materials, use of energy-saving materials, material recycling and waste reuse, and energy-saving production of green building materials};
TEA13 ={TEA131, TEA132}={outdoor thermal environment quality, outdoor greening and carbon fixation};
TEA14={TEA141, TEA142, TEA143, TEA144}={indoor thermal environment quality, building facade optimization, lighting energy saving, concentrated heating};
TEA21={TEA211, TEA212, TEA213}={operating expenses, maintenance input and energy consumption input};
TEA22={TEA221, TEA222}={human thermal comfort, public satisfaction}.
Based on the evaluation direction of the above evaluation rules, this study analyzes the two main ways of carbon emissions when residential buildings maintain their stable indoor thermal environment during the operation, namely, building maintenance investment and daily operation energy consumption. Figure 5 shows the carbon emission statistics of residential buildings during the operation. Assuming that the carbon emissions and benchmark values of residential buildings in the operation stage are represented with UCP and UCPF respectively, the corresponding emission reduction OCP can be calculated with Eq. (25):
${{O}_{CP}}={{U}_{CP}}-{{U}_{CPF}}$ (25)
Figure 5. Carbon emission statistics of residential buildings in operation stage
The maintenance process in the building operation stage involves the optimization of thermal environment with the replacement of only green building materials and energy-saving materials. As the consumption of specific materials for buildings with different structures also varies, it can be estimated according to the estimated proportion of maintenance investment to project construction investment. Assuming that the benchmark value of building maintenance project investment is represented with EBG, the proportion of input cost for renovation and energy-saving measures with ϕCI, and the implied carbon emission intensity with λC, then the benchmark value UG-CPF of carbon emission in the replacement process of green building materials and energy-saving materials can be obtained by the following equation:
$U{}_{G-CPF}=E{{B}_{G}}\cdot {{\varphi }_{CI}}\cdot {{\lambda }_{C}}$ (26)
The daily operation process of residential buildings involves thermal environment optimization and energy saving. The energy consumption mainly includes the power consumption and heat supply energy consumption analyzed in the previous section. Reducing energy carbon emission coefficient and consumption in operation stage can effectively reduce emission reduction, thus realizing energy conservation and emission reduction in daily operation of residential buildings. Assuming that the actual value and benchmark value of the energy carbon emission coefficient base are represented with RVPBR and RVPB, and the actual value and benchmark value of energy consumption in daily operation with RVWBR and RVWB, the emission reduction ERNTP realized by reducing the energy carbon emission coefficient can be calculated with Eq. (27):
$E{{R}_{NTP}}=\sum\limits_{l}{R{{V}_{WBR-l}}\cdot \left( R{{V}_{PBR-l}}-R{{V}_{PB-l}} \right)}$ (27)
The emission reduction achieved by reducing energy consumption can be calculated by ERNTW with Eq. (28):
$E{{R}_{NTW}}=\sum\limits_{l}{\left( R{{V}_{WBR-l}}-R{{V}_{WB-l}} \right)\cdot R{{V}_{PB-l}}}$ (28)
The benchmark value of carbon emissions from electric cooling of residential buildings can be determined based on the calculation results of electric energy consumption of residential buildings, while carbon emissions from thermal heating of residential buildings need to fully consider the local climate zoning. For residential buildings in cold areas where concentrated heating is the main heating mode, the relevant national standard for energy conservation gives the heating design index and thermal consumption index limits of residential buildings in different areas and different floors. Assuming that the calorific value and carbon emission coefficient measured by standard coal are represented with CVFC and CAFC, the transmission efficiency of heating pipe network and the yield efficiency of heating boiler with γ1 and γ2, the thermal consumption index of residential buildings and the number of days of heating period with HB and Nday, and the benchmark value of annual heating carbon emission with UCBD, then the benchmark value of heating carbon emission of residential buildings under concentrated heating mode can be expressed as follows:
${{U}_{CBD}}=24\cdot {{N}_{day}}\cdot {{H}_{B}}/\left( C{{V}_{FC}}\cdot {{\gamma }_{1}}\cdot {{\gamma }_{2}} \right)\cdot C{{A}_{FC}}$ (29)
The benchmark value of lighting carbon emission of residential buildings can be calculated based on the lighting power density values of different types of residential buildings. Assuming that the lighting power density value and the estimated value of the total lighting duration of residential buildings are represented with BLPDV and ZMPDV, ignoring the carbon emissions of other electrical equipment that are greatly affected by the subjective consciousness of users, the benchmark value UPDV of lighting carbon emissions of residential buildings can be calculated with Eq. (30):
${{U}_{PDV}}=B{{L}_{PDV}}\cdot Z{{M}_{PDV}}$ (30)
When considering the biological carbon sequestration amount of indoor greening of residential buildings, assuming that the actual indoor greening rate and the limit value of greening rate are represented with ηAG and ηL, the actual value and benchmark value of CO2 fixed amount per unit greening area of the year with FVA and FVJZ, and the total indoor area of buildings with STR, the annual indoor greening emission reduction ERG can be calculated with Eq. (31):
$E{{R}_{GS}}=\left( {{\eta }_{L}}F{{V}_{JZ}}-{{\eta }_{GS}}F{{V}_{A}} \right)\cdot {{S}_{TR}}$ (31)
If residential buildings adopt energy collection systems of clean energy sources such as solar energy and wind energy for energy conservation, assuming that the net yield and carbon emission coefficient of clean energy are represented with PRNE and CACAP respectively, and the carbon emission of the system during its production, installation and maintenance with UMF, then the indirect emission reduction ERHS of the energy-saving system can be estimated by the following equation:
$E{{R}_{HS}}=-P{{R}_{NE}}\cdot C{{A}_{CAP}}+{{U}_{MF}}$ (32)
Heat distribution is an important indoor thermal environment characteristic of residential buildings. Firstly, this study analyzes the influencing factors of heat sources such as heat source area, heat source height, heat source radiant heat and heat value per unit area on indoor heat distribution of residential buildings under the indoor heating mode of concentrated heat source. The heat distribution coefficient, which is the key to characterize indoor heat distribution, is calculated. Table 1, Table 2 and Table 3 respectively give the data required for data fitting of area coefficient, height coefficient and radiation coefficient, which determine the value of heat distribution coefficient.
Table 1. Proportion of heat source area and corresponding area coefficient
|
Proportion of heat source area |
Area coefficient |
Proportion of heat source area |
Area coefficient |
|
0 |
0 |
0.35 |
0.75 |
|
0.06 |
0.19 |
0.43 |
0.81 |
|
0.11 |
0.32 |
0.53 |
0.87 |
|
0.16 |
0.41 |
0.52 |
0.92 |
|
0.19 |
0.52 |
0.59 |
0.93 |
|
0.24 |
0.59 |
0.62 |
0.95 |
|
0.32 |
0.66 |
0.71 |
0.99 |
|
0.36 |
0.72 |
|
|
Table 2. Different heat source heights and corresponding height coefficients
|
Heat source height |
Height coefficient |
Heat source height |
Height coefficient |
|
1.6 |
0.99 |
8.1 |
0.66 |
|
2.1 |
0.98 |
9.1 |
0.64 |
|
3.1 |
0.95 |
10.1 |
0.62 |
|
4.1 |
0.86 |
11.1 |
0.59 |
|
5.1 |
0.82 |
12.1 |
0.56 |
|
6.1 |
0.76 |
13.1 |
0.55 |
|
7.1 |
0.71 |
14.1 |
0.52 |
Table 3. Proportion of radiant heat from different heat sources and corresponding radiation coefficient
|
Proportion of radiant heat |
Radiation coefficient |
Proportion of radiant heat |
Radiation coefficient |
|
0.37 |
0.99 |
0.57 |
1.13 |
|
0.41 |
1.01 |
0.59 |
1.16 |
|
0.45 |
1.03 |
0.62 |
1.19 |
|
0.46 |
1.05 |
0.63 |
1.68 |
|
0.47 |
1.07 |
0.66 |
2.25 |
|
0.52 |
1.09 |
0.69 |
1.97 |
|
0.56 |
1.11 |
0.72 |
1.53 |
The accuracy of fitting function is related to the amount of data involved in fitting. In this study, the diversity of data involved in fitting is enriched by linear interpolation before data fitting. After linear interpolation, the range of heat source area ratio is [0, 0.71], the range of heat source height is [1.6, 14.1], and the range of radiant heat ratio is [0.37, 0.72]. By inputting the data from the three tables into the Curve Fitting data fitting tool in MATLAB simulation software, the third-order polynomial fitting functions between different heat source area ratios and corresponding area coefficients, different heat source heights and corresponding height coefficients, and different heat source radiant heat ratios and corresponding radiation coefficients can be obtained.
Table 4. Calorific value per unit area of different heat sources
|
Heat source surface temperature |
Convective heat per unit area |
Radiant heat per unit area |
Total heat |
Heat source surface temperature |
Radiant heat per unit area |
Convective heat per unit area |
Total heat |
|
75 |
0.13 |
0.12 |
0.25 |
700 |
6.05 |
25.75 |
31.29 |
|
150 |
0.56 |
0.52 |
1.05 |
900 |
8.31 |
59.92 |
67.52 |
|
250 |
1.62 |
1.89 |
3.52 |
1100 |
10.23 |
122.37 |
131.71 |
|
350 |
2.71 |
4.62 |
7.33 |
1300 |
11.61 |
215.03 |
219.63 |
|
450 |
3.85 |
8.75 |
13.21 |
1500 |
13.52 |
365.00 |
372.18 |
|
550 |
4.95 |
16.07 |
21.05 |
1700 |
15.37 |
512.00 |
517.85 |
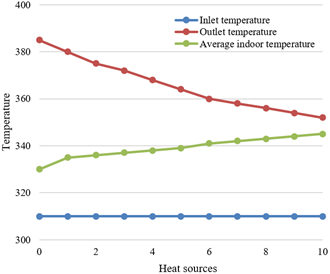
Table 4 shows the heat dissipation under different heat source surface temperatures. Using the same method, the third-order polynomial fitting functions between the heat source surface temperature and convective heat per unit area, radiant heat per unit area and total heat dissipation can be obtained respectively. According to the calculation equation of each fitting function of the heat distribution coefficient, the indoor heat distribution coefficient of residential buildings with different dissipation degrees of concentrated heating heat sources can be calculated respectively. Figure 6 shows the temperature changes monitored at each point.
Figure 6. Temperature changes monitored at each point under different dissipation degrees of heat sources
As can be seen from Figure 6, the average indoor temperature gradually increases with the increase of the dissipation of concentrated heating heat sources, which is due to the change of the distribution mode of heat sources, resulting in more residual heat dissipating into the main living area of buildings. The average temperature of natural air outlet decreases with the increase of dissipation degree of heat sources with concentrated heating.
According to the analysis results in the previous section, the cooling and thermal heating by purchased electricity are the main sources of carbon emissions in residential buildings during operation. Figure 7 shows the change trend of electricity and thermal energy consumption in different residential buildings. It is verified that the electricity and thermal consumption of heating and air conditioning systems exceeds more than half of the total energy consumption of residential buildings. The test results of thermal environment in some buildings are poor, and the indoor temperature exceeds the demand range. Table 5 shows the carbon emissions of residential buildings under different heating modes. It can be seen that the heating mode of coal-fired boilers has the highest carbon emissions, followed by the CHP, and the solar heat pump has lower carbon emissions due to its clean energy production. Therefore, through the analysis of carbon emission intensity of different heating and power supply modes in residential buildings, the measures to improve energy efficiency and reduce carbon emission are to reduce the electricity and thermal energy consumption of heating and air conditioning and improve the utilization rate of clean energy.
Figure 7. Change trend of electricity and thermal consumption in different residential buildings
Table 5. Carbon emissions of residential buildings under different heating modes
|
Item |
Coal-fired boiler |
Oil-fired boiler |
Gas-fired boiler |
CHP |
Solar heat pump |
|
Fuel type |
Coal |
Oil |
Gas |
Coal |
Solar energy/Gas |
|
Calorific value |
20917 |
41352 |
37856 |
20917 |
37856 |
|
Fuel consumption |
77.32 |
31.57 |
32.37 |
72.76 |
16.75 |
|
Transport efficiency |
89 |
89 |
89 |
89 |
89 |
|
Heat production efficiency |
67 |
89 |
91 |
71 |
91 |
|
Carbon emissions |
156.62 |
97.31 |
67.25 |
147.35 |
35.42 |
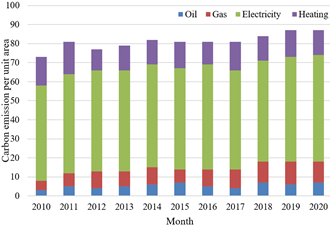
Figure 8 shows the carbon emission change curve during the operation of residential buildings. It can be seen from the figure that the carbon emissions per unit area of residential buildings during operation from 2010 to 2020 are increasing year by year, from 72% in 2010 to 87.6% in 2020. In terms of specific carbon emission composition, thermal heating carbon emissions accounted for about 37.4% of the total before 2015, and showed a downward trend after 2015; before 2015, the carbon emissions from cooling and heating by electricity accounted for about 53.4%, and the proportion increased slightly after 2015. Among the other proportions, the carbon emissions from gas and fuel are about 8.5% and 1.1%, and the change trend of the proportions is not obvious.
Figure 8. Carbon emission change curve of residential buildings during operation
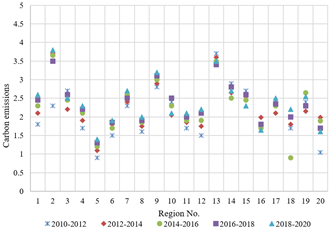
Furthermore, the carbon emissions of residential buildings in different regions during operation are statistically analyzed, with the relevant statistical results shown in Figure 9. As can be seen from the figure, the change trend of carbon emissions during the operation of residential buildings in various provinces in China has obvious regional characteristics and shows an increasing trend. Specifically, due to the cold climate and high heating demand in Northeast China, the carbon emissions during the operation of residential buildings are relatively high. Located in regions such as Hebei, Shandong and Guangdong with large population or regions with highly developed economy in Beijing and Shanghai, the carbon emissions of residential buildings are relatively high during operation.
Figure 9. Carbon emission statistics of different regions
The study analyzes the thermal environment optimization strategies and energy-saving technologies of residential buildings under the demand of low-carbon operation. Firstly, it analyzes the indoor thermal environment of residential buildings based on the external disturbance conditions, internal disturbance conditions and ventilation, constructs the heat transfer model of the facade of residential building, and calculate the indoor air temperature. It describes the third-order polynomial fitting functions between different heat source area ratios and corresponding area coefficients, different heat source heights and corresponding height coefficients, and different heat source radiant heat ratios and corresponding radiation coefficients in detail. Then, it explores the indoor heat distribution mechanism of residential buildings under the heating mode of concentrated heat source, and analyzes the generation process of hot jet above the heat source and the influence of concentrated heat source on temperature distribution. Finally, the study provides the calculation method of carbon emission from common energy sources in residential buildings. The experimental results show the temperature changes monitored at each point under different dissipation degrees of heating heat sources. This study also analyzes the change curves of electricity and thermal consumption of different residential buildings and the change curves of carbon emissions under different heating modes of residential buildings, and gives some measures to improve energy efficiency and reduce carbon emissions. The study provides the change curve of carbon emission during the operation of residential buildings, obtains the composition of carbon emissions, and summarizes the change trend of carbon emissions during the operation of residential buildings in different regions.
This paper was supported by Projects of Hubei Small and Medium Enterprises Research Center (Project No.: HBSME2019C12 and Project No.: HBSME2021B03).
[1] Chen, J., Zhan, W., Jin, S., Han, W., Du, P., Xia, J., Ding, H. (2021). Separate and combined impacts of building and tree on urban thermal environment from two-and three-dimensional perspectives. Building and Environment, 194: 107650. https://doi.org/10.1016/j.buildenv.2021.107650
[2] Liu, Z., Wang, Q., Gan, V.J.L., Peh, L. (2020). Envelope thermal performance analysis based on Building Information Model (BIM) cloud platform-proposed green mark collaboration environment. Energies, 13(3): 586. https://doi.org/10.3390/en13030586
[3] Mazzeo, D., Kontoleon, K.J. (2020). The role of inclination and orientation of different building roof typologies on indoor and outdoor environment thermal comfort in Italy and Greece. Sustainable Cities and Society, 60: 102111. https://doi.org/10.1016/j.scs.2020.102111
[4] Togashi, E., Miyata, M. (2019). Development of building thermal environment emulator to evaluate the performance of the HVAC system operation. Journal of Building Performance Simulation, 12(5): 663-684. https://doi.org/10.1080/19401493.2019.1601259
[5] Malinowski, A., Muzychak, A. (2018). Mathematical modeling of the building thermal state taking into account the heat and energy impact of the environment. IOP Conference Series: Materials Science and Engineering, 415(1): 012047. https://doi.org/10.1088/1757-899X/415/1/012047
[6] Park, H., Rhee, S.B. (2018). IoT-based smart building environment service for occupants’ thermal comfort. Journal of Sensors. https://doi.org/10.1155/2018/1757409
[7] Morovat, N., Athienitis, A.K. (2018). Impact of building-integrated PCM on the indoor thermal environment and energy performance of an office zone. 12th IIR Conference on Phase-Change Materials and Slurries for Refrigeration and Air Conditioning (PCM 2018), Orford (Québec), Canada, pp. 109-116. https://doi.org/10.18462/iir.pcm.2018.0015
[8] Rodler, A., Guernouti, S., Musy, M., Bouyer, J. (2018). Thermal behaviour of a building in its environment: Modelling, experimentation, and comparison. Energy and Buildings, 168: 19-34. https://doi.org/10.1016/j.enbuild.2018.03.008
[9] Chang, N., Li, D.W. (2017). Effects of Modular Ecological Wall on Exterior Light-Thermal Environment of a Building. Journal of South China University of Technology (Natural Science), 45(8): 146-152.
[10] Liu, J. (2015). A numerical study of the indoor thermal environment in an air-conditioned large space building. 2015 8th International Conference on Intelligent Computation Technology and Automation (ICICTA), pp. 69-72. https://doi.org/10.1109/ICICTA.2015.26
[11] Takeshi, S., Toshio, Y., Hisashi, K., Yoshihisa, M., Kazunobu, S., Zhang C. (2014). Thermal environment in a school building with natural ventilation chimney using staircase in winter. Journal of Environmental Engineering (Japan), 79(703): 763-770.
[12] Wang, Y., Meng, X., Yang, X., Liu, J. (2014). Influence of convection and radiation on the thermal environment in an industrial building with buoyancy-driven natural ventilation. Energy and Buildings, 75: 394-401. https://doi.org/10.1016/j.enbuild.2014.02.031
[13] Elnaklah, R., Walker, I., Natarajan, S. (2021). Moving to a green building: Indoor environment quality, thermal comfort and health. Building and Environment, 191: 107592. https://doi.org/10.1016/j.buildenv.2021.107592
[14] Mansur, F.Z., Keling, N.A., Ang, J.H., Salehabadi, A., Riffat, S., Yusup, Y., Ahmad, M.I. (2021). Thermal performance of a fixed-plate air-to-air energy recovery system for building application in hot and humid environment. International Journal of Energy Research, 45(6): 8900-8918. https://doi.org/10.1002/er.6424
[15] Tian, G., Fan, Y., Wang, H., Zheng, H., Gao, M., Liu, J., Liu, C. (2020). Experimental study on indoor thermal environment of industrial building spaces enclosed by fabric membranes. Science and Technology for the Built Environment, 451-461. https://doi.org/10.1080/23744731.2020.1834298
[16] Reddy, K.S., Mudgal, V., Mallick, T.K. (2017). Thermal performance analysis of multi-phase change material layer-integrated building roofs for energy efficiency in built-environment. Energies, 10(9): 1367. https://doi.org/10.3390/en10091367
[17] Jusoh, N., Bakar, R.A., Ismail, A.R., Ali, T.Z.S. (2015). Computational analysis of thermal building in a no-uniform thermal environment. Energy Procedia, 68: 438-445. https://doi.org/10.1016/j.egypro.2015.03.275
[18] Tian, G., Fan, Y., Wang, H., Peng, K., Zhang, X., Zheng, H. (2020). Studies on the thermal environment and natural ventilation in the industrial building spaces enclosed by fabric membranes: A case study. Journal of Building Engineering, 32: 101651. https://doi.org/10.1016/j.jobe.2020.101651
[19] Elghamry, R., Hassan, H. (2020). Impact of window parameters on the building envelope on the thermal comfort, energy consumption and cost and environment. International Journal of Ventilation, 19(4): 233-259. https://doi.org/10.1080/14733315.2019.1665784
[20] Zhang, B., Yuan, P., Liu, M., Fan, X., Hao, W. (2015). Analysis of indoor thermal environment of the building heated by fire pit. Harbin Gongcheng Daxue Xuebao/Journal of Harbin Engineering University, 36(11): 1471-1475.
[21] Fletcher, M., Erkoreka, A., Gorse, C., Martin, K., Sala, J. M. (2015). Optimising test environment and test set up for characterizing actual thermal performance of building components and whole buildings. Energy Procedia, 78: 3264-3269. https://doi.org/10.1016/j.egypro.2015.11.715
[22] Ema, N., Michal, K., Werner, S., Dusan, P. (2017). Optimization of thermal environment in a building with low-exergy radiant systems and glazed facade. Healthy Buildings Europe.
[23] Lv, Y., Jin, W., Yang, Y., Zhang, H., Zhang, X., Ding, F., Zhou, W. (2017). Experimental thermal storage research of organic binary phase change materials in building environment. International Journal of Green Energy, 14(11): 916-924. https://doi.org/10.1080/15435075.2017.1339042
[24] Hasegawa, K., Yoshino, H., Yanagi, U., Azuma, K., Osawa, H., Kagi, N. (2017). Indoor thermal environment of temporary houses built after great east Japan earthquake in 2011 and proposal of thermal performance for building envelopes and mechanical ventilation system. Journal of Environmental Engineering (Japan), 82(731): 19-29. https://doi.org/10.3130/aije.82.19
[25] Muhammad, F., Wonorahardjo, S. (2020, July). Building material in the perspective of energy efficiency and thermal environment in TOD area. IOP Conference Series: Earth and Environmental Science, 532(1): 012021. https://doi.org/10.1088/1755-1315/532/1/012021
[26] Oshio, H., Chen, K., Asawa, T. (2020). Airborne and terrestrial observations of the thermal environment of urban areas surrounding a high-rise building during the Japanese winter. Sensors, 20(2): 517. https://doi.org/10.3390/s20020517
[27] Hu, W., Liu, Q., Nie, J.Z., Chang, M.N., Gao, Y., Zhang, Q.L. (2017). Analysis on building thermal environment and energy consumption for an apartment in the different heating modes. Procedia Engineering, 205: 2545-2552. https://doi.org/10.1016/j.proeng.2017.10.230