Sainadh Singh Kshatri* | Javed Dhillon | Sachin Mishra
© 2021 IIETA. This article is published by IIETA and is licensed under the CC BY 4.0 license (http://creativecommons.org/licenses/by/4.0/).
OPEN ACCESS
Today inverter system is one of the enabling technologies for efficiently harnessing energy from renewable energy sources (Solar, Wind, etc.,) and also for high reliable grid interfacing systems. With the advancements in power electronics, inverter conversion efficiency pushed to 98%, also PV is becoming a major renewable energy source globally. Nevertheless, the reliability performance of PV inverter is of high concern. Different environmental factors like solar irradiance, ambient temperature (also called Mission Profile) affect the reliability performance of PV inverter. Environmental conditions vary from location to location. Hence to quantify the reliability performance of PV inverter all these factors need to be considered. In this paper reliability performance of PV inverter is evaluated considering environmental factors and geographical locations. For the reliability evaluation, a 1-ϕ, 3-kW grid connected PV system is developed in PLECS. Full bridge PV inverter with 600V/30A IGBT is employed as the interface between grid and PV source. Real time mission profile data of one-year logs at India (Relatively hot climate) and Denmark (Relatively cold climate) to account for environmental factors and geographical locations during the reliability performance evaluation of PV inverter. Monte Carlo simulation is used to generate a population of 20000 samples with 5% variation. Lifetime for 20000 samples is calculated and fitted in Two Parameter Weibull distribution. B10 lifetime is calculated at two locations. The results of this paper reveal that environmental factors and geographical locations have a significant impact on PV inverter reliability performance.
ambient temperature, IGBT, junction temperature, PV inverter, reliability, solar irradiance
With the rapid advancement of power electronic technologies, PV inverter systems [1] have been widely applied to harvest energy from solar energy systems, grid connected applications etc. The application of inverter leads to an increase in the utilization of solar energy sources and shares a significant amount in total electricity demand [2]. Nevertheless, researchers reported PV inverter as the most unreliable device in the PV system. The studies [3-7] says that the Grid connected PV inverter is the weakest among all in terms of reliability due to the power semiconductor switches. Factors such as quality control, adequate design, Electrical component failure, and other manufacturing factors influence the reliability of PV inverter. A survey [8] taken from industries concluded that power electronics switches are the critical components. The major failures in power electronic switches are due to thermomechanical failures. Reported wear out, bond wire liftoff, etc., are the most occurring failures in switches [9, 10]. Environmental conditions lead to power cycling and thermal cycling of the switch, which are the major causes for failure. Hence reliability evaluation of power electronic switch is needed.
The reliability performance of the PV inverter is affected by environmental factors like solar irradiance, ambient temperature (also called Mission Profile). Environmental condition varies from location to location. Regions near the equator receive relatively high average solar irradiance and average ambient temperature all over the year. Similarly, regions far from the equator receive relatively low average solar irradiance and average ambient temperature all over the year. The yearly month wise heatmap table of solar irradiance and ambient temperature at both India and Denmark locations are tabulated in Table 1 and Table 2 respectively [11].
The heatmap table showcases that solar irradiance and ambient temperature vary from time to time and location to location, thereby the reliability performance of PV inverter also varies. In comparison with Denmark high climatic conditions are recorded at India. High solar irradiance is recorded at India from March to May. Low solar irradiance is recorded at Denmark from November to February. Similarly, high ambient temperature is recorded at India from March to June. Low ambient temperature is recorded at Denmark from November to April. To account for these factors in the reliability evaluation real time mission profile data for one year at geographical locations of India and Denmark are logged.
In this paper 1-ϕ, 3-kW grid connected PV system is considered as a test case and developed in PLECS. Full bridge PV inverter with four 600V/30A IGBT’s of Infineon manufacturer [12] is employed as the interface between grid and PV source. First mission profile based reliability evaluation is carried out at individual IGBT (Component Level) then by combining all individual IGBT’s to get inverter (System Level) reliability. Finally, B10 lifetime is calculated at both locations. Variation of B10 lifetime of PV inverter with respect to the geographical location at both component level and system level are presented.
Table 1. Heatmap table of solar irradiance
|
Country/ Month |
Solar Irradiance (Wh/m2) |
|
|
India |
Denmark |
|
|
SEP |
165053 |
100054 |
|
OCT |
186766.1 |
61622.69 |
|
NOV |
164028.1 |
24233.29 |
|
DEC |
144757.6 |
10711.25 |
|
JAN |
165846.2 |
16247.97 |
|
FEB |
172830.1 |
36188.28 |
|
MAR |
215120.5 |
71213.96 |
|
APR |
213292.3 |
149069.7 |
|
MAY |
215131.3 |
176171.3 |
|
JUN |
145693.6 |
198472.5 |
|
JUL |
148344.1 |
191219.2 |
|
AUG |
146975.4 |
152064.2 |
Red = High, Yellow = Medium, Green = Low
Table 2. Heatmap table of ambient temperature
|
Country/ Month |
Ambient Temperature (oC) |
|
|
India |
Denmark |
|
|
SEP |
25.81 |
14.79 |
|
OCT |
25.44 |
10.78 |
|
NOV |
24.51 |
6.43 |
|
DEC |
21.75 |
4.17 |
|
JAN |
21.14 |
1.95 |
|
FEB |
25.08 |
3.66 |
|
MAR |
29.84 |
5.32 |
|
APR |
32.71 |
7.95 |
|
MAY |
34.68 |
10.5 |
|
JUN |
30.51 |
16.77 |
|
JUL |
27.14 |
17.34 |
|
AUG |
25.76 |
18.03 |
Red = High, Yellow = Medium, Green = Low
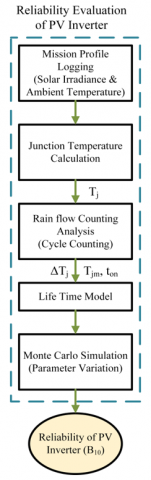
The critical component in the PV inverter is power electronic devices i.e., IGBT [13]. Hence the reliability of IGBT needs to be evaluated to get PV inverter reliability. The temperature at the junction layers of the IGBT varies with mission profile variations and leads to failure (bond wire liftoff, wear out, etc.,) [14, 15]. Hence junction temperature needs to be calculated for reliability evaluation. The step wise reliability evaluation of PV inverter flow chart is shown in Figure 1.
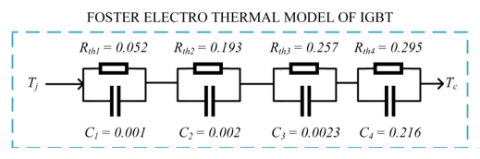
First mission profile data for one year needs to be logged. The junction temperature of IGBT corresponds to the mission profile variations it needs to be calculated. Foster Electro thermal model of IGBT based of manufacturer data sheet is developed in PLECS shown in Figure 2 for the calculation of junction temperature [16].
Junction temperature at any instant is given as
$T_{j}=Z_{t h(j-c)} * P_{T}+T_{C}$ (1)
where,
Figure 1. Flow chart for reliability evaluation
Figure 2. Foster electro thermal model of IGBT
Variations in the junction temperature are analyzed by the rainflow counting algorithm [17]. From the rainflow algorithm No. of Cycles ni, Mean Junction Temperature Tjm, Cycle Amplitude ΔT are calculated. The lifetime of IGBT is calculated by miners rule given as
$\text { Life Time }(L T)=\frac{1}{\text { Life Consumption }(L C)}$ (2)
Life Consumption of IGBT is given as
Life Consumption $(L C)$ $=\sum \frac{\text { No.of Cycles }\left(n_{i}\right)}{\text { No.of Cycle to failure }\left(N_{f i}\right)}$ (3)
where, No. of Cycles ni calculated from rainflow counting algorithm. No. of Cycles to failure Nfi can be calculated by Bayerer’s life time model [18] shown below,
$N_{f}=K\left(\Delta T_{j}\right)^{\beta_{1}} \cdot e^{\frac{\beta_{2}}{\left(T_{j}+273 K\right)}} \cdot t_{o n}^{\beta_{3}} \cdot I^{\beta_{4}} \cdot V^{\beta_{5}} \cdot D^{\beta_{6}}$ (4)
The parameter of the above equation is tabulated in Table 3.
Table 3. Bayerer’s lifetime model parameters
|
Parameter |
Value |
|
Technology Factor (A) |
9.34E+14 |
|
Coefficient (β1) |
-4.416 |
|
Coefficient (β2) |
1285 |
|
Coefficient (β3) |
-0.463 |
|
Coefficient (β4) |
-0.716 |
|
Coefficient (β5) |
-0.761 |
|
Coefficient (β6) |
-0.5 |
|
Current per bond foot (I) |
3-23 A |
|
Voltage class (V) |
6-33 V |
|
Bond wire diameter |
75-500 µm |
Monte Carlo simulation is used to generate a population of 20000 samples with 5% variation. Lifetime for 20000 samples are calculated and fitted in two parameter Weibull distribution then reliability function is calculated at as follows [19, 20].
For component level reliability function is given as
$R(t)=e^{-\left(\frac{t}{\alpha}\right)^{\gamma}}$ (5)
where, µ is Scale Parameter (2.5 for IGBT)
γ is Shape Parameter (characteristic life at 63.2% of population have failed)
For system level
$R_{\text {total }}(t)=\prod_{i=1}^{n} R_{i}(t)$ (6)
where, $R_{i}(t)$ individual component reliability.
From the reliability function B10 lifetime i.e., the probability to fail 10% of the population is calculated at both component level and system level can be obtained [21].
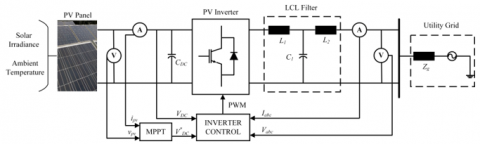
A test case of a 1- ϕ, 3-kW grid connected PV system with full bridge inverter is considered and developed in PLECS environment as shown in Figure 3. The parameters of the test case are tabulated in Table 4. Reliability evaluation of PV inverter is implemented on two cases
Table 4. Proposed 3-KW grid connected PV inverter parameters
|
Name |
Specification |
|
PV panel model |
BP365 |
|
PV inverter rated power |
3-kW |
|
Grid voltage |
230 V |
|
Grid frequency |
50 Hz |
|
Dc link capacitance |
1.5e-3 F |
|
IGBT make |
Infineon |
|
IGBT model |
IGW30N60H3 |
|
IGBT Voltage rating |
600 V |
|
IGBT Current rating |
30 A |
|
IGBT min Tj |
25℃ |
|
IGBT max Tj |
175℃ |
3.1 Reliability (B10) evaluation considering mission profile at India
3.1.1 Real time mission profile data
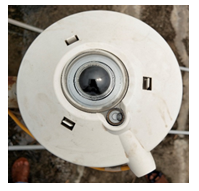
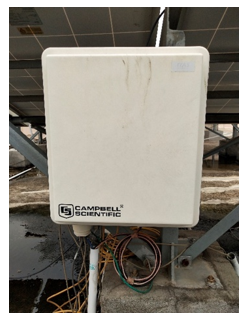
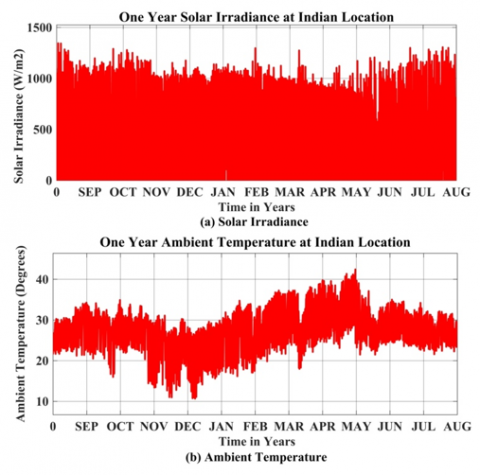
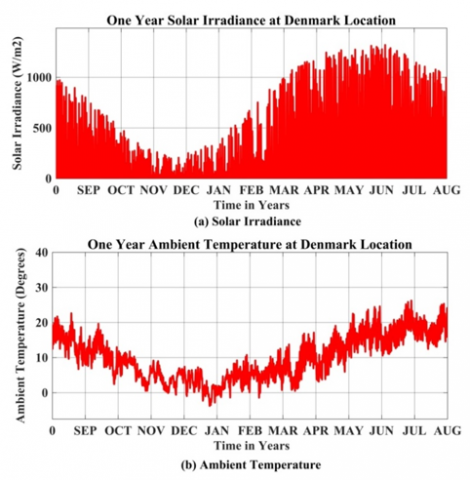
The real time mission profile data i.e., solar irradiance and ambient temperature logs for one year (one min sample) at BVRIT Narsapur, India from 2018 September to 2019 August as shown in Figure 7. CMP11 Pyranometer from Kipp & Zonen manufacturer is used to measure solar irradiance as shown in Figure 4, RTD device from Kipp & Zonen manufacturer is used to measure ambient temperature as shown in Figure 5, CR3000 data logger from Campbell Manufacturer is used to log mission profile shown in Figure 6.
Figure 3. 1-ϕ 3-kW grid connected PV system
Figure 4. Pyranometer
Figure 5. RTD device
Figure 6. CR3000 data logger
Figure 7. Yearly mission profile at India a) Solar irradiance, b) Ambient temperature
The maximum ambient temperature at India is recorded from March to June similarly low ambient temperature at India is recorded from November to February. Solar irradiance and ambient temperature is continuously varying all over the year.
3.1.2 Calculation of junction temperature
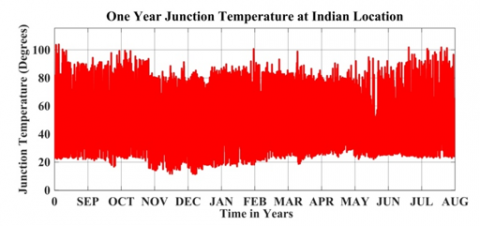
The junction temperature corresponds to the yearly mission profile is calculated using the foster electro thermal model of IGBT shown in Figure 8.
Figure 8. Yearly junction temperature at India
The maximum junction temperature recorded at India is 103.88℃. Similarly, the minimum junction temperature recorded at India is 11.41℃. The above calculate junction temperature of IGBT clearly shows that it is varying rapidly in the form of cycles.
3.1.3 Rainflow counting algorithm
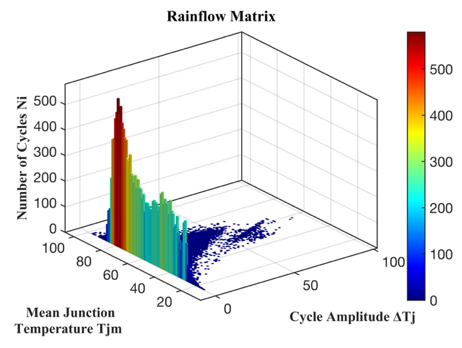
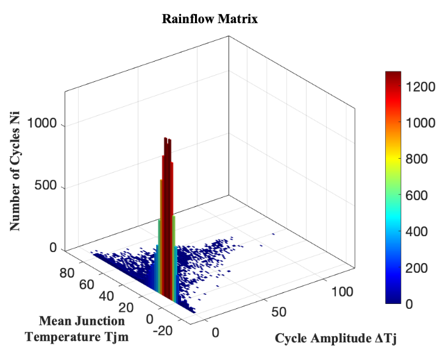
The junction temperature variations at India are analysed using rainflow counting algorithm.
Figure 9. Rainflow matrix indian location
The junction temperature variations i.e., No.of Cycles ni, Mean Junction Temperature Tjm, Cycle Amplitude ΔT are plotted in Figure 9.
3.1.4 Monte Carlo simulation and B10 lifetime
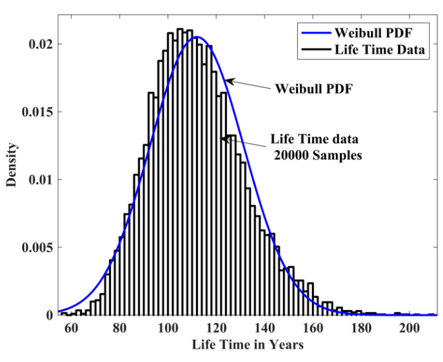
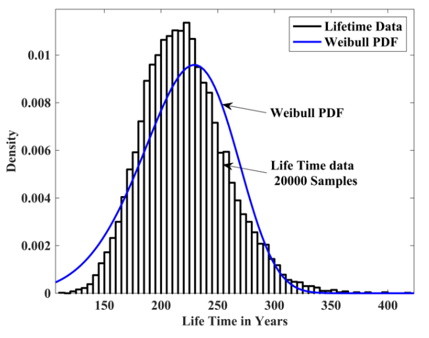
With the help of Monte Carlo simulation population size of 20000 is generated and the lifetime at each sample is calculated with 5% variation using Eq. (2). The 20000 population is fitted with Weibull distribution and is shown in Figure 10.
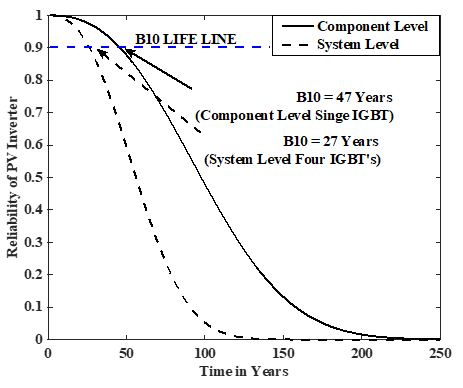
The B10 lifetime of PV inverter at India with both component level and system level is calculated using Eq. (5) and Eq. (6) shown in Figure 11.
The B10 lifetime at the Indian location at the component level is 47 years whereas at the system level is 27 years. In this paper full bridge i.e., four IGBT are considered hence system level reliability is reduced to 27 years.
Figure 10. Lifetime distribution
Figure 11. B10 life time at India
3.2 Reliability (B10) evaluation considering mission profile at Denmark
3.2.1 Real time mission profile data
The real time mission profile data i.e., solar irradiance and ambient temperature logs for one-year (one min sample) form [11] at Alborg, Denmark from 2018 September to 2019 August shown in Figure 12.
Figure 12. Yearly mission profile at Denmark a) Solar irradiance, b) Ambient temperature
The maximum ambient temperature at Denmark is recorded from May to August similarly low ambient temperature at Denmark is recorded from November to February. Solar irradiance and ambient temperature is continuously varying all over the year.
3.2.2 Calculation of junction temperature
The junction temperature corresponds to the yearly mission profile is calculated using the foster electro thermal model of IGBT shown in Figure 13.
Figure 13. Yearly junction temperature at Denmark
The maximum junction temperature recorded at Denmark is 96.37℃. Similarly, the minimum junction temperature recorded at Denmark is -3.13℃. The above calculate junction temperature of IGBT clearly shows that it is varying rapidly in the form of cycles.
3.2.3 Rainflow counting algorithm
The junction temperature variations at Denmark are analysed using rainflow counting algorithm.
Figure 14. Rainflow matrix denmark location
The junction temperature variations i.e., No.of Cycles ni, Mean Junction Temperature Tjm, Cycle Amplitude ΔT are plotted in Figure 14.
3.2.4 Monte Carlo simulation and B10 lifetime
Figure 15. Lifetime distribution
Figure 16. B10 life time at Denmark
With the help of Monte Carlo simulation population size of 20000 is generated and the lifetime at each sample is calculated with 5% variation using Eq. (2). The 20000 population are fitted with Weibull distribution and shown in Figure 15.
The B10 lifetime of PV inverter at Denmark with both component level and system level is calculated using Eq. (5) and Eq. (6) shown in Figure 16.
The B10 lifetime at Denmark location at the component level is 93 years whereas at the system level is 53 years. In this paper full bridge i.e., four IGBT are considered hence system level reliability is reduced to 27 years.
Figure 17. B10 lifetime comparison chart
3.3 B10 lifetime comparison
India and Denmark are two different climatic zones. In India, the highest ambient temperature and solar irradiance are recorded from March to June and the overall mean junction temperature at the Indian location is 55.66℃. In Denmark highest ambient temperature and solar irradiance are recorded from June to July and the overall mean junction temperature at the Denmark location is 16.37℃. The mean temperature difference between both locations is 39.29℃ and this leads to the variation in reliability performance. The B10 lifetime recorded at India where climatic conditions are relatively hot is 47 years (Component Level) and 27 years (System Level). Similarly, B10 lifetime recorded at Denmark where climatic conditions are relatively cold is 93 years (Component Level) and 53 years (System Level). B10 lifetime comparison bar chart is shown in Figure 17. This scenario clearly shows that B10 lifetime varies with respect to the geographical locations and environmental conditions.
This paper presents the impact of solar irradiance and ambient temperature on PV inverter reliability considering geographical locations. In this paper reliability performance of PV inverter is evaluated at both component level and system level. Environmental factors like solar irradiance, ambient temperature, geographical locations are considered during the reliability evaluation. Real time mission profile data of one-year logs at India (Relatively hot climate) and Denmark (Relatively cold climate). Foster electro thermal model is implemented in PLECS for the calculation of junction temperature. Junction temperature variations of IGBT are analyzed using rainflow counting algorithm. Monte Carlo simulation is used to generate a population of 20000 and fitted with Weibull distribution. From the reliability function of Weibull distribution B10 lifetime is calculated at both India and Denmark. The results reveal that B10 lifetime calculated at India i.e. hot climate condition is less than the B10 lifetime calculated at Denmark i.e. cold climate condition. This paper concludes that B10 lifetime varies with respect to the geographical locations and environmental conditions.
[1] Khan, M.N.H., Forouzesh, M., Siwakoti, Y.P., Li, L., Kerekes, T., Blaabjerg, F. (2019). Transformerless inverter topologies for single-phase photovoltaic systems: A comparative review. IEEE Journal of Emerging and Selected Topics in Power Electronics, 8(1): 805-835. https://doi.org/10.1109/JESTPE.2019.2908672
[2] IEA-Pvp. (2020). Snapshot of Global PV Markets 2020, Www.Iea-Pvps.Org, 1-16, http://www.iea-pvps.org/fileadmin/dam/public/report/technical/PVPS_report_-_A_Snapshot_of_Global_PV_-_1992-2014.pdf.
[3] Liu, C., Brem, F., Riedel, G., Eichelberger, E., Hofmann, N. (2012). The influence of thermal cycling methods on the interconnection reliability evaluation within IGBT modules. In 2012 4th Electronic System-Integration Technology Conference, pp. 1-5. https://doi.org/10.1109/ESTC.2012.6542180
[4] Kovačević, I.F., Drofenik, U., Kolar, J.W. (2010). New physical model for lifetime estimation of power modules. In the 2010 International Power Electronics Conference-ECCE ASIA, pp. 2106-2114. https://doi.org/10.1109/IPEC.2010.5543755
[5] Busca, C., Teodorescu, R., Blaabjerg, F., Munk-Nielsen, S., Helle, L., Abeyasekera, T., Rodríguez, P. (2011). An overview of the reliability prediction related aspects of high power IGBTs in wind power applications. Microelectronics Reliability, 51(9-11): 1903-1907. https://doi.org/10.1016/j.microrel.2011.06.053
[6] Riedel, G.J., Valov, M. (2014). Simultaneous testing of wirebond and solder fatigue in IGBT modules. In CIPS 2014; 8th International Conference on Integrated Power Electronics Systems, pp. 25-27.
[7] Sonti, V., Jain, S., Bhattacharya, S. (2016). Analysis of the modulation strategy for the minimization of the leakage current in the PV grid-connected cascaded multilevel inverter. IEEE Transactions on Power Electronics, 32(2): 1156-1169. https://doi.org/10.1109/TPEL.2016.2550206
[8] Yang, S., Bryant, A., Mawby, P., Xiang, D., Ran, L., Tavner, P. (2011). An industry-based survey of reliability in power electronic converters. IEEE Transactions on Industry Applications, 47(3): 1441-1451. https://doi.org/10.1109/TIA.2011.2124436
[9] Shen, Y., Wang, H., Yang, Y., Reigosa, P.D., Blaabjerg, F. (2016, June). Mission profile based sizing of IGBT chip area for PV inverter applications. In 2016 IEEE 7th International Symposium on Power Electronics for Distributed Generation Systems (PEDG), pp. 1-8. https://doi.org/10.1109/PEDG.2016.7527028
[10] Shen, Y., Liivik, E., Blaabjerg, F., Vinnikov, D., Wang, H., Chub, A. (2018). Reliability evaluation of an impedance-source PV microconverter. In 2018 IEEE Applied Power Electronics Conference and Exposition (APEC), pp. 1104-1108. https://doi.org/10.1109/APEC.2018.8341154
[11] Gelaro, R., McCarty, W., Suárez, M.J. (2017). The modern-era retrospective analysis for research and applications, version 2 (MERRA-2). Journal of Climate, 30(14): 5419-5454. https://doi.org/10.1175/JCLI-D-16-0758.1
[12] Gatla, R.K., Chen, W., Zhu, G., Zeng, D., Nirudi, R. (2018). Lifetime estimation of modular cascaded H-bridge MLPVI for grid-connected PV systems considering mission profile. Microelectronics Reliability, 88-90: 1051-1056. https://doi.org/10.1016/j.microrel.2018.06.024
[13] Yang, S., Bryant, A., Mawby, P., Xiang, D., Ran, L., Tavner, P. (2011). An industry-based survey of reliability in power electronic converters. IEEE Transactions on Industry Applications, 47(3): 1441-1451. https://doi.org/10.1109/ECCE.2009.5316356.
[14] Wang, H., Liserre, M., Blaabjerg, F., de Place Rimmen, P., Jacobsen, J.B., Kvisgaard, T., Landkildehus, J. (2013). Transitioning to physics-of-failure as a reliability driver in power electronics. IEEE Journal of Emerging and Selected Topics in Power Electronics, 2(1): 97-114. https://doi.org/10.1109/JESTPE.2013.2290282
[15] Mandeya, R., Chen, C., Pickert, V., Naayagi, R.T., Ji, B. (2018). Gate–emitter pre-threshold voltage as a health-sensitive parameter for IGBT chip failure monitoring in high-voltage multichip IGBT power modules. IEEE Transactions on Power Electronics, 34(9): 9158-9169. https://doi.org/10.1109/TPEL.2018.2884276
[16] Technologies, I. (2018). Transient Thermal Measurements and thermal equivalent circuit models. Appllication Note AN 2015-10, 2018.
[17] GopiReddy, L.R., Tolbert, L.M., Ozpineci, B., Pinto, J.O. (2015). Rainflow algorithm-based lifetime estimation of power semiconductors in utility applications. IEEE Transactions on Industry Applications, 51(4): 3368-3375. https://doi.org/10.1109/TIA.2015.2407055.
[18] Bayerer, R., Herrmann, T., Licht, T., Lutz, J., Feller, M. (2008). Model for power cycling lifetime of IGBT modules-various factors influencing lifetime. In 5th International Conference on Integrated Power Electronics Systems, pp. 1-6.
[19] Chung, H.S.H., Wang, H., Blaabjerg, F., Pecht, M. (Eds.). (2015). Reliability of power electronic converter systems (pp. 0885-8993). Institution of Engineering and Technology.
[20] kumar Gatla, R., Chen, W., Zhu, G., Wang, J.V., Kshatri, S.S. (2019). Lifetime comparison of IGBT modules in grid-connected multilevel PV inverters considering mission profile. In 2019 10th International Conference on Power Electronics and ECCE Asia (ICPE 2019-ECCE Asia), pp. 2764-2769.
[21] Kshatri, S.S., Dhillon, J., Mishra, S. (2020). Reliability evaluation of grid connected PV inverter considering panel degradation rate and oversizing at Indian location. Journal of Critical Reviews, 7(19): 1710-1714. https://doi.org/10.31838/jcr.07.19.210