Ali Chitsazan* | Georg Klepp | Birgit Glasmacher
© 2021 IIETA. This article is published by IIETA and is licensed under the CC BY 4.0 license (http://creativecommons.org/licenses/by/4.0/).
OPEN ACCESS
Jet impingements enhance the heat and mass transfer rate in industrial drying machines. The designer should optimize the design parameters of industrial drying equipment to achieve maximum heat transfer rate. The heat transfer between multiple jets and a moving curved surface is more difficult to study due to the changing boundaries and the effect of surface curvature but is also very relevant in industrial drying applications. SST k-ω turbulence model is used to simulate a real geometry for industrial drying applications. The SST k-ω turbulence model succeeded with reasonable accuracy in reproducing the experimental results. The jet to surface distance, jet to jet spacing, jet inlet velocity, jet angle, and surface velocity are chosen as the design parameters. For the optimization of the impinging round jet, the average Nu number on the moving curved surface is set as the objective functions to be maximized. The SHERPA search algorithm is used to search for the optimal point from the weighted sum of all objectives method. One correlation is developed and validated for the average Nu number. It is found that the maximum average Nu number correlates with high values of jet inlet velocity (Vj), jet angle (θ) and jet to jet spacing (S/d) and low values of the jet to surface distance (H/d) and relative surface velocity (VR). The agreement in the prediction of the average Nu number between the numerical simulation and correlation is found to be reasonable and all the data points deviate from the correlation by less than 4%.
multiple jets, heat transfer, surface motion, surface curvature, CFD, optimization
Jet impingements enhance the heat transfer rate in many industrial applications such as cooling, heating, and drying due to the large amounts of heat and mass transfer between the target surface and the working fluid. Jet impingement flow has many applications in the industry such as the drying of textile and paper, cooling of electronic and turbine components, etc. The designer should optimize the design parameters of industrial drying machines to achieve the maximum heat transfer rate to improve the efficiency of industrial dryer [1].
Huang [2] indicate that the most uniform distribution of local heat transfer coefficient can be provided at an H/d ratio larger than 21, and 0.75% open area is most economical in power consumption. Martin [3] reported with respect to the average Nu number for an array of round nozzles the optimum value for the open area factor as 0.0152 and the separation distance as 5.43 respectively irrespective of any other geometric parameters. Dyban et al. [4] reported an optimum open area factor in the range of 0.007 to 0.018 with dependency on the nozzle to plate spacing with respect to the surface-average heat transfer coefficient. Metzger et al. [5] observed that the maximum average Nu number can be achieved at optimum H/d=1 for S/d=1.67-6.67. Viskanta [6] reported that the optimum H/d=1-2 for maximum heat transfer from multiple impinging jets. San and Lai [7] obtained an optimum value for S/d in the range of 6-12 with respect to the relative maxima of the stagnation Nu number. Can et al. [8] determined that the maximum average Nu number for circular holes can be achieved at the optimum free area factor of about 0.03. Brevet et al. [9] identified an optimum H/d=2-5 and optimum S/d=4-5 to achieve the maximum heat transfer rates on a flat surface. Kamal et al. [10] stated that the uniform pressure distributions beside the largest drying rates can be satisfied at S/d = 3.5, H/d=6, and θ = 60°. Heo et al. [11] found that the optimum inclination angle and the pitch of staggered jet nozzles on a concave surface at Re number of 23,000 are 59.09º and 8.074, respectively. Badra et al. [12] found that the optimal value of H/d=6-7 for the maximum stagnation Nu number from the single impinging jet. Xing and Weigand [13] found that H/d=3 could improve the heat transfer performance for a variety of crossflow configurations. Specht [14] found that for single nozzle arrays and hole channels the maximum heat transfer is at optimum S/d=6. For perforated plates, the maximum heat transfer is for S/d=4. Attalla [15] shows that the maximum average Nu achieved at S/d=2. Zhu et al. [16] found a relationship for uniform heat transfer (H≈8S). Bu et al. [17] determined an optimal H/d=4.5 to improve the heat transfer performance on a concave surface. Bu et al. [18] determined an optimal H/d=4-5.75 for the maximum stagnation Nu on a concave surface. Yang et al. [19] indicated that optimum values of H/d=10, S/d=30, and θ=15º enhance both local and averaged Nu on the concave surface.
The heat and mass transfer between multiple jets and a moving curved surface is more difficult to study due to the changing boundaries and effect of surface curvature but is also very relevant in engineering applications such as paper drying machines. Nevertheless, the effect of multiple jets impinging on the moving curved surface is omitted in the literature, and focus is on the multiple round jets impinging on either the fixed curved surface or moving flat surface. A considerable amount of studies has been dedicated to the optimization of heat transfer in systems of multiple impinging jets only at optimum values for jet to surface distance, jet to jet spacing, and jet angle. While an optimum value of other key controlling design variables such as jet velocity and surface velocity is not observed in the literature. Hence, the optimization of the heat transfer rate in systems of multiple impinging jets on the moving curved surface is very rare in literature. Therefore, the innovative changes in the dryer design are necessary to make the dryer thermally more efficient.
The scope of this research is to find the optimum value of key design parameters of paper drying machines such as the jet to surface distance, jet to jet spacing, jet inlet velocity, jet angle, and surface velocity. The average Nu number from multiple jets impinging on the moving curved surface is set as the objective function to be maximized. The weighted sum of all objectives method and the SHERPA search algorithm is used for the optimization study. In an optimization study, the objective is evaluated with respect to the design variables using a CFD model. The CFD model is based on the solution of the stationary Reynolds-averaged Navier-Stokes equation with a finite volume method. Finally, the optimum values are compared with the literature and one correlation is developed and validated for the average Nu number.
2.1 Mathematical formulation
In the following, the conservation laws of mass, momentum, and energy are expressed for an incompressible fluid with the constant fluid properties in steady state form:
$\frac{\partial \mathrm{U}_{\mathrm{i}}}{\partial \mathrm{X}_{\mathrm{i}}}=0$ (1)
$\mathrm{U}_{\mathrm{j}} \frac{\partial \mathrm{U}_{\mathrm{i}}}{\partial \mathrm{X}_{\mathrm{j}}}=\frac{\partial}{\partial \mathrm{X}_{\mathrm{j}}}\left(v \frac{\partial \mathrm{U}_{\mathrm{i}}}{\partial \mathrm{X}_{\mathrm{j}}}\right)-\frac{1}{\rho} \frac{\partial \mathrm{P}}{\partial \mathrm{X}_{\mathrm{j}}}$ (2)
$\mathrm{U}_{\mathrm{j}} \frac{\partial \Theta}{\partial \mathrm{X}_{\mathrm{j}}}=\frac{\partial}{\partial \mathrm{X}_{\mathrm{j}}}\left(\Gamma_{\Theta} \frac{\partial \Theta}{\partial \mathrm{X}_{\mathrm{j}}}\right)+\mathrm{q}_{\Theta}$ (3)
The Reynolds-Averaged Navier Stokes equations are solved for the transport of mean flow quantities with an appropriate RANS turbulence models to describe the influence of the turbulent quantities to provide the closure relations. Each solution variable in the instantaneous Navier-Stokes equations should be decomposed into an averaged value and a fluctuating component to obtain the Reynolds-Averaged Navier-Stokes equations. The resulting equations for the mean quantities are essentially identical to the original equations, except that an additional term now appears in the momentum transport equation. This additional term, known as the Reynolds stress tensor, has the following definition:
$\mathrm{T}_{\mathrm{t}}=-\overline{\mathrm{U}_{\mathrm{i}}^{\prime} \mathrm{U}^{\prime} \mathrm{j}}$ (4)
The challenge is thus to model the Reynolds stress tensor to close the time-averaged equations. Eddy viscosity models employ the concept of a turbulent viscosity for modeling of Reynolds stress tensor. The most common model is known as the Boussinesq approximation:
$\mathrm{T}_{\mathrm{t}}=2 v_{\mathrm{t}} \mathrm{S}_{\mathrm{ij}}-\frac{2}{3} \delta_{\mathrm{ij}} \mathrm{k}$ (5)
where, νt is the turbulent viscosity, k is the turbulence kinetic energy, δij is the Kronecker delta (=1 if i=j, otherwise =0) and Sij is mean strain rate tensor and given by:
$\mathrm{S}_{\mathrm{ij}}=\frac{1}{2}\left(\frac{\partial \overline{\mathrm{U}}_{\mathrm{i}}}{\partial \mathrm{X}_{\mathrm{j}}}+\frac{\partial \overline{\mathrm{U}}_{\mathrm{j}}}{\partial \mathrm{X}_{\mathrm{i}}}\right)$ (6)
Since the assumption that the Reynolds stress tensor is linearly proportional to the mean strain rate and does not consider the anisotropy of turbulence, some two-equation models extend the linear approximation to include the non-linear constitutive relations. The use of hybrid models as a combination of efficient two-equation models is advisable. The Shear Stress Transport (SST) k-ω model as a combination of the k-ε model in the freestream and the standard k-ω model in the inner parts of the boundary layer is an obvious choice. For further details, see the ref. [20].
2.2 Definition of characteristic numbers
The local heat transfer coefficient is nondimensionalized to the Nusselt number by the following expression:
$\mathrm{Nu}=\frac{\mathrm{hd}}{\mathrm{k}_{\mathrm{t}}}=\frac{\mathrm{q}}{\left(\mathrm{T}_{\mathrm{W}}-\mathrm{T}_{\mathrm{j}}\right)} \cdot \frac{\mathrm{d}}{\mathrm{k}_{\mathrm{t}}}$ (7)
where, q is the convective heat flux, Tw is the target wall temperature, Tj is the jet exit temperature, d is the jet exit diameter, ktis the thermal conductivity of the air at jet exit temperature and h is heat transfer coefficient.
2.3 Domain and boundary condition
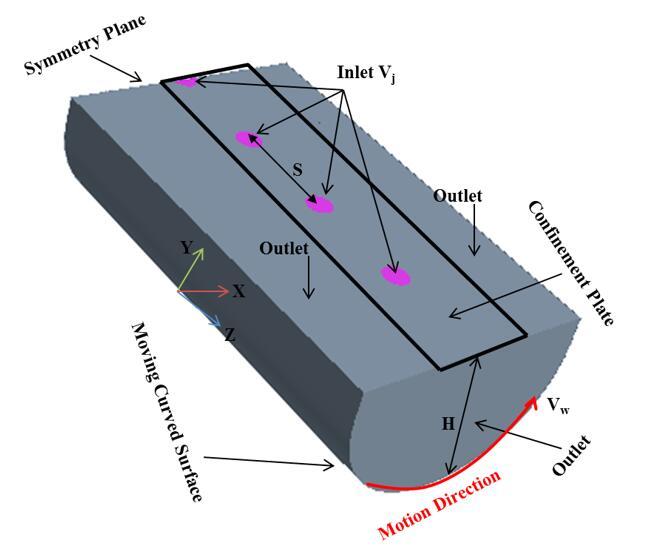
Figure 1. Schematic of the computational domain
Figure 1 shows the geometry of the impinging jet and boundary condition used in the present work. All jet inlets were modeled as circular planes in the top wall. The incoming flow assumed to be with constant fluid properties at Tj=100℃, entered with a uniform velocity profile. The value of inlet velocity is so selected that it matches with the Re number over the range of 4337-21685. The target surface i.e., a moving curved surface was modeled as no-slip wall held at a constant temperature Tw=60℃. On all other solid surfaces, no-slip with adiabatic wall boundary condition is imposed. Constant pressure outlet boundary condition is applied to all open boundaries. The movement of the curved surface is considered along curvilinear axes. The length of the geometric model is considered equal to 140 mm. A symmetric boundary condition was also applied in the X-Y plane for the central jet to reduce the computational cost.
2.4 Computational details
The numerical model is based on the solution of the stationary Reynolds-averaged Navier-Stokes equation with a finite volume method. The CFD model is set up and run with the commercial code STAR-CCM+ 13.02.013 by CD-Adapco. The final solution was obtained by applying a second-order discretization upwind scheme for the pressure, momentum, and energy terms, and the SIMPLE algorithm is used for pressure-velocity coupling and a segregated flow solver was used for all the calculations. SST k-ω turbulence model is used because it is recommended as the best compromise between computational cost and accuracy [11, 12]. The flow in the near-wall regime was simulated using a low-Reynolds number approach. The solution was considered to be converged when the value of the scaled residual of the continuity, momentum, and energy equations is less than 10-4.
2.5 Grid generation and sensitivity
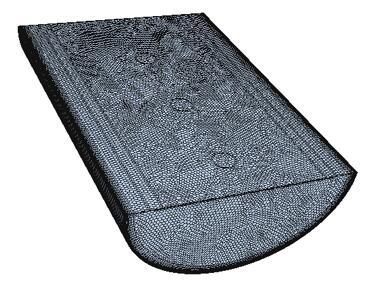
An unstructured Polyhedral grid was generated using STAR-CCM+ auto-mesher. Boundary layers with a y+ value less than one is built on the target surface of the model. The grid was refined near the curved target wall to enable better resolution of the flow in this part. The final numerical model accounted to about 2,157,431 grid cells (see Figure 2).
Figure 2. A 3D view of the grid
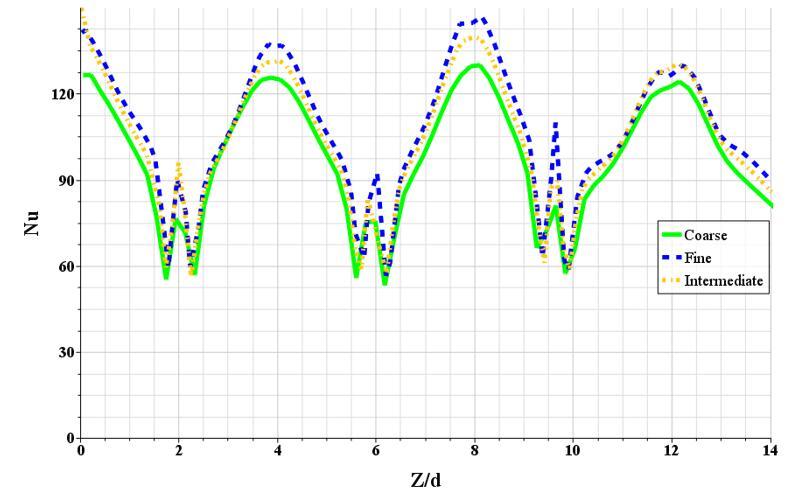
A grid sensitivity study is carried out to ascertain the accuracy of the numerical results. It is carried out by analyzing the variation of Nu number distribution on the target surface along the Z-centerline (the lines pass through the stagnation points of jets). Three simulations with the same geometry but different grid sizes were carried out to check the grid independence of the simulation (see Figure 3). The grid sizes are summarized in Table 1.
The local discretization error distribution is calculated by applying the GCI method [21]. The overall discretization error for fine and intermediate grids was very small 2.6% and 4.12% respectively. Therefore, in the present case, the solution was grid-independent. To reduce the computational cost, the intermediate grid is selected as the final grid.
Figure 3. Nusselt number distributions obtained by the grids used in the grid sensitivity study
Table 1. Grid parameters of the refinement study at Re =23,000
|
Grid |
Base Size(m) |
Cell Number |
Max y+ |
Average GCI % |
|
Course |
0.00192 |
447431 |
0.44 |
--- |
|
Intermediate |
0.00127 |
970045 |
0.31 |
4.12 |
|
Fine |
0.00088 |
2157431 |
0.23 |
2.6 |
2.6 Design variables and objective functions
In an optimization study, the objectives are evaluated with respect to the design variables using a CFD model. During the analysis, an optimization algorithm uses an embedded strategy to choose the values for the input parameters to best meet the analysis objectives.
The designer should optimize the design parameters of industrial drying equipment to achieve maximum heat transfer. Therefore, in the present optimization study, the average heat transfer coefficient in the dimensionless form (Nusselt number) is selected as the objective function to be maximized. Optimization for the multiple jets impinging on a moving curved surface has been performed with respect to five key controlling design parameters such as jet to surface distance, the spacing between the jets, jet exit velocity, surface velocity, and jet angle. These parameters can play a critical role in the rate of heat transfer and therefore optimization is required for design purposes. Other parameters, such as relative surface curvature (Cr=0.1), nozzle diameter (d=10mm), jet temperature (100℃), surface temperature (60℃) and ambient temperature (20℃) are held constant. The ranges of the design variables for the optimization have been concentrated on the paper drying machine as shown in Table 2.
Table 2. Design variables and design space
|
Design variable |
Lower bound |
Upper bound |
|
H/d |
2 |
10 |
|
S/d |
2 |
10 |
|
θ |
40 deg |
90 deg |
|
Re number |
4337 |
21685 |
|
Relative surface velocity (VR) |
0.0034 |
1 |
|
Inlet velocity |
10 m/s |
50 m/s |
|
Surface velocity |
0.17 m/s |
10 m/s |
2.7 Optimization method
The weighted sum of all objectives is used as a numerical optimization method for the average Nu number on the moving curved surface to be maximized. The SHERPA search algorithm is used when running an optimization study. If the number of design variables (m) is less than 10, STAR-CCM+ recommended choosing the minimum design number of runs (N) equal to 10×m to make good progress. Therefore, in the present optimization study, minimum N should be considered equal to 50. To increase the accuracy of results, N is considered equal to 100 [20].
2.7.1 Weighted sum of all objectives
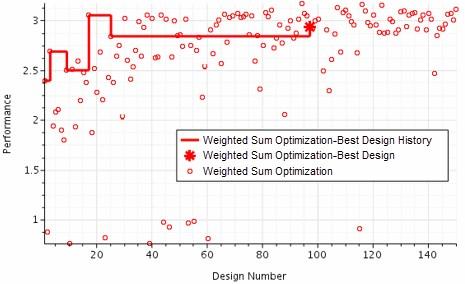
This type of optimization study allows an optimization based on a single objective or based on multiple objectives. For the multiple objectives, a linear weighting is used that combines all objectives into a single performance function. Running a weighted sum of all objectives analysis with multiple objectives returns a single best design. A design performance is based on the value returned for the objectives together with the degree to which a design satisfies its constraints. Once the constraints are satisfied, only the objectives contribute to the evaluation of performance using the following equation (see Figure 4):
$\sum\nolimits_{i=1}^{{{N}_{obj}}}{\frac{LinW{{t}_{i}}.Sig{{n}_{i}}.Ob{{j}_{i}}}{Nor{{m}_{i}}}}-\sum\nolimits_{j=1}^{{{N}_{con}}}{\frac{QuadW{{t}_{j}}.ConViol_{j}^{2}}{Norm_{j}^{2}}}$ (8)
where,
The weighted sum of all objectives optimization uses the SHERPA search algorithm [20].
Figure 4. Weighted sum of all objectives [20]
2.7.2 SHERPA algorithm
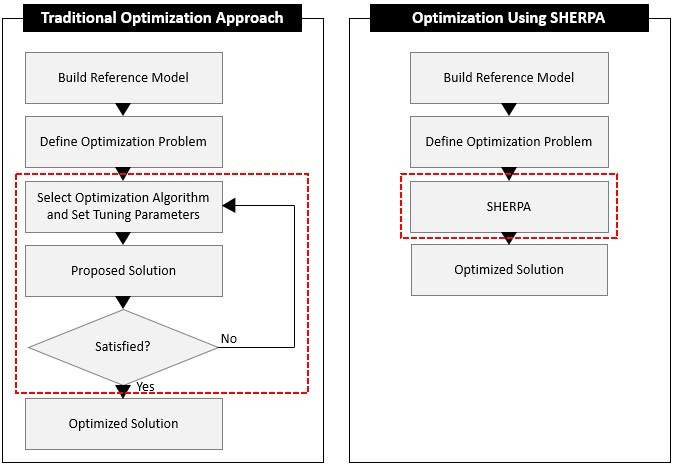
SHERPA algorithm employs multiple search methods simultaneously rather than sequentially. This approach uses the best attributes of each search method. If a particular search method is deemed to be ineffective, this algorithm reduces its participation. While running this algorithm, a combination of global and local search methods is used. At any given time, the number of different methods that are used can range between two and ten. Unlike traditional optimization algorithms that require you to tune parameters manually, the tuning parameters in each method that SHERPA uses are modified automatically during the search. As it learns more about the design space, it determines when and to what extent to use each search method. Therefore, the SHERPA algorithm (Simultaneous Hybrid Exploration that is Robust, Progressive, and Adaptive); a combination of different search methods is used to optimize the efficiency. A comparison between a traditional optimization approach and this approach is displayed below (see Figure 5) [20].
Figure 5. A comparison of a traditional optimization approach and the SHERPA approach [20]
3.1 Evaluation of computational model
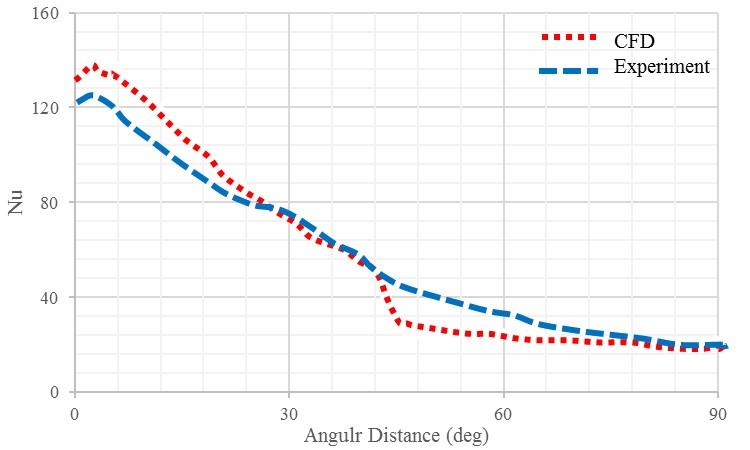
For numerical predictions of multi-jet impingement heat transfer, a quantification of the numerical accuracy is equally significant. Figure 6 indicates the local Nu distributions along the curvilinear axis on the target surface. The CFD results of this work have been compared with the available data of Fenot et al. [22] who investigated the heat transfer due to a row of air jets impinging on a fixed concave surface. Uniform heat flux of 4000 W/m2 was applied to the target surfaces to simulate the condition of the target wall in the experiment. The difference between the experiment and the corresponding values of CFD data is approximately 15% on average. The agreement between the two is very good and closely followed the same trend as the experimental data. The main reason for the sudden decrease of Nusselt number in the numerical simulation results at the angular distance of 45° could be attributed to the flow separation during flow over a curved surface. It can be concluded from the evaluation of the turbulence model concerning the predictions of heat transfer that the computational model (discretization, numerical scheme, turbulence model) represents a good compromise between the accuracy of its results and the computational effort.
Figure 6. Comparison of the local Nu distributions along curvilinear axis on fixed curved surface from experiments [22] and CFD (H/d=5, S/d=4, Re = 23000, Cr=0.1, VR=0)
3.2 Optimization results
3.2.1 Jet Re number
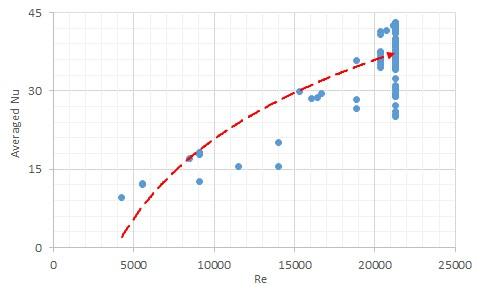
Figure 7 shows the design study with a logarithmic trend line during the numerical optimization for the area-averaged Nu number versus jet Re number. The averaging is done over the total target surface area with three impinging jets on it (central jet and its adjacent jet).
Figure 7. Design study during the numerical optimization for the area-averaged Nu number versus Re
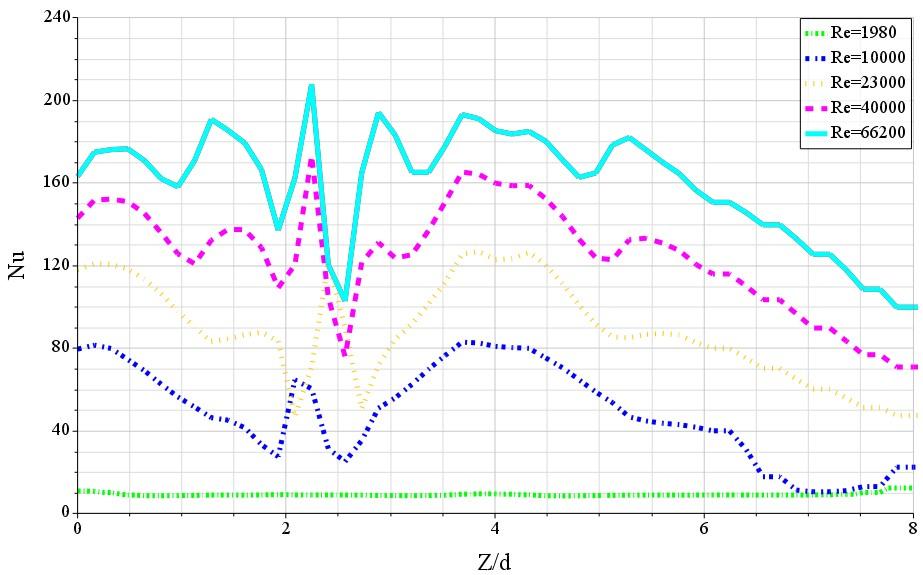
Figure 8. Effects of Re number on the local Nu along Z-axis (H/d=2, S/d=4, and VR=0.28)
Increasing the Re number increases the average Nu number. Because increasing the Re number occurs with increasing the jet exit velocity from the nozzle and finally leads to an increase in the turbulent kinetic energy (see Figure 8). Therefore, the maximum average Nu number is expected to occur at the maximum inlet velocity.
3.2.2 Nozzle to surface distance
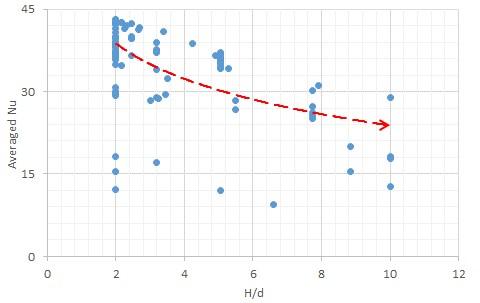
Figure 9 shows the design study with a logarithmic trend line during the numerical optimization for the area-averaged Nu number versus nozzle to surface distance (H/d).
Figure 9. Design study during the numerical optimization for the area-averaged Nu number versus H/d
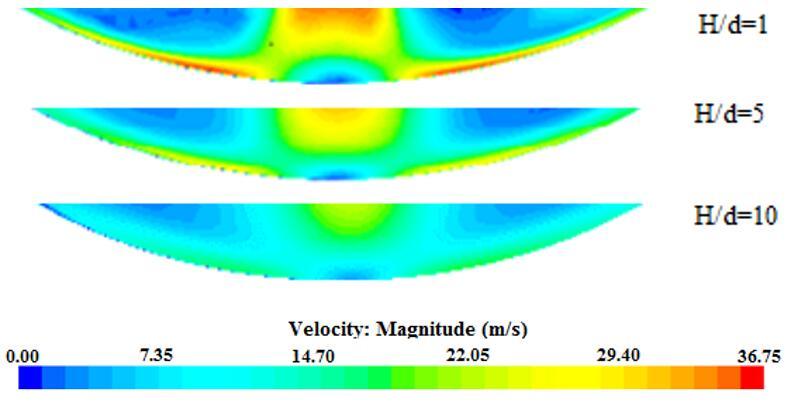
The average Nu number is increasing as the nozzle to surface distance decreases. Increasing the H/d, the momentum exchange between the jet flow and the ambient increases, hence the flow in case of low H/d value has more momentum compared to the higher H/d values (see Figure 10). Therefore, the maximum average Nu number is expected to occur at a minimum H/d value.
Figure 10. Effects of the nozzle to surface distance on the velocity magnitude (Re=23000, S/d=4, VR=0.28)
3.2.3 Jet to jet spacing
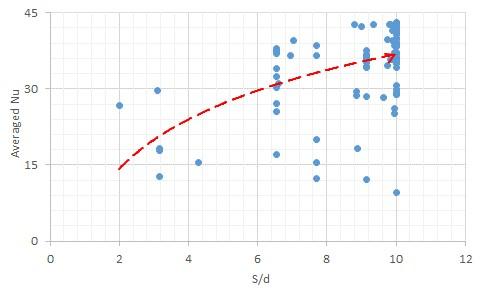
Figure 11 shows the design study with a logarithmic trend line during the numerical optimization for the area-averaged Nu number versus jet to jet spacing (S/d).
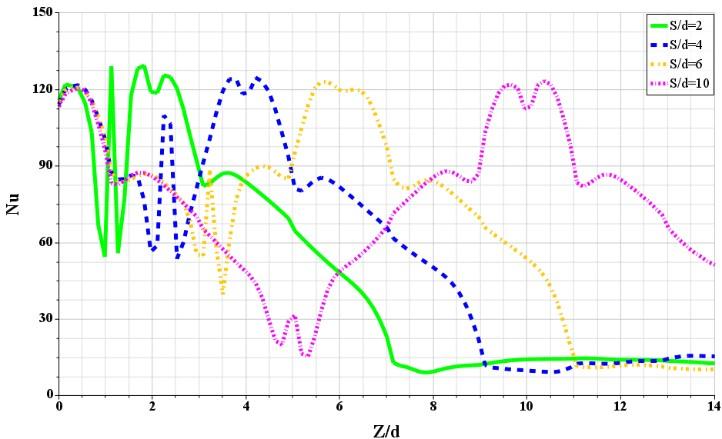
The higher S/d values result in higher average Nu due to the lower jet interaction. Because the wall flows of the two jets are impinging upon each other and forming a new stagnation region. This affects the local distribution of the heat transfer coefficient (see Figure 12). Therefore, the maximum average Nu number is expected to occur at a maximum S/d value.
Figure 11. Design study during the numerical optimization for the area-averaged Nu number versus S/d
Figure 12. Effects of the jet to jet spacing on the local Nu along Z-axis (Re=23000, H/d=2, and VR=0.28)
3.2.4 Jet angle
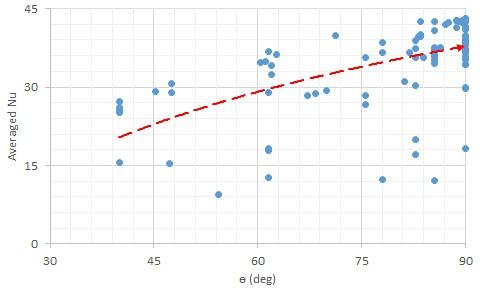
Figure 13 shows the design study with a logarithmic trend line during the numerical optimization for the area-averaged Nu number versus jet angle (θ).
Figure 13. Design study during the numerical optimization for the area-averaged Nu number versus θ
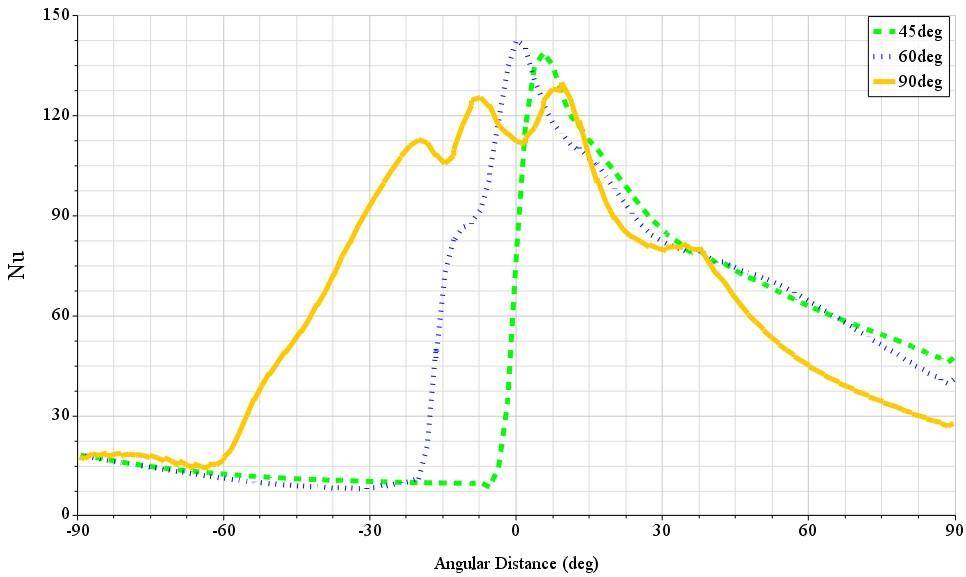
The jet angle is varied between 40° and 90° as measured with respect to the horizontal axes and the case of 90° corresponds to the orthogonal jet. With decreasing the jet angle, the orthogonal component of the jet flow decreases but on the other hand, the flow component parallel to the wall increases having the opposite effect and leads to the more asymmetrical trend for the angled jets than the orthogonal jets impinging on the moving curved surface (see Figure 14). Therefore, when the jet impinging orthogonally on the surface (90°); it can pick up the most heat upon striking the surface. Hence, the surface average Nu number increases with increasing the jet angle and the maximum average Nu number is expected to occur for orthogonal jets (see Figure 13).
Figure 14. Effects of jet angle on the local Nu along the curvilinear axis (Re=23000, H/d=1, S/d=4, and VR=0.28)
3.2.5 Relative surface velocity
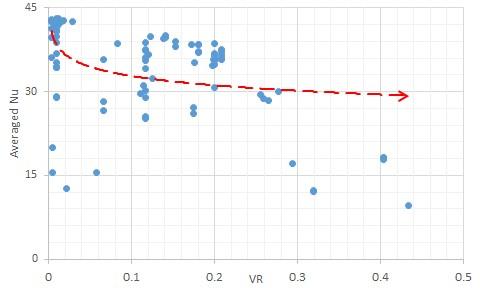
Figure 15 shows the design study with a logarithmic trend line during the numerical optimization for the area-averaged Nu number versus relative surface velocity (VR).
Figure 15. Design study during the numerical optimization for the area-averaged Nu number versus VR
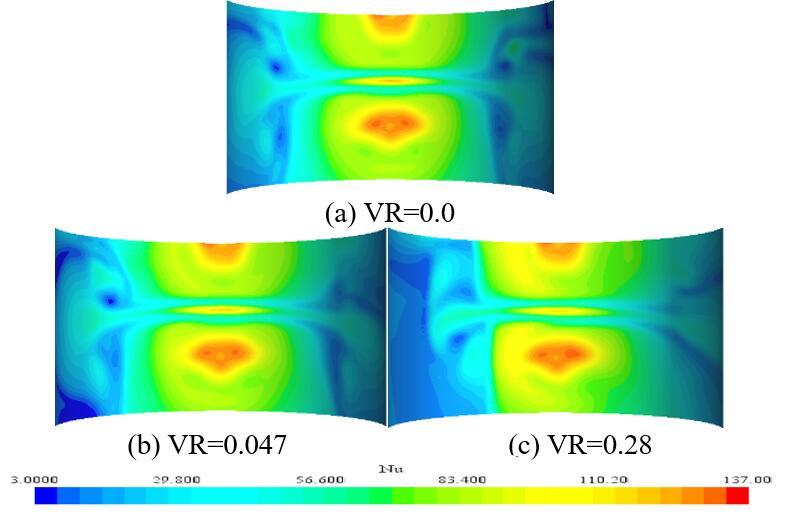
The average Nu number decreases with increasing the relative surface velocity. This is due to the entrainment of the impinging jet by the moving surface which reduces the effectiveness of each jet. For a small velocity ratio (VR=0.0047 and 0.047), the motion has little effect on the local and average Nu number. When the surface velocity is higher, the effect is like that of superposing a crossflow. Thus, the moving surface reduces the effectiveness of each jet and the Nusselt number decreases from the surface motion effects become more pronounced as the velocity ratio increases (see Figure 16). Therefore, the maximum average Nu number is expected to occur at a minimum relative surface velocity.
Figure 16. Nu distributions on the moving curved surface for different velocity ratio (Re=23000, H/d=2, S/d=4)
Table 3 shows a summary of results during the numerical optimization. It can be concluded that the maximum average Nu number correlates with high values of jet inlet velocity (Vj), jet angle (θ) and jet to jet spacing (S/d) and low values of jet to surface distance(H/d) and relative surface velocity (VR). Therefore, the best design study is found at H/d=2, S/d=10, θ =90°, Vj=50m/s and Vw=0.47 for the investigated parameters in the range of H/d=2-10, S/d=2-10, θ =40-90°, Vj=10-50 m/s and Vw =0.17-10 m/s under d=10 mm as shown in Table 3. Generally, the best designs are in the range of H/d= 2-5, S/d= 6.5-10, θ = 60-90°, Vj = 44-50 m/s and Vw = 0.17-7 m/s. These results also have a correlation with literature for optimum value of design parameters for maximum area-averaged Nu number [3, 7, 11, 13, 14, 17].
Table 3. Results during the numerical optimization
|
Objectives |
H/d |
S/d |
θ (deg) |
Vj (m/s) |
Vw (m/s) |
|
Max Nuave |
2 |
10 |
90 |
50 |
0.47 |
3.3 Correlation equation
One correlation for the average Nu number is developed for the single row of jets impinging on a moving curved surface. A multiple regression fit is applied for the development of correlation from the numerical simulation (hundred design points during the numerical optimization):
$N{{u}_{ave}}=0.01{{\operatorname{Re}}^{0.8}}{{(H/d)}^{-0.13}}{{(S/d)}^{0.14}}\theta _{rad}^{0.41}{{(VR)}^{-0.01}}$ (9)
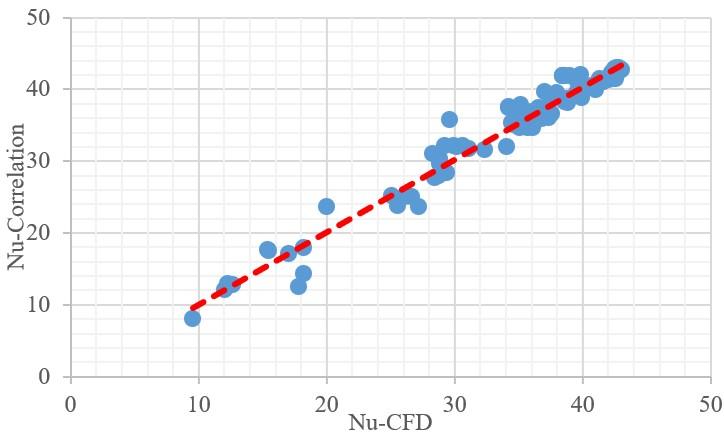
Figure 17. Parity plot showing a comparison between the average Nu predicted by the CFD and developed correlation
The above correlation is proposed in terms of Re, H/d, S/d, θ, and VR as the independent variables for Re number in the range of 4337 to 21685, H/d from 2 to 10, S/d from 2 to 10, θ from 40 to 90° and VR from 0.0034 to 1. The observed trends in numerical optimization are shown by the exponents of the independent parameters in the correlation. The agreement in the prediction of the average Nu number between the numerical simulation and developed correlation is found to be reasonable and all the data points deviate from the correlation by less than 4% (see Figure 17).
The numerical simulations and optimization of multiple circular jets impinging on a moving curved surface are carried out. The commercial CFD package STAR CCM+ is employed with the SST k-ω turbulence model to simulate a real geometry for industrial drying applications. The designer should optimize the design parameters of industrial drying equipment to achieve the maximum heat transfer rate. The optimization has been performed with respect to five design parameters such as jet to surface distance, the spacing between the jets, jet inlet velocity, surface velocity, and jet angle. For the optimization of the impinging jet, the average Nu number on the moving curved surface is set as the objective functions to be maximized. Hundred design points are selected by the SHERPA search algorithm within the design space. One correlation describing the average Nu number has been developed. The agreement in the prediction of the average Nu number between the numerical simulation and correlation is found to be reasonable. The results of this research lead to the theoretical basis for the optimization of industrial drying technology.
|
Af |
open area ratio, total jet area to heat transfer area |
|
ConViolj |
violated amount by j-th constraint |
|
d |
jet exit diameter (m) |
|
h |
heat transfer coefficient (W/m2K) |
|
H |
nozzle to surface distance (m) |
|
i, j, k |
tensor indices |
|
k |
turbulence kinetic energy (J/kg) |
|
kt |
thermal conductivity (W/mK) |
|
LinWti |
linear weight for i-th objective |
|
m |
number of design variables |
|
N |
number of runs |
|
Ncon |
number of constraints |
|
Nobj |
number of objectives |
|
Normi |
normalization value for i-th objective |
|
Normj |
normalization value for j-th constraint |
|
Nu |
local Nusselt number |
|
Obji |
i-th objective |
|
q |
convective heat flux (W/m2) |
|
QuadWtj |
quadratic weight for j-th constraint |
|
Re |
Reynolds number |
|
S |
jet to jet spacing (m) |
|
Signi |
sign for i-th objective |
|
T |
temperature (℃) |
|
Tt |
Reynolds stress tensor |
|
U |
velocity (m/s) |
|
$\overline{\mathrm{U}}$ |
average velocity (m/s) |
|
Ui |
instantaneous components of the velocity vector in the direction Xi (m/s) |
|
$\mathrm{U}^{\prime} \mathrm{i}$ |
fluctuating components of the velocity vector in the direction Xi (m/s) |
|
V |
jet exit velocity (m/s) |
|
X, Y, Z |
coordinates |
|
y+ |
dimensionless wall distance |
|
Greek letters |
|
|
ν |
kinematic viscosity (m2/s) |
|
νt |
turbulent viscosity (m2/s) |
|
ԑ |
dissipation rate (m2/s3) |
|
ω |
specific dissipation rate of turbulence kinetic energy (1/s) |
|
θ |
jet inclined angle with respect to the horizontal axes (deg) |
|
ρ |
density (kg/m3) |
|
δij |
Kronecker delta |
|
Sij |
mean strain rate tensor (m/s2) |
|
Θ |
general scalar variable |
|
$\Gamma_{\Theta}$ |
diffusivity of Θ (m2/s) |
|
Subscripts |
|
|
ave |
average |
|
j |
jet |
|
opt |
optimum |
|
w |
wall |
|
Abbreviation |
|
|
Cr |
curvature ratio; nozzle to surface diameter |
|
CFD |
computational fluid dynamic |
|
GCI |
grid convergence index |
|
VR |
velocity ratio; surface to jet velocity |
|
SST |
shear stress transport |
[1] Etemoglu, A.K., Can, M. (2013). Performance studies of energy consumption for single and multiple nozzle systems under impinging air jets. Heat and Mass Transfer, 49(8): 1057-1070. https://doi.org/10.1007/s00231-013-1137-8
[2] Huang, G.C. (1963). Investigations of heat transfer coefficients for air flow through round jets impinging normal to a heat transfer surface. Journal of Heat Transfer, 85(3): 237-243. https://doi.org/10.1115/1.3686082
[3] Martin, H. (1977). Heat and mass transfer between impinging gas jets and solid surfaces. Advances in Heat Transfer, 13: 1-60. https://doi.org/10.1016/S0065-2717(08)70221-1
[4] Dyban, E.P., Mazur, A.I., Golovanov, V.P. (1980). Heat transfer and hydrodynamics of an array of round impinging jets with one-sided exhaust of the spent air. International Journal of Heat and Mass Transfer, 23(5): 667-676. https://doi.org/10.1016/0017-9310(80)90011-3
[5] Metzger, D.E., Florschuetz, L.W., Takeuchi, D.I., Behee, R.D., Berry, R.A. (1979). Heat transfer characteristics for inline and staggered arrays of circular jets with crossflow of spent air. Journal of Heat Transfer, 101(3): 526-531. https://doi.org/10.1115/1.3451022
[6] Viskanta, R. (1993). Heat transfer to impinging isothermal gas and flame jets. Experimental Thermal and Fluid Science, 6(2): 111-134. https://doi.org/10.1016/0894-1777(93)90022-B
[7] San, J.Y., Lai, M.D. (2001). Optimum jet-to-jet spacing of heat transfer for staggered arrays of impinging air jets. International Journal of Heat and Mass Transfer, 44(21): 3997-4007. https://doi.org/10.1016/S0017-9310(01)00043-6
[8] Can, M., Etemog, A.B., Avci, A. (2002). Experimental study of convective heat transfer under arrays of impinging air jets from slots and circular holes. Heat and Mass Transfer, 38(3): 251-259. https://doi.org/10.1007/s002310100249
[9] Brevet, P., Dejeu, C., Dorignac, E., Jolly, M., Vullierme, J.J. (2002). Heat transfer to a row of impinging jets in consideration of optimization. International Journal of Heat and Mass Transfer, 45(20): 4191-4200. https://doi.org/10.1016/S0017-9310(02)00128-X
[10] Kamal R.M., El sayed Mostafa, M., Abdel Aziz, S.S. (2006). An experimental study of an oblique multiple circular air jets impingement on a flat plate. Eight International Congress of Fluid Dynamics and Propulsion, Egypt.
[11] Heo, M.W., Lee, K.D., Kim, K.Y. (2012). Parametric study and optimization of staggered inclined impinging jets on a concave surface for heat transfer augmentation. Numerical Heat Transfer, Part A: Applications, 61(6): 442-462. https://doi.org/10.1080/10407782.2012.654453
[12] Badra, J., Masri, A.R., Behnia, M. (2013). Enhanced transient heat transfer from arrays of jets impinging on a moving plate. Heat Transfer Engineering, 34(4): 361-371. https://doi.org/10.1080/01457632.2013.717046
[13] Xing, Y., Weigand, B. (2013). Optimum jet-to-plate spacing of inline impingement heat transfer for different crossflow schemes. Journal of Heat Transfer, 135(7): 072201. https://doi.org/10.1115/1.4023562
[14] Specht, E. (2014). Impinging jet drying, modern drying. Technology, 5: 1-26. https://doi.org/10.1002/9783527631704
[15] Attalla, M. (2015). Stagnation region heat transfer for circular jets impinging on a flat plate. Experimental Heat Transfer, 28(2): 139-155. https://doi.org/10.1080/08916152.2013.829134
[16] Zhu, D.M., Wang, Y.T., Zhu, J.H. (2015). Heat transfer characteristics of multinozzle air impingement jet during die steel plate cooling progress. Advances in Mechanical Engineering, 7(2): 698072. https://doi.org/10.1155/2014/698072
[17] Bu, X., Peng, L., Lin, G., Bai, L., Wen, D. (2015). Experimental study of jet impingement heat transfer on a variable-curvature concave surface in a wing leading edge. International Journal of Heat and Mass Transfer, 90: 92-101. https://doi.org/10.1016/j.ijheatmasstransfer.2015.06.028
[18] Bu, X., Peng, L., Lin, G., Bai, L., Wen, D. (2016). Jet impingement heat transfer on a concave surface in a wing leading edge: Experimental study and correlation development. Experimental Thermal and Fluid Science, 78, 199-207. https://doi.org/10.1016/j.expthermflusci.2016.06.006
[19] Yang, B., Chang, S., Wu, H., Zhao, Y., Leng, M. (2017). Experimental and numerical investigation of heat transfer in an array of impingement jets on a concave surface. Applied Thermal Engineering, 127: 473-483. https://doi.org/10.1016/j.applthermaleng.2017.07.190
[20] STAR-CCM+ 13.02.013 user guide by CD-Adapco.
[21] Roache, P.J. (2003). Conservatism of the grid convergence index in finite volume computations on steady-state fluid flow and heat transfer. Journal of Fluids Engineering, 125(4): 731-732. https://doi.org/10.1115/1.1588692
[22] Fenot, M., Dorignac, E., Vullierme, J.J. (2008). An experimental study on hot round jets impinging a concave surface. International Journal of Heat and Fluid Flow, 29(4): 945-956. https://doi.org/10.1016/j.ijheatfluidflow.2008.03.015