Amireh Nourbakhsh* | Souzan Piri | Mohsen Goudarzi | Morteza Bayareh
© 2020 IIETA. This article is published by IIETA and is licensed under the CC BY 4.0 license (http://creativecommons.org/licenses/by/4.0/).
OPEN ACCESS
In the present study, the motion of a droplet in the boundary layer is investigated numerically. Volume of Fluid method is employed to solve the governing equations. It is found that the presence of the droplet leads to an increase in the pressure inside the boundary layer and on the wall. The results show that the droplets create a vortex on the bottom surface. The friction coefficient increases due to the presence of the droplets and is reduced before and after the droplet due to the formation of a vortex. It is concluded that increasing the viscosity and reducing the density at the same time will not affect the velocity and friction coefficient. It is shown that increasing the radius of the droplet increases the stress and thus decreases the boundary layer velocity. As the Reynolds number increases, the amount of surface friction coefficient decreases. By adding nanoparticles into the pure water, surface friction coefficient increases, especially in the region where the droplet is present.
droplet, boundary layer, friction coefficient, Reynolds number, nanofluid
Many of the fluid flows include buoyant particles, which can be seen as rigid or deformable. These particles are called dispersed phases, separated by a common surface from the surrounding environment. The two-phase fluid flows can be divided into a zero-Reynolds-number flow, finite-Reynolds-number flow, and infinite-Reynolds-number flow, which if the particles are rigid; it is classified as a granular flow. The boundary layer is a fundamental concept in transmission phenomena. Multiphase flows refer to flows, including gases, liquids or solids, such as liquid particles or liquid droplets in gases, gas bubbles in liquids, or combinations of these two states. Multi-phase flows are used in most industries, including chemical, petrochemical, aerospace, etc. There are several methods to examine multi-phase flows. Amiri and Mortazavi [1] performed a numerical simulation of sedimentation of deformable droplets in a vertical channel at finite Reynolds numbers. They found that the main mechanism of motion of the droplet is to move towards the channel's axis. When the Reynolds number is relatively low, two different lateral motions, including uniform and oscillating motions, are observed. Lan et al. [2] carried out a numerical study of lateral migration and deformation of white blood cells in a rectangular microchannel and found that microfluidic force could be used to separate droplets with different volume fractions if the surface stress is low and the flow rate is high. Komrokova et al. [3] performed a numerical simulation of deformation and splashing of liquid droplets exposed to simple shear flow using the free energy lattice Boltzmann method. For a wide range of viscosity ratio, the critical capillary number was determined. Bayareh’s group [4-13] studied the two- and three-dimensional numerical simulation of droplets suspended in simple shear and stratified flows at finite Reynolds numbers using front tracking and volume of fluid methods. Nourbakhsh et al. [14] studied the motion of deformable drops in Poiseuille flow at nonzero Reynolds numbers. The density distribution of drops across the channel was studied as a function of the Reynolds number and the Capillary number. Also, the effective viscosity increased with the Reynolds number. Goodarzi and Mortazavi [15] studied the lateral migration of a buoyant drop in a simple shear flow at finite Reynolds numbers. Mortazavi and Tafreshi [16] studied the flow of suspended droplets over an inclined surface at finite Reynolds numbers. They examined the effects of dimensionless parameters such as Reynolds number, Capillary number, and the density ratio on oscillating energy and drop distribution across the channel. The migration of droplets in the Stokes flow was investigated numerically using a boundary integral method by Zhou and Pozrikidis [17]. They studied the suspensions of two-dimensional droplets and found that the droplets with the density ration of one migrate toward the center of the channel. Uddin et al. [18] studied natural convection heat transfer in a flat plate embedded in a porous medium filled with nanofluid. They found that heat transfer increases by increasing the volume fraction of nanoparticles. Rahman et al. [19] investigated mixed convection heat transfer of a nanofluid in the boundary layer of a wedge. They found that the velocity of the nanofluid is less than that of the pure one and the presence of the nanoparticles leads to that the hydrodynamic boundary layer becomes thinner. Arifin et al. [20] simulated forced convection heat transfer of a nanofluid in the boundary layer passing through a horizontal flat plate. Their results showed that TiO2 nanoparticles cause higher heat transfer compared to Cu and Al2O3 nanoparticles. Deswita et al. [21] studied the effects of suction and injection on the boundary layer in a laminar uniform flow on a horizontal plane for a viscous and incompressible fluid.
In the present study, the motion of a droplet in the boundary layer is investigated numerically. Volume of Fluid method is employed to solve the governing equations. The effects of surface tension, the Reynolds number, droplet radius, and addition of nanofluid on the velocity and friction factor coefficient are evaluated.
The boundary layer flow on a flat plate is considered qualitatively. The laminar region begins from the edge of the plate, and its thickness gradually increases. Although the boundary layer is thin, it plays a key role in fluid dynamics. Resistance force exerted on projectiles, compressor efficiency and jet engine turbine, the efficiency of the air inlet of turbojet, etc. depend on the behavior of the boundary layer and its effects on the main stream. Using the Navier-Stokes equations, simplified equations for boundary layer on a flat plane are as follows:
$\frac{\partial u}{\partial x}+\frac{\partial v}{\partial y}=0$ (1)
$u \frac{\partial u}{\partial x}+v \frac{\partial u}{\partial y}=-\frac{1}{\rho} \frac{d p}{d x}+\vartheta \frac{\partial^{2} u}{\partial y^{2}}$ (2)
where, u and v are velocity components in the x- and y-directions. P is the pressure, $\rho$ the density and $\vartheta$ the kinematic viscosity. Volume of Fluid (VOF) equations for phase q are as follows:
$\frac{\partial\left(\alpha_{q} \rho_{q}\right)}{\partial t}+\nabla \cdot\left(\alpha_{q} \rho_{q} \vec{u}\right)=S_{q}+\sum_{p=1}^{n} \dot{m}_{p q}$ (3)
$\begin{aligned} \frac{\partial}{\partial \mathrm{t}}\left(\alpha_{q} \mu_{q} \vec{u}_{q}\right)+\nabla &\left(\alpha_{q} \mu_{q} \vec{u}_{q} \vec{u}_{q}\right) =-\alpha_{q} \nabla p+\nabla \cdot \tau_{q}+\alpha_{q} \rho_{q} \vec{g}_{q} +\sum_{p=1}^{n}\left(\vec{R}_{p q}+\dot{m}_{p q} \vec{u}_{p q}\right) +\alpha_{q} \rho_{q} \vec{F}_{\text {other }}+\vec{T}_{q} \end{aligned}$ (4)
$\frac{\sigma_{f}-\sigma_{n f}}{\sigma_{f}}=b \ln \left(\frac{\varphi}{a}+1\right)$ (5)
where, $\alpha$ is the volume fraction and $\dot{m}$ represents the mass flow rate. Nanofluid equations are [22]:
$a=7.673 \times 10^{-7}$
$b=-7.773 \times 10^{-3}$
$\rho_{n f}=(1-\emptyset) \mu_{f}+\emptyset \mu_{s}$ (6)
$\mu_{n f}=\frac{\mu_{f}}{(1-\varphi)^{2.5}}$ (7)
In these equations f and nf indicate base fluid and nanofluids, respectively. Governing non-dimensional parameters are capillary number, Weber number, Reynolds number, and Bond number:
$C a=\frac{\mu V}{\sigma}$ (8)
$W e=\frac{\rho V^{2} l}{\sigma}$ (9)
$R e=\frac{\rho V l}{\mu}$ (10)
$B o=\frac{\rho g l^{2}}{v}$ (11)
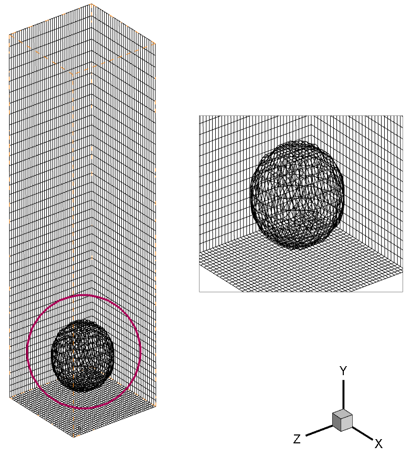
In Figure 1, the geometry of the present problem is shown. Velocity inlet is used as a boundary condition of the input. The output has the boundary condition for zero output pressure. No-slip boundary condition is imposed on the walls. The rest of the sides have symmetric boundary conditions.
Figure 1. Computational domain
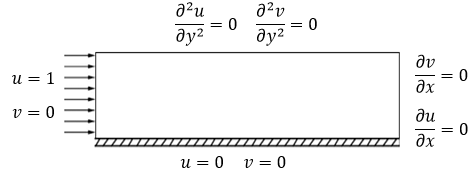
First, the boundary layer and bubble injection are investigated. The boundary layer is examined as a single phase. Figure 2 shows the geometry according to the results of Taeibi-Rahni and Ahmadzadeh [23].
Figure 2. Geometry based on the work of Taeibi-Rahni and Ahmadzadeh [23]
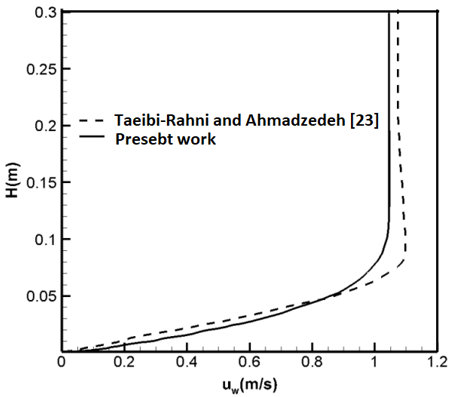
Figure 3 shows the velocity at the outlet. The velocity will initially be zero near the surface due to the greatest stresses. As the distance from the surface decreases, the velocity increases. It finally reaches the inlet velocity. The error between the present results and those of Taeibi-Rahni and Ahmadzadeh [23] is less than 9%.
Figure 3. Velocity in the boundary layer
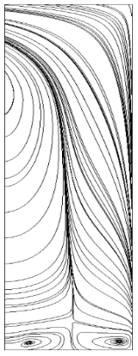
The presence of droplets increases the pressure difference compared to the case in which the droplet is absent. This enhancement is high, especially in the region where the drop is present. After that, the drop splashes at the bottom of the surface, the pressure increases on the bottom surface, and pressure changes occur outside the boundary layer. Also, the pressure output will reach zero at the output. The presence of the droplet causes the boundary layer to disturb. It also causes a non-uniform flow across the boundary layer. The effects of the drop on the streamlines are shown in Figure 4. The presence of droplets has created a vortex in the computational domain.
Figure 4. Streamlines in the presence of a droplet in the boundary layer at t = 1s
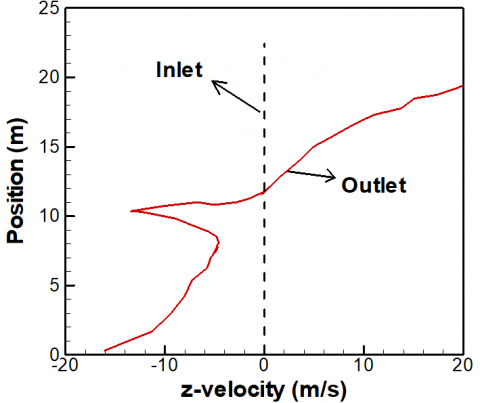
Figure 5 shows z-velocity for input and output at 0.25 seconds. As shown in the figure, the inlet velocity is 0.3029 m/s and has a negative value at the outlet due to the collision of the fluid with the droplet. However, the velocity is then increased. In this section, the effects of the surface friction coefficient disappear and outside of the boundary layer, the change in the velocity process occurs due to the lack of stress. Then, the velocity increases up to 25 m/s.
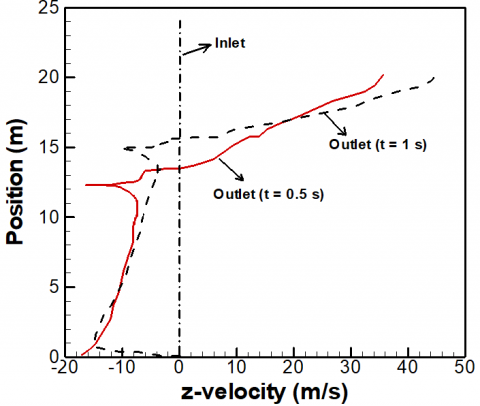
Figure 6 shows the input and output velocities at 0.5s and 1s. At the bottom of the surface, the velocity is first zero, and then the return flow occurs because of the collision of the air with the droplet. With the time when the droplet is placed in higher latitude, the friction coefficient of the surface affects the higher parts, and the thickness of the boundary layer increases. Thus, the velocity increases by up to 40 m/s. The velocity outside the boundary layer has also increased with time.
Figure 5. The variations of z-velocity at t = 0.25 s
Figure 6. The variations of inlet and outlet z-velocity at t = 0.5 and 1
4.1 Effect of surface tension
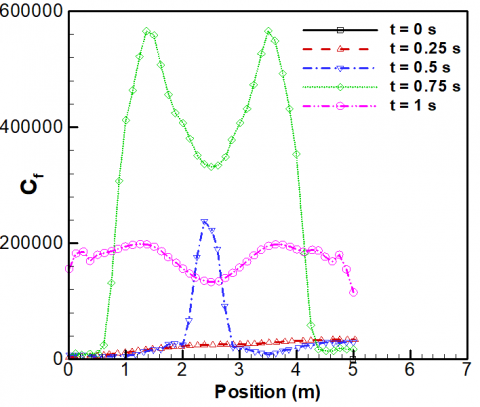
The surface friction coefficient decreases as the flow passes over the flat plate. Figure 7 shows the variation of the friction coefficient at different times. It is found that the presence of droplets leads to an increase in the surface friction coefficient. With the time and the collision of the velocity vectors with the droplet, the effect of the surface friction coefficient increases, especially in the region where the droplet is injected. The collision of the flow with the droplet causes the flow back and the velocity has a negative value. As time increases, maximum and minimum states occur in the droplet region. The surface friction coefficient increases due to the formation of vortices just before and after the droplet, but ultimately it did not increase in the length direction considerably. At the time of 1s, the number of maximum and the minimum and the minimum length increase. The surface friction coefficient along the length decreases from 1.5 × 10⁵ to 1.1 × 10⁵. With the collision between the drop and the bottom, the effect of the droplet has increased.
Figure 7. The variations of surface friction coefficient along the channel length at different times
Now, the changes in the velocity within the boundary layer are evaluated by changing the droplet liquid injected into the continuous fluid. These changes are shown in Table 1. The liquid droplets are water, oil, glycerin, benzene, and mercury.
Table 1. The properties of different liquid droplets
|
σ |
ρ |
µ |
|
|
- |
1.225 |
1.7894×10⁻⁵ |
Air |
|
0.072 |
998.2 |
0.001003 |
Water |
|
0.063 |
960 |
0.048 |
Oil |
|
0.032 |
1259.9 |
0.799 |
Glycerin |
|
0.028 |
875 |
0.000589 |
Benzene |
|
0.465 |
13529 |
0.001523 |
Mercury |
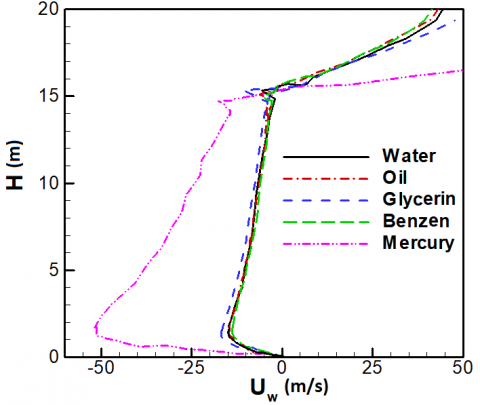
The case where the drop of water is injected into the continuous fluid phase of the air is compared with different droplets after a second (Figure 8). In all cases, the Reynolds is based on a base fluid having a value of 100. A water droplet is injected into the continuous fluid of the air. The air flows at the velocity of 0.3029 m/s over a plate of 5 m in length. The droplet with a radius of one meter in the center of the xz plate and at the height of 2.5 on the bottom is injected inside the boundary layer. The oil droplet is compared with water by decreasing the density and increasing the viscosity. The changes in density and viscosity will not affect the velocity of the boundary layer, and both exhibits almost the same profile. Glycerin droplet is compared with water with increasing density and viscosity, which increases the friction coefficient of the surface and, consequently, decreases the velocity within the boundary layer. Outside the boundary layer, it increases to 50 m/s at a lower altitude. Thus, an increase in the density and viscosity of the droplet results in more resistance than the continuous-phase fluid of the air, leading to a decrease in the velocity of the continuous phase fluid. Water and benzene droplets have been compared. In this case, the viscosity and the density of benzene are less than those of water. Hence, the droplet causes the flow back and the velocity is less negative than the water in the boundary layer. Water and mercury droplets are compared now. The increase in the density of mercury leads to that the velocity value is much more negative, but outside of the boundary layer, the velocity increases. In general, the simultaneous increase in density and viscosity can reduce the velocity. Also, an increase in the viscosity and a decrease in the density at the same time, depending on the amount of changes, will not have effects on the velocity.
Figure 8. The variations of z-velocity for different liquid droplets
4.2 Effect of droplet size
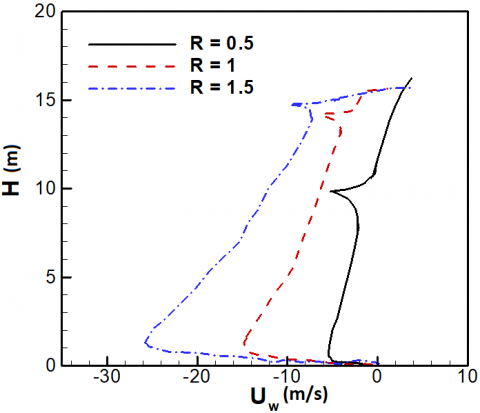
Change the radius of the water drop (0.5, 0.8, 1, and 1.5) is no considered. As shown in Figure 9, the increase in the droplet radius leads to a reduction in the velocity of the boundary layer. Hence, an increase in the volume of the droplet results in an increase in its resistance to continuous phase fluid.
Figure 9. Boundary layer velocity for different radiuses of the water droplet
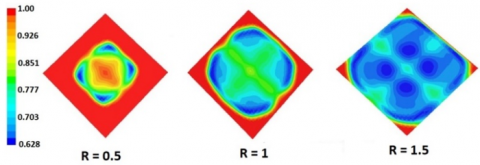
The volume fraction of droplets with different radiuses is presented in Figure 10 at t = 1 s.
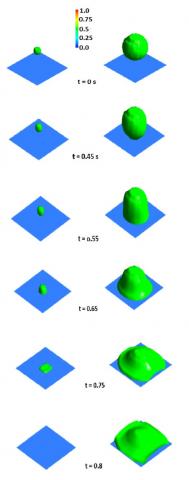
The volume fraction of two-dimensional droplets with different radiuses is shown in Figure 11 at different times. The figure shows how the droplets splash at different times.
Figure 10. The volume fraction of water droplet with different radiuses at t = 1 s
Figure 11. Time evolution of droplets with different radiuses (left 0.5, right 1.5)
4.3 Effect of Reynolds number
For Reynolds numbers larger than one, the Weber number and for Reynolds numbers less than one, the Capillary number will be investigated. Because at small Reynolds numbers, viscous force is important and at high Reynolds numbers, inertial force is dominant.
First, the Reynolds numbers larger than one are considered. Table 2 shows the changes in the Weber number with the Reynolds number.
Table 2. The changes of the Weber number with the Reynolds number
|
We |
σ |
Re |
Uw |
|
19×10-9 |
0.072 |
5 |
1.5×10⁻⁵ |
|
71×10-9 |
0.072 |
10 |
2.9×10⁻⁵ |
|
16×10-8 |
0.072 |
15 |
4.4×10⁻⁵ |
|
71×10-7 |
0.072 |
100 |
0.00029 |
|
32964.3437 |
0.072 |
10000 |
19.685 |
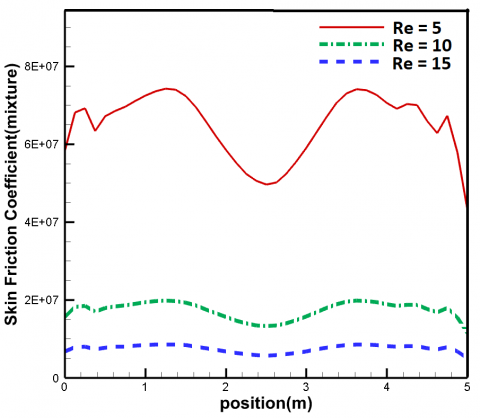
Figure 12 shows that the surface friction coefficient decreases with increasing Reynolds number. In fact, as the velocity increases, the amount of friction coefficient of the surface is reduced. When the inertia is higher than the viscous force, an increase in the Reynolds number leads to a reduction in the friction coefficient of the surface.
Figure 12. The surface friction coefficient for different Reynolds numbers larger than 1
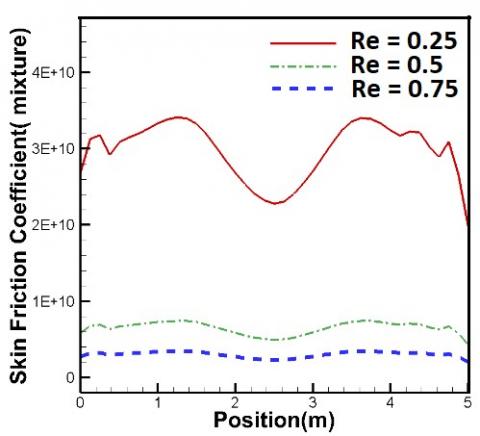
Figure 13. Surface friction coefficient for different Reynolds numbers less than 1
Table 3 shows the changes in the capillary number with the Reynolds number less than one. Figure 13 shows that the surface friction coefficient decreases with increasing the Reynolds number. The surface friction coefficient decreases with the Reynolds number when the inertia force is less than the viscous force.
Table 3. The changes of the capillary number with the Reynolds number
|
Ca |
σ |
Re |
Uw |
|
1.7×10⁻¹⁰ |
0.072 |
0.25 |
0.7×10⁻⁶ |
|
3.7×10⁻¹⁰ |
0.072 |
0.5 |
1.5×10⁻⁶ |
|
5.4×10⁻¹⁰ |
0.072 |
0.75 |
2.2×10⁻⁶ |
4.4 Effect of nanofluid
In this section, water and aluminum oxide/water nanofluid drops are compared. Table 4 presents the properties of water and nanofluid.
The nanofluid with a volume fraction of 4% is considered. Its density, viscosity, and surface tension increase compared to the pure water, leading to a reduction in its velocity. Thus, its velocity in the boundary layer becomes more negative. Outside the boundary layer, there is also a slight increase in velocity at the same height. Thus, outside the boundary layer, when the velocity is equal to the free flow velocity, a larger increase in nanofluid velocity is observed.
Table 4. Properties of water and water/Al2O3 nanofluid
|
σ |
µ |
ρ |
Droplet |
|
0.072 |
0.000891 |
997.1 |
Water |
|
0.078 |
0.00098 |
1116 |
Nanofluid |
This paper investigates the motion of a droplet in the boundary layer numerically. It was found that the presence of the droplet leads to an increase in the pressure inside the boundary layer and on the wall. The results showed that the droplets cause a vortex on the bottom surface.
The friction coefficient increases due to the presence of the droplets. The friction coefficient is reduced before and after the drop due to the formation of a vortex. It can be concluded that increasing the viscosity and reducing the density at the same time will not affect the velocity and friction coefficient. It was shown that increasing the radius of the droplet will increase the stress and thus decrease the boundary layer velocity. As the Reynolds number increases, the amount of surface friction coefficient decreases. By adding nanoparticles into the pure water, surface friction coefficient increases, especially in the region where the droplet is present.
[1] Amiri, M., Mortazavi, S. (2013). Three-dimensional numerical simulation of sedimenting drops inside a vertical channel. Multiph. Flow, 56: 40-53. http://dx.doi.org/10.1016/j.ijmultiphaseflow.2013.05.007
[2] Lan, H., Khismatullin, D.B. (2012). A numerical study of the lateral migration and deformation of drops and leukocytes in a rectangular microchannel. Multiph. Flow, 47: 73-84. http://dx.doi.org/10.1016/j.ijmultiphaseflow.2012.07.004
[3] Komrakova, A.E., Shardt, O., Eskin, D., Derksen, J.J. (2015). Effects of dispersed phase viscosity on drop deformation and breakup in inertial shear flow. Chemical Engineering Science, 126: 150-159. http://dx.doi.org/10.1016/j.ces.2014.12.012
[4] Bayareh, M., Mortazavi, S. (2011). Binary collision of drops in simple shear flow at finite Reynolds numbers: Geometry and viscosity ratio effects. Advances in Engineering Software, 42(8): 604-611. http://dx.doi.org/10.1016/j.advengsoft.2011.04.010
[5] Goodarzi, Z., Ahmadi Nadooshan, A., Bayareh, M. (2018). Numerical investigation of off-center binary collision of droplets in a horizontal channel. Journal of the Brazilian Society of Mechanical Sciences and Engineering, 40: 1-10. http://dx.doi.org/10.1007/s40430-018-1075-y
[6] Armandoost, P., Bayareh, M., Ahmadi Nadooshan, A. (2018). Study of the motion of a spheroidal drop in a linear shear flow. Journal of Mechanical Science and Technology, 32: 2059-2067. http://dx.doi.org/10.1007/s12206-018-0415-2
[7] Bayareh, M., Mortazavi, S. (2011). Effect of density ratio on the hydrodynamic interaction between two drops in simple shear flow. Iranian Journal of Science and Technology, 35: 441-452. http://dx.doi.org/10.22099/ijstm.2011.900
[8] Bayareh, M., Mortazavi, S. (2013). Equilibrium position of a buoyant drop in Couette and Poiseuille flows at finite Reynolds numbers. Journal of Mechanics, 29: 53-58. http://dx.doi.org/10.1017/jmech.2012.109
[9] Bayareh, M., Mortazavi, S. (2009). Geometry effects on the interaction of two equal-sized drops in simple shear flow at finite Reynolds numbers. 5th International Conference: Computational Methods in Multiphase Flow, WIT Trans, 63: 379-388.
[10] Bayareh, M., Mortazavi, S. (2010). Migration of a drop in simple shear flow at finite Reynolds numbers: size and viscosity ratio effects. Proceeding of International Conference on Mechanical, Industriel and Manufacturing Engineering (ICMIME), Cape Town, South Africa.
[11] Mohammadi Masiri, S., Bayareh, M., Ahmadi Nadooshan, A. (2019). Pairwise interaction of drops in shear-thinning inelastic fluids. Korea-Australia Rheology Journal, 31(1): 25-34. https://doi.org/10.1007/s13367-019-0003-8
[12] Bayareh, M., Nourbakhsh, A. (2018). Study of the bubble motion in a compound couette-Poiseuille flow: Effect of the pressure gradient. Advances in Modelling and Analysis A, 55(1): 11-19. https://doi.org/10.18280/ama_a.550102
[13] Bayareh, M., Dabiri, S., Ardekani, A.M. (2016). Interaction between two drops ascending in a linearly stratified fluid. European Journal of Mechanics-B/Fluids, 60: 127-136. http://dx.doi.org/10.1016/j.euromechflu.2016.07.002
[14] Nourbakhsh, A., Mortazavi, S., Afshar, A. (2011). Three-dimensional numerical simulation of drops suspended in Poiseuille flow at non-zero Reynolds numbers. Physics of Fluids, 23: 123303. http://dx.doi.org/10.1063/1.3663565
[15] Goodarzi, S., Mortazavi, S. (2012). Numerical simulation of a buoyant suspending drop in plane Couette flow: the equilibrium position of the drop. Iranian Journal of Science and Technology, Transactions of Mechanical Engineering, 36(M1): 69-82. http://doi.org/10.1016/j.tafmec.2012.02.008
[16] Mortazavi, S., Tafreshi, M.M. (2013). On the behavior of suspension of drops on an inclined surface. Physica A: Statistical Mechanics and its Applications, 392(1): 58-71. http://dx.doi.org/10.1016/j.physa.2012.08.005
[17] Zhou, H., Pozrikidis, C. (1994). Pressure-driven flow of suspensions of liquid drops. Phys. Fluids, 6(1): 80-94. http://dx.doi.org/10.1063/1.868048
[18] Uddin, M.J., Khan, W.A., Ismail, A.I.M. (2012). Free convection boundary layer flow from a heated upward facing horizontal flat plate embedded in a porous medium filled by a nanofluid with convective boundary condition. Transp. Porous Media, 92(3): 867-881. http://dx.doi.org/10.1007/s11242-011-9938-z
[19] Rahman, M.M., Al-Lawatia, M.A., Eltayeb, I.A., Al-Salti, N. (2012). Hydromagnetic slip flow of water based nanofluids past a wedge with convective surface in the presence of heat generation (or) absorption. International Journal of Thermal Sciences, 57: 172-182. http://dx.doi.org/10.1016/j.ijthermalsci.2012.02.016
[20] Arifin, N.M., Nazar, R., Pop, I. (2013). Similarity solution of Marangoni convection boundary layer flow over a flat surface in a nanofluid. Journal of Applied Mathematics. http://dx.doi.org/10.1155/2013/634746
[21] Deswita, L., Nazar, R., Ishak, A., Ahmad, R., Pop, I. (2010). Similarity solution for mixed convection boundary layer flow over a permeable horizontal flat plate. Appl. Math. Comput., 217(6): 2619-2630. http://dx.doi.org/10.1016/j.amc.2010.07.076
[22] Wang, Y., Wu, J.M. (2015). Progress in nuclear energy numerical simulation on single bubble behavior during Al2O3/H2O nano fluids flow boiling using moving particle simi-implicit method. Prog. Nucl. Energy, 85: 130-139. https://doi.org/10.1016/j.pnucene.2015.06.017
[23] Taeibi-Rahni, M., Ahmadzadeh, F. (2011). Numerical simulation of the interaction between a large bubble and a boundary layer. Aerospace Mechanics Journal, 7(3): 91-101.