Mario A. Cucumo | Vittorio Ferraro* | Dimitrios Kaliakatsos | Francesco Nicoletti | Davide Condò
© 2020 IIETA. This article is published by IIETA and is licensed under the CC BY 4.0 license (http://creativecommons.org/licenses/by/4.0/).
OPEN ACCESS
In this work a Solar Thermal Generator is analysed from an energy point of view. It is a dish collector that is part of a concentrating solar grid system. The analysed plant is used for the generation of low enthalpy thermal energy as an integration to the hot water production plant for some student residences of the University of Calabria (Italy). A thermal model is developed that simulates the behaviour of the plant with the aim of analysing its performance and optimizing the design of its fundamental parts from an energy point of view.
The optical model of the solar collector is carried out for a particular external condition. The emissive characteristics of the absorber is determined with the use of a thermal imaging camera. To identify the main parameters that affect the functioning and the thermal balance of the capturing system, a thermo-fluid dynamic analysis is performed. The results show which are the main causes of loss. It is possible to understand the weight of each factor in the energy balance.
performance analysis, solar thermal generator, dish collector, flat mirrors
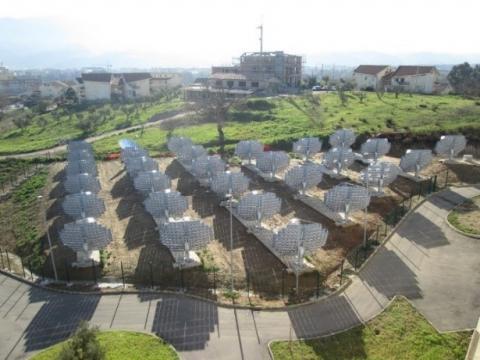
The plant object of this study is located at the University of Calabria (Italy). This study is an overview of a previous paper [1]. Within this university campus, several systems are installed for the exploitation of solar sources and for research [2, 3]. In particular, a field of solar concentrators has been created for the production of thermal energy to integrate the existing hot water production system for some student residences. The same systems are also used for the integration of the air conditioning system of a gym equipped with an absorption heat pump. Figure 1 shows the solar field placed at University of Calabria. The solar concentration plants are systems that are currently widespread and are also interesting for scientific research. The paper by Barlev et al. [4] examines the innovation in CSP technologies over the past decade. The paper by Zhang et al. [5] instead evaluates the different solar concentration systems. Cucumo et al. [6, 7] studied the law of motion of reflectors for a solar plant with linear Fresnel concentration and identified a method to optimally distribute the primary reflectors on the ground. For a linear Fresnel system, the same authors have also proposed a configuration in which the reflectors placed at the ends are movable on two axes. The works cited so far have worked to study the performance of the plant from the theoretical and analytical point of view, but without carrying out a thermo-fluid dynamic analysis.
KalidasaMurugavel et al. [8] focused their attention on receiver shape of five solar concentrating dish configurations. They analysed the performance receiver studying convection heat loss. Spherical, flat, dome, cylindrical and cone shape receivers are modelled with SolidWorks and analysed with CFD simulation. They found out that spherical receiver is the most efficient compared all other cavity receivers.
The research conducted by Bidhendi et al. [9] explore solar dish/Stirling engine system under different climates and operating conditions. They used TRNSYS© to estimate the impact of irradiation flux and ambient temperature on the daily, monthly and seasonal performance of the solar dish-Stirling engine system. The routine has been validated against experimental measurements with an error below 15%.
Yang et al. [10] used CFD simulation applied to a solar plant to analyze the forced air circulation system of a dish concentrator with the aim to reduce the convective heat loss across the aperture. They validated the model with experimental data and numerical results [11].
Figure 1. Solar field at University of Calabria
The economic convenience of using CSPs for the production of domestic hot water has been addressed in the paper by Sagade and Shinde [12] and in the paper Naika et al. [13]. The latter also highlights the need for state incentives to relaunch a technology that paves the way for medium-enthalpy production systems, with temperatures between 100℃ and 250℃.
The relevance of CSPs to absorption heat pumps has been demonstrated through the work of Morciano et al. [14], developed at the Politecnico di Torino (Italy). In the latter, moreover, it is shown how the annual performances of the two-axis concentration systems improve if they are combined with the technologies of the vacuum tube collectors.
The main purpose is to reduce the consumption of fossil fuels used (natural gas) to encourage the adoption of renewable sources and reduce CO2 emissions into the atmosphere. As amply demonstrated in a case study conducted in Nigeria by Okoro and Madueme [15], the need to reduce the consumption of primary energy from fossil sources must be supported by investments in research and development and government incentives.
However, an efficient control system and ongoing maintenance are essential in the use of these technologies, as documented in the work of the Indian Government's Ministry of New Renewable Energy (MNRE) [16].
In the present work the study of a spiral-shaped absorber will be performed. This shape is such as to be able to occupy in the best way the central part of the receiver in order to collect the concentrated solar rays. The particular shape of the absorber creates radial temperature gradients based on the path followed by the fluid. The actual operation is examined by means of a fluid dynamic analysis, in which the passage of a fluid at a known velocity is imposed on the internal side of the pipe, and on the external side the convective heat exchange with air, the radiative heat exchange and the solar flow coming from the mirrors. Thanks to this analysis it will be possible to identify the temperature distribution in the component and estimate the thermal power actually absorbed by the fluid. The paper is organized as follows: first, the concentrator efficiency is estimated to evaluate the power which reaches the receiver; then, the CFD model is introduced, which is exploited to accurately simulate the absorber system. The energy balance is presented in order to evaluate the origin of any loss factor so that it is possible to recognize on which parameters it is possible to act to improve overall efficiency.
The dish collector consists of flat mirrors arranged in a three-dimensional parabolic manner and a receiver inside which there is the absorber in which the heat transfer fluid circulates. In the collector examined in this paper, the absorber is made up of a spiral-shaped coil and the heat-transfer fluid that passes through it is water.
A data acquisition campaign is currently underway for longer operating periods of the solar concentration field in order to validate, in future papers, the models developed with greater precision.
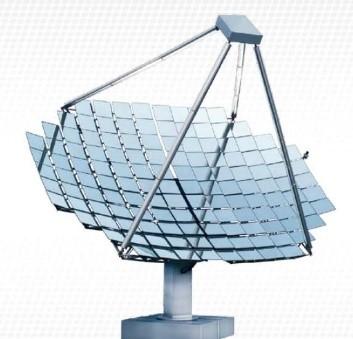
The Solar Thermal Generator, of course, is equipped with hardware and software instrumentation to allow pointing and rotation around two axes to follow the apparent motion of the sun (Figure 2).
Figure 2. Solar dish parabolic concentrator
The basic parameter of the collectors quantifying the achievable heat flow is the concentration ratio C:
$C=\frac{A}{A_{r}}$ (1)
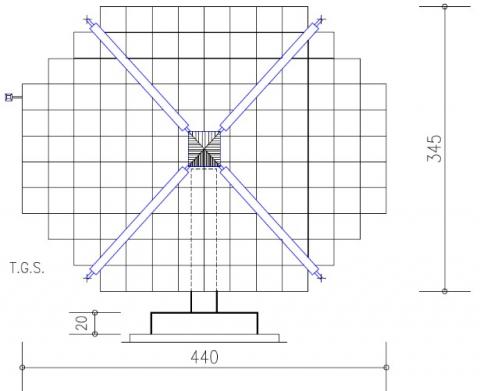
The net concentrating area of the disk is equal to 11.4 m2, and following the apparent movement of the sun, it reflects the sun rays on the Ar area of receiver equal to 0.176 m2 with a concentration ratio equal to 65 suns.
The structure of the capturing system is a paraboloid equipped with 130 flat square mirrors that reflect the parallel rays incident at a single point, called focus (Figure 3).
Figure 3. Geometric configuration
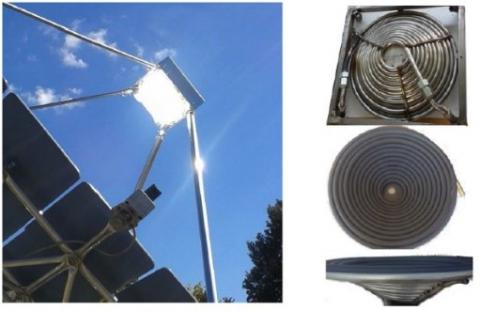
The receiver, placed on the focus of the concentrator, contains the absorber which transfers the radiation coming from the mirrors to the heat carrier fluid, to obtain output temperatures of about 70 ÷ 80℃. The system receiver is made up of a rectangular aluminium body and the collection area of the receiver corresponds to the maximum diameter of the absorber which is constituted by a copper tube wound so as to form a conical spiral (Figure 4).
Figure 4. Receiver and absorber
The power incident on the area occupied by the concentrator is equal to the solar radiation multiplied by the extension of the front surface of the concentrator:
$Q_{\text {sun }}=I_{b n} A_{c} \cos \theta_{i}$ (2)
where, Ac is the gross aperture area of the concentrator, equal to 13.57 m2, $\theta_{i}$ is the incidence angle that is equal to 0° thanks to the solar tracking system. Part of this power is lost due to the shading of the receiver and the spacing of the mirrors. The parameter that takes into account these losses, and that allows to determine the effective power collected by the concentrator is the shading factor E provided by the manufacturer:
$Q_{ {conc }}=Q_{{sun }} E$ (3)
At this point, the power reflected by the concentrator depends exclusively on the average reflection coefficient of the mirrors ρ:
$Q_{ {refl }}=Q_{ {conc }} \rho$ (4)
The manufacturer has estimated that the reflected beam is always intercepted by the square surface of the receiver. The intercept factor S, according to the theory of irradiation and calculation of form factor [17] determines the portion of irradiation coming from the concentrator that actually affects the square area of the receiver. It is considered unitary. Therefore, the power actually incident on the square receiver will be:
$Q_{r e c}=Q_{r e f l} {~S}$ (5)
The thermal power that passes through the glass of the receiver is $Q_{r e c} \cdot \tau$, where $\tau$ is the transmissivity of the glass. In addition, not all of the receiver area is covered by the absorber and there will therefore be areas in which it is not possible to exploit solar radiation. In this regard, the manufacturer has evaluated the possibility of placing four additional reflecting surfaces in the four corners of the receiver in order to increase the reflected radiation. This involves, however, the need to introduce a fire utilization factor FU and, therefore, the power actually incident on the absorber is:
$Q_{a b s}=Q_{r e c} \tau F U$ (6)
Only part of this power is actually absorbed by the absorber surface, which has an absorption coefficient αabs equal to:
$Q_{i n, a b s}=Q_{a b s} \alpha_{a b s}$ (7)
Having known all the parameters of the concentrator, it is possible to write the energy balance of the receiver. Starting from the fundamental equation of the energy balance, valid for all concentration systems, and taking into account the terms relating to the heat exchange in the receiver [18] and considering the intercept factor, we obtain:
$Q_{\text {out }}=E \cdot I_{b, n} A_{C} \cos \theta_{i} \cdot \rho \cdot S \cdot \tau \cdot F U \cdot \alpha_{a b s}$$-Q_{ {conv }}-Q_{ {rad }}$ (8)
The performance of concentrator is evaluated as the ratio between the incident power on the square receiver, Qrec, and the incident power on the collector’s area Ac:
$\eta_{ {conc }}=\frac{Q_{ {rec }}}{I_{b, n} A_{C}}=\frac{E \cdot I_{b, n} A_{C} \cos \theta_{i} \cdot \rho \cdot S \cdot \tau}{I_{b, n} A_{C}}$$=E \cdot \cos \theta_{i} \cdot \rho \cdot S \cdot \tau$ (9)
The efficiency of receiver is evaluated as the ratio between the useful power yielded to the thermo-vector fluid, (Qout), and the solar power that actually affects the square receiver.
$\eta_{r e c}=\frac{Q_{o u t}}{Q_{r e c}}=\frac{\dot{m} c_{p f} \Delta T_{i n-o u t}}{E \cdot I_{b, n} A_{C} \cos \theta_{i} \cdot \rho \cdot S \cdot \tau}$ (10)
The total efficiency of Solar Thermal Generator, evaluated for direct irradiation, is given by the product of concentrator and receiver efficiencies. It is equal to the ratio between the thermal power yielded to the thermo-vector fluid and the solar power in its direct component intercepted by the gross reflective surface of the dish:
$\eta_{t o t}=\eta_{c o n c} \cdot \eta_{r e c}=\frac{Q_{o u t}}{I_{b, n} A_{C}}=\frac{\dot{m} c_{p f} \Delta T_{i n-o u t}}{I_{b, n} A_{C}}$ (11)
For the evaluation of the absorber power, the reflection of the ground and the irradiation emitted by nearby objects are considered negligible; the diffuse component of solar radiation has been neglected because the part of the diffuse radiation that reaches the absorber (directly or reflected by the mirrors) provides a negligible contribution, compared to that provided by direct irradiation.
Table 1 summarises the data used for the power calculation.
Table 1. Data for the power balance of the concentrator
|
Ib,n [W/m2] |
Ac [m2] |
$\boldsymbol{\theta}_{i}$ [rad] |
E [-] |
ρ [-] |
S [-] |
FU [-] |
τ [-] |
αabs [-] |
|
850 |
13.57 |
0 |
0.845 |
0.74 |
1.0 |
0.9 |
1.0 |
0.8 |
With these assumptions, starting from the intensity of the direct irradiation incident on the mirrors of reflecting surface, taking into account the various coefficients of reduction of the incident solar power referred to above, the useful power actually transferred to the absorber is determined.
Table 2 shows the values for the different powers for this specific configuration obtained at the boundary of each component calculated, where,
Qsun is the solar power incident on the mirrors;
Qconc is the actual power collected by the concentrator;
Qrefl is the power reflected by the concentrator;
Qrec is the power incident on the square receiver;
Qabs is the power incident on the absorber;
Qin,abs is the power absorbed by the absorber.
Table 2. Power values in input coming from the sun and absorbed
|
Qsun [W] |
Qconc [W] |
Qrefl [W] |
Qrec [W] |
Qabs [W] |
Qin,abs [W] |
|
11534.5 |
9746.6 |
7212.5 |
7212.5 |
6491.2 |
5193.0 |
The absorber, which is placed inside the receiver, is made up of a spiral-wound tube to increase the heat exchange area and the turbulence of the fluid. The axial section of the pipe is approximately elliptical in order to obtain a better distribution of the solar flow on the pipes, avoiding local temperature peaks. The tube is flexible, thus able to reduce the mechanical stresses due to the thermal expansion of the material. In addition, it is coated with black paint to achieve a high solar absorption coefficient.
The main thermal exchange phenomena that affect the receiver, in addition to the absorbed solar power, are: forced convection of the fluid inside the spiral, irradiation towards the surrounding environment and natural convection outside the tube evaluated on the basis of numerical computation models present in the literature for solar plate concentrators (Kumar and Reddy [19], Samanes et al. [20] and Kumar and Reddy [21]).
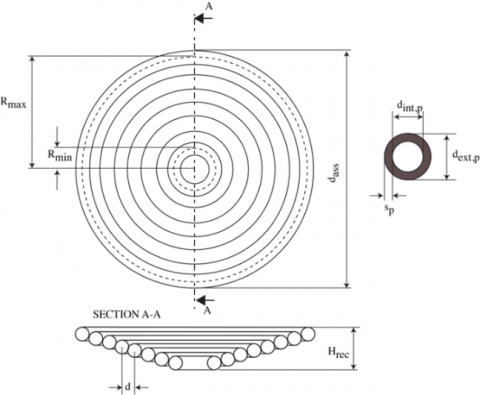
Figure 5 shows the absorber scheme, while Table 3 shows the geometric data of the absorber obtained through measurements made on the real component installed.
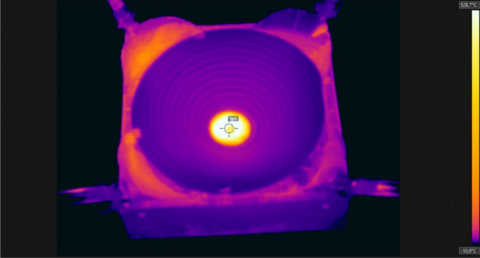
The average emissivity coefficient of the absorber was experimentally measured with the FLIR E75 series thermal imaging camera. This camera has a thermal sensitivity of less than 0.03℃ at 30℃ and an accuracy of ± 2℃.
Figure 5. Simplified absorber scheme
Table 3. Absorber geometric data
|
dabs [m] |
0.42 |
Ns [-] |
13.0 |
|
dext,p [m] |
0.0165 |
Lsp [m] |
9.507 |
|
dint,p [m] |
0.0155 |
Sint,p [m2] |
1.89 x 10⁻⁴ |
|
d [m] |
0.0156 |
AL-int [m2] |
0.463 |
|
sp [m] |
0.001 |
AL-ext [m2] |
0.523 |
|
Rmax [m] |
0.21 |
Hrec [m] |
0.10 |
|
Rmin [m] |
0.022 |
|
|
The emissivity of the mirrors was evaluated using the method of direct measurement of the material temperature measured by a contact thermometer. The temperature of the receiver itself was measured with the camera, aiming at the same point indicated by the contact sensor and the emissivity value was varied until the reading of the same temperature value was obtained. The resulting emissivity is equal to εabs=0.92. Figure 6 shows the thermographic image of the receiver while the plant is not working.
Figure 6. Thermographic image of the receiver
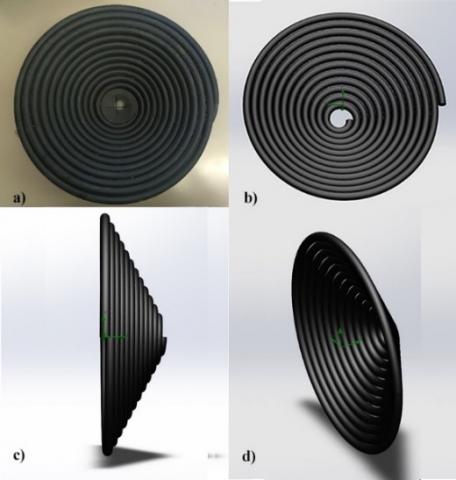
The CFD analysis was conducted for the absorber appropriately modelled within Solidworks Cad environment. Figure 7 shows the various views of the real and modelled absorber.
Figure 7. Absorber views: a) Real component photo, b) CAD model, c) Side view d) Isometric representation
Before running the simulation, it is necessary to make the following simplifying assumptions:
The main phenomena of heat exchange affecting the absorber are:
In this regard, the computational domain is divided into two subdomains, one concerning the heat exchange with the air on the surface of the absorber, the other concerning the exchange between fluid and the internal surface of the absorber.
To perform the simulation, note the geometry of the absorber, we proceeded by setting the boundary conditions:
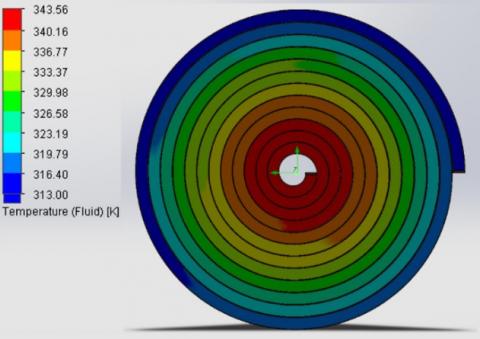
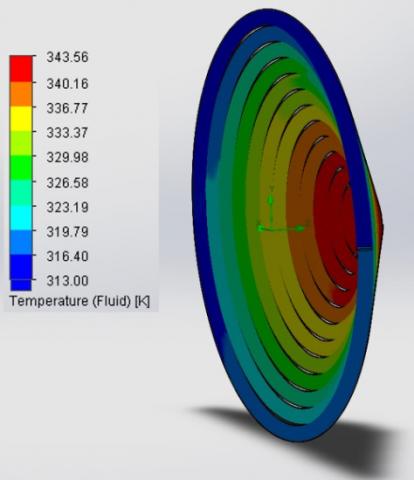
The results obtained are independent of the different meshes used. Several simulations were performed by varying the inlet mass flow. The iterative procedure ends when a temperature difference of about 30℃ of the fluid is reached between the inlet and outlet sections of the spiral. Table 4 shows the values of the different quantities relating to the last iteration that made it possible to obtain a ΔT equal to 29.82℃.
Table 4. Thermal power obtained for ΔT = 30℃
|
Tfin,1 [K] |
Tfout,13 [K] |
ΔT [°C] |
$\dot{\mathrm{m}}$ [kg/s] |
Qout [W] |
|
313.74 |
343.56 |
29.82 |
0.04 |
4993.061 |
Figures 8 and 9 show the surface temperatures for windings obtained by fluid dynamic simulation.
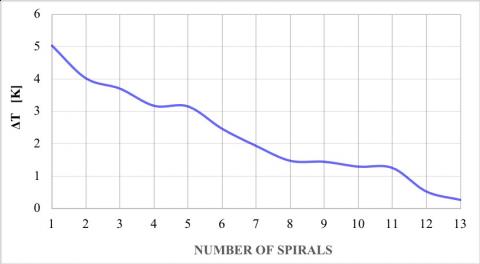
Figure 10 shows the trend of the temperature difference of the heat transfer fluid between the outlet and inlet of each single spiral, in which the outermost winding is numbered with 1 and the innermost one with 13.
Figure 8. Surface temperatures for windings obtained with CFD Simulation. Frontal view
Figure 9. Surface temperatures for windings obtained with CFD Simulation. Isometric view
As expected, the outermost coils of the spiral are those in which there is the greatest exchange effect both in terms of temperature differences and, consequently, in terms of power transferred to the heat transfer fluid, which progressively decrease as the diameter of the winding decreases.
Figure 10. Temperature difference of thermo-vector fluid between output and input of each winding
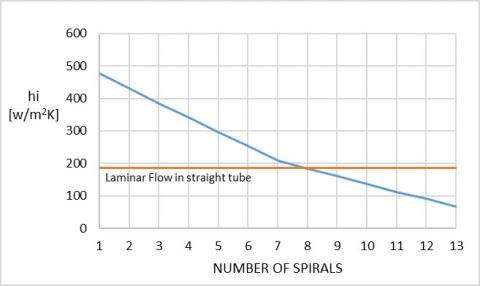
Figure 11 shows the trend of the internal convective heat transfer coefficient hi for each spiral. It is compared with the value obtained with the classical theory of convection in laminar regime [23] of approximately 186 W/m2K.
Figure 11. Inner heat transfer coefficient in each winding
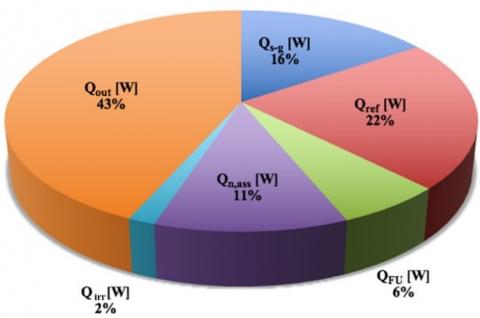
Figure 12 shows the percentages of the various losses on the energy balance resulting from the calculations, where:
Qs-g absorber power lost due to shading and spacing (W) depending on E factor;
Qref absorber power lost due to no ideal reflection (W) depending on mirrors ρ coefficient;
QFU absorber power lost due to low focus coverage (W) depending on FU factor;
Qn,ass absorber power lost due to non-absorption (W) depending on absorber αabs coefficient;
Qirr power lost by radiation (W);
Qconv power lost by convection (W);
Qout power yielded to the thermo-vector fluid (W).
It can be observed that the biggest losses are those related to reflection (22%), mirror spacing and receiver shadow (16%).
From the thermo-fluid dynamics simulation, the different efficiencies have been obtained in Eqns. (9), (10), and (11) and are shown in Table 5.
Therefore, any improvements could be aimed at improving the reflection characteristics of the mirrors in the term ρ (most significant energy loss of all) or at increasing E, at the expense of a modest increase in costs, or going to make changes on the receiver by increasing the factor of use of focus.
Figure 12. Total energy balance
Table 5. Efficiency of the components
|
ηtot |
ηconc |
ηrec |
|
0.43 |
0.63 |
0.68 |
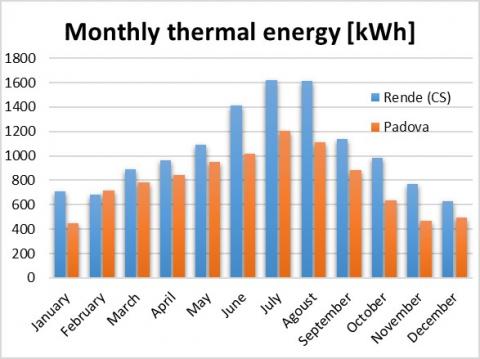
Using the data provided by the PVGIS software, which provides a statistic of the climatic conditions for any zone, a comparison of the concentrator performance is made according to the installation location. The cities examined are Rende (CS) and Padova, areas with rather different environmental conditions.
The only variable parameters in this analysis were therefore exclusively the direct solar radiation and the ambient temperature in order to characterize the concentrator in the same operating conditions.
The results have been reported for each month and highlight the obvious differences deriving from the choice of the two locations, especially as regards the summer months (Figure 13). Overall, in one year the difference between the two installations is around 30% in favor of the location in the south Italy.
Figure 13. Performance comparison for Rende (CS) and Padova
This paper presents the performance analysis of a Solar Thermal Generator with dish collector equipped with flat mirrors for a plant for the production of hot sanitary water. This is part of a park composed of 53 dish collectors at the service of some student residences of the University of Calabria (Italy).
The modelling of the absorber has allowed the evaluation of the performance of plant and it has been possible to carry out the overall energy balance and an evaluation of the efficiency of heat exchange in the absorber thanks to the accuracy offered by the CFD code.
The study allows to observe the temperature distribution of the absorber in order to identify the major points subject to thermal stresses. In particular, in the central part of the spiral, where there is the fluid outlet section, the temperatures are higher, while the average circulation temperature of the fluid is obtained at the fourth winding out of a total of 13.
In order to model the problem accurately, the emissivity of the absorber is identified with a thermographic analysis, a technique capable of detecting the temperatures of the bodies under investigation, by measuring the intensity of infrared radiation emitted.
The analysis made it possible to evaluate the loss factors and identified the construction elements that can be improved.
It was found that the greatest losses (about 38%) are due to the mirrors spacing and their low reflectivity. Improving their optical properties would certainly allow to obtain greater useful powers, such as their distribution on the supporting structure could be optimized. Another important loss factor (about 11%) is represented by the imperfect absorption of solar radiation, this could be improved by using different higher performing heat-absorbing coatings on the absorber surface.
Finally, the importance of the locality in the functioning of this solar concentration technology was investigated by examining different localities. The plant was found to be more performing annually by about 30% if installed in Rende (Italy) and not in Padua (Italy). The city of Rende has a latitude of 39°20', while the city of Padua has a latitude of 45°25' N. The difference between the two solutions becomes greater especially in the summer period.
In a future work, since an experimental data collection campaign is in progress, a more detailed evaluation will be carried out of the performance of the Solar Thermal Generator, but also of the entire domestic hot water system.
The authors thank Project S.r.l. for the support provided for the development of the paper.
|
A |
net absorbing area of the disk, m2 |
|
Aabs |
area of absorber, m2 |
|
Ac |
area covered by mirrors, m2 |
|
AL-int |
total internal lateral area of the coil, m2 |
|
AL-ext |
total external lateral area of the coil, m2 |
|
Ar |
area of receiver, m2 |
|
C |
concentration ratio of concentrator |
|
cpf |
specific heat at constant pressure of thermo-vector fluid, J. kg-1. K-1 |
|
d |
horizontal pitch of the coils, m |
|
dabs |
diameter of absorber, m |
|
dext,p |
outer diameter of the pipe, m |
|
dint,p |
inner diameter of the pipe, m |
|
E |
Shading and spacing coefficient |
|
FU |
focus use factor |
|
hi |
convective heat transfer coefficient, W. m-2. K |
|
Hrec |
depth of receiver, m |
|
Ib,n |
direct irradiation, W. m-2 |
|
Lsp |
length of the mean line of the conical spiral, m2 |
|
$\dot{\mathrm{m}}$ |
Flow rate of thermo-vector fluid, kg. s-1 |
|
Ns |
number of spirals |
|
Qabs |
power incident on the absorber, W |
|
Qconv |
power lost by convection, W |
|
Qconc |
actual power collected by the concentrator, W |
|
Qin,abs |
power absorbed by the absorber, W |
|
Qirr |
power lost by radiation, W |
|
QFU |
absorber power lost due to low focus coverage, W |
|
Qn,ass |
absorber power lost due to non-absorption, W |
|
Qout |
power yielded to the thermo-vector fluid, W |
|
Qout,exp |
experimental power yielded to the thermo-vector fluid, W |
|
Qrec |
power incident on the square receiver, W |
|
Qref |
absorber power lost due to no ideal reflection, W |
|
Qrefl |
Power reflected by the concentrator, W |
|
Qsun |
Solar power incident on the mirrors, W |
|
Qs-g |
absorber power lost due to shading and spacing, W |
|
Rmax |
maximum mean radius of spiral, m2 |
|
Rmin |
minimum mean radius of spiral, m2 |
|
S |
intercept factor |
|
sp |
pipe thickness, m |
|
Sint,p |
inner section of the pipe, m2 |
|
Tamb |
outdoor air temperature, ℃ |
|
Tabs temperature, ℃ |
absorber operating |
|
Tin |
inlet temperature of thermo-vector fluid to the receiver, ℃ |
|
Tfin,1 |
temperature of thermo-vector fluid at the inlet of the first winding, K |
|
Tfout,13 |
temperature of thermo-vector fluid at the outlet of the last winding, K |
|
Tm |
mean temperature between the inlet temperature to the receiver and the outlet temperature of thermo-vector fluid from the receiver, ℃ |
|
Tout |
outlet temperature of thermo-vector fluid from the receiver, ℃ |
|
Greek symbols |
|
|
αabs |
absorber surface absorption coefficient |
|
ΔTin-out |
difference between the input and output temperature, K |
|
εabs |
absorber's emissivity |
|
ηconc |
concentrator performance |
|
ηc,exp |
experimental concentrator performance |
|
ηc,test |
test concentrator performance |
|
ηrec |
receiver performance |
|
ηtot |
overall performance |
|
θi |
angle of irradiation incidence, rad |
|
ρ |
mean coefficient of reflection of mirrors |
|
σ |
Stefan-Boltzmann constant, W. m-2. K-4 |
|
τ |
coefficient of air transmission in the solar spectrum |
[1] Cucumo, M., Ferraro, V., Kaliakatsos, D., Nicoletti, F., Condò, D. (2020). Performance analysis of a solar thermal generator with dish collector equipped with flat mirrors for a plant for the reduction of energy consumption of university residences. TECNICA ITALIANA-Italian Journal of Engineering Science, 64(2-4): 377-384. https://doi.org/10.18280/ti-ijes.642-437
[2] Bevilacqua, P., Morabito, A., Bruno, R., Ferraro, V., Arcuri, N. (2020). Seasonal performances of photovoltaic cooling systems in different weather conditions. Journal of Cleaner Production, 272: 122459. https://doi.org/10.1016/j.jclepro.2020.122459
[3] Bevilacqua, P., Bruno, R., Arcuri, N. (2020). Comparing the performances of different cooling strategies to increase photovoltaic electric performance in different meteorological conditions. Energy, 195: 116950. https://doi.org/10.1016/j.energy.2020.116950
[4] Barlev, D., Vidu, R., Stroeve, P. (2011). Innovation in concentrated solar power. Solar Energy Materials & Solar Cells, 95(10): 2703-2725. https://doi.org/10.1016/j.solmat.2011.05.020
[5] Zhang, H.L., Baeyens, J., Degréve, J., Cacéres, G. (2013). Concentrated solar power plants: Review and design methodology. Renewable and Sustainable Energy Reviews, 22: 466-481. https://doi.org/10.1016/j.rser.2013.01.032
[6] Cucumo, M., Ferraro, V., Kaliakatsos, D., Mele, M., Nicoletti, F. (2017). Law of motion of reflectors for a linear Fresnel plant. International Journal of Heat and Technology, 35(1): S78-S86. https://doi.org/10.18280/ijht.35Sp0111
[7] Cucumo, M., Ferraro, V., Kaliakatsos, D., Nicoletti, F. (2019). Solar tracking system for a linear Fresnel plant with two degrees of freedom reflectors. Italian Journal of Engineering Science, 63(2-4): 143-150. https://doi.org/10.18280/ti-ijes.632-405
[8] KalidasaMurugavela, K., Vivekanandan, M., Kumaran, E.T., Raj, R.S., Shriram, V., Pandian, M.S. (2020). Comparative study on convection loss of different shape solar dish collector cavity receivers at different positions using CFD. Materialstoday: Proceedings. ISSN 2214-7853. https://doi.org/10.1016/j.matpr.2020.09.018
[9] Bidhendi, M.V., Abbassi, Y. (2020). Exploring dynamic operation of a solar dish-stirling engine: Validation and implementation of a novel TRNSYS type. Sustainable Energy Technologies and Assessments, 40: 100765. https://doi.org/10.1016/j.seta.2020.100765
[10] Yang, S., Wang, J., Lund, P.D., Wang, S., Jiang, C. (2018). Reducing convective heat losses in solar dish cavity receivers through a modified air-curtain system. Solar Energy, 166: 50-58. https://doi.org/10.1016/j.solener.2018.03.027
[11] Taumoefolau, T., Paitoonsurikarn, S., Hughes, G., Lovegrove, K. (2004). Experimental investigation of natural convection heat loss from a model solar concentrator cavity receiver. Journal of Solar Energy Engineering, 126(2): 801-807. https://doi.org/10.1115/1.1687403
[12] Sagade, A., Shinde, N. (2012). Performance evaluation of parabolic dish type solar collector for industrial heating application. International Journal of Energy Technology and Policy, 8(1). https://doi.org/10.1504/IJETP.2012.046015
[13] Naika, H., Baredar, P., Kumar, A. (2017). Medium temperature application of concentrated solar thermal technology: Indian perspective. Renewable and Sustainable Energy Reviews, 76: 369-378. https://doi.org/10.1016/j.rser.2017.03.014
[14] Morciano, M., Fasano, M., Secreto, M., Jamolov, U., Chiavazzo, E., Asinari, P. (2016). Installation of a concentrated solar power system for the thermal needs of buildings or industrial processes. Energy Procedia, 101: 956-963. https://doi.org/10.1016/j.egypro.2016.11.121
[15] Okoro, O.I., Madueme, T.C. (2004). Solar energy investments in a developing economy. Renewable Energy, 29(9): 1599-1610. https://doi.org/10.1016/j.renene.2003.12.004
[16] Scheffler Dish based Solar System Operations & Maintenance Manual. (2014). UNDPGEF project on concentrated solar heat. Ministry of New & Renewable Energy (MNRE). Government of India, New Delhi (India).
[17] Bergman, T.L., Incropera, F.P., DeWitt, D.P., Lavine, A.S. (2014). Fundamentals of Heat and Mass Transfer. John Wiley & Sons.
[18] Madadi, V., Tavakoli, T., Rahimi, A. (2014). First and second thermodynamic law analyses applied to a solar dish collector. Journal of Non-Equilibrium Thermodynamics, 39(4): 183-197. https://doi.org/10.1515/jnet-2014-0023
[19] Kumar, N.S., Reddy, K.S. (2007). Numerical investigation of natural convection heat loss in modified cavity receiver for fuzzy focal solar dish concentrator. Solar Energy, 81(7): 846-855. https://doi.org/10.1016/j.solener.2006.11.008
[20] Samanes, J., García-Barberena, J., Zaversky, F. (2015). Modelling solar cavity receivers: A review and comparison of natural convection heat loss correlations. Energy Procedia, 69: 543-552. https://doi.org/10.1016/j.egypro.2015.03.063
[21] Kumar, N.S., Reddy, K.S. (2007). Numerical investigation of natural convection heat loss in modified cavity receiver for fuzzy focal solar dish concentrator. Solar Energy, 81(7): 846-855. https://doi.org/10.1016/j.solener.2006.11.008
[22] Polat, O., Bilgen, E. (2002). Laminar natural convection in inclined open shallow cavities. International Journal of Thermal Sciences, 41(4): 360-368. https://doi.org/10.1016/S1290-0729(02)01326-1
[23] Rohsenow, W., Rohsenow, W.M., Hartnett, J.P., Ganić, E.N. (1985). Handbook of Heat Transfer Applications. McGraw-Hill.