Bing Li | Jiangang Ren | Jianbao Liu | Gaofeng Liu | Runsheng Lv | Zhimin Song*
© 2019 IIETA. This article is published by IIETA and is licensed under the CC BY 4.0 license (http://creativecommons.org/licenses/by/4.0/).
OPEN ACCESS
This paper attempts to disclose the diffusion and migration law of gaseous methane (CH4) in coals of different metamorphic degrees. The representative coal samples, namely, fat coal, lean coal and anthracite, of different metamorphic degrees, were selected as the objects. The pore structure of each coal sample was both qualified and quantified through scanning electron microscopy (SEM) and low-temperature liquid nitrogen adsorption method. In addition, the CH4 diffusion in coal was tested at different temperatures, confining pressures and air pressures, through CH4 diffusion experiments. Based on the experimental data, the author analyzed the influence of pore structure, temperature, confining pressure and air pressure on the gas diffusion speed. The main results are as follows: The coals in different metamorphic degrees have various types of pores with different lengths, and multiple kinds of fractures with different lengths and widths; clay minerals like illite and montmorillonite were found on different coal samples. With the growing metamorphic degree of the coal, the micropores are better developed, the permeability decreases, and the CH4 diffusion in coal slows down; Under the constant temperature and pressure, the CH4 diffusion in coal slows down, with the growth in metamorphic degree of the coal; the CH4 diffusion speed in coal is positively correlated with the temperature, and negatively with confining pressure and air pressure. To sum up, the CH4 diffusion speed in coal is under the combined effects of internal pore distribution and external conditions like metamorphic degree, temperature, confining pressure, and air pressure. Of course, the experiments cannot fully represent the diffusion and migration of coalbed CH4 in coalmines. However, the research results provide a good reference for further studies on gas extraction in coalmines.
diffusion and migration law, methane, pore structure, different metamorphic degrees
For over seven decades, coal remains the foundation of the Chinese energy system, directly driving the growth of national economy, and will continue to dominate the energy system in the foreseeable future. In recent years, coal mining is getting deeper and more intense in China. Meanwhile, the gas problem has become increasingly serious, posing a severe threat to the safe, green and efficient production of coal.
The main component of gas is gaseous methane (CH4). For coalbed CH4 extraction, the key processes include desorption, diffusion and seepage [1]. The CH4 can be extracted from the coalbed almost instantaneously [2]. The migration speed of coalbed CH4 is dependent on the diffusion and seepage processes, and ultimately controlled by the process with the slower speed [3]. Therefore, the diffusion and migration law of coalbed CH4 is a basic problem to be solved in coalmine production.
The coalbed has two types of pore structures, namely, fractures and matrix pores. The fractures can be subdivided into macro-fractures and micro-fractures. The former provides the main channel for gas migration, while the latter bridges up pores and fractures. The coalbed gas is mostly stored and thus mainly diffused in the pores [4-7]. Much research has been done on the micropore structures of coal, yielding fruitful results. Two sets of experimental methods are adopted for these researches, namely, image analysis and test analysis [8-10].
Image analysis methods directly observe or take photos of coal samples, using instruments like optical microscope, scanning electron microscope (SEM), scanning transmission electron microscope (STEM) and atomic force microscope (AFM). The collected photos are processed by computer image processing techniques. Then, the distribution law of micropores and fractures can be derived from the statistics.
In test analysis methods, various pore structure parameters (e.g. pore volume, specific surface area (SSA), median pore size and porosity), are collected by such techniques as density test, mercury intrusion porosimetry (MIP), liquid nitrogen adsorption experiment, nuclear magnetic resonance (NMR), X-ray diffraction (XRD), NMR-based freeze-thaw (F-T) testing [11-14]. It is impossible to reflect all the features of the pore structure in coal with one technique alone. Instead, multiple techniques should be integrated to study the pore structure.
The theoretical analysis of coal dust gas diffusion can be traced back to the 1950s. It is generally agreed that gas diffusion is driven by the concentration difference, i.e. the gas always flows toward the place with relatively low gas concentration, and that the diffusion speed is proportional to the gradient of gas concentration [15-18].
At present, the gas diffusion in coal is mainly characterized by the diffusion coefficient. Different testing methods are employed at home and abroad, depending on the research purpose. Concerning gas outburst, the gas diffusion coefficient in coal dust is often measured by the atmospheric pressure desorption method, in which the diffusion speed is approximated by the adsorption time [19-21].
In the oil and gas industry, the diffusion coefficients of hydrocarbons in rock are usually determined by gas chromatography of regular block samples, based on the principle that the diffusion in rock is driven by the concentration gradient. Specifically, each rock sample is placed between two diffusion chambers; hydrocarbons are introduced into the chamber on one side, and nitrogen into the other chamber; the hydrocarbon concentration in the chambers changes over time under constant temperature, atmospheric pressure and confining pressure; then, the concentration of each component in the chambers is measured at different time points, and the diffusion coefficients of hydrocarbons in rock can be calculated based on the measured data [22].
Compared with the atmospheric pressure desorption method, the approach adopted by the oil and gas industry has a direct theoretical basis, and is therefore adopted for our CH4 diffusion experiments. Despite the fruitful results on the diffusion of coalbed CH4 [23-25], few scholars have probed into the gas diffusion law in coal samples of different metamorphic degrees. In fact, the properties of coal vary greatly with the metamorphic degrees, in terms of formation environment, chemical composition, maceral composition, pore structure, etc. Therefore, it is very meaningful to explore the gas diffusion law in coals of different metamorphic degrees.
Based on previous studies, this paper explores the migration and diffusion law of CH4 in coals of different metamorphic degrees in two steps: measuring the pore structure of each coal sample, and simulating the diffusion of CH4 in coal samples. The research results enrich the theories on gas geology, laying a theoretical basis for the control and development of coalbed gas.
The remainder of this paper is organized as follows: Section 2 introduces the methodology, including sample preparation, the structure and performance of instruments, as well as the processing of experimental data; Section 3 provides the experimental results and carries out analysis and comparison of the results; Section 4 wraps up this research with several meaningful conclusions.
2.1 Sample preparation and proximate analysis
The representative coal samples of different ranks were taken from three different coalmines in China, namely, Zhongmacun mine, Jiaozuo mining area, Henan Province, Tunliu mine, Lu’an mining area, Shanxi Province, and No. 12 mine, Pingdingshan mining area, Henan Province. According to the parameters of proximate analysis, each type of coal samples was divided into medium- and high-rank groups, in ascending order of metamorphic degree.
The coal samples all belong to the Late Paleozoic Shanxi Formation in the south-central part of the Trans-North China Orogen. The samples were uniformly ground into 60~80 mesh particles (particle size: 0.215mm), dried for 6h at 70°C in a drying oven, cooled to room temperature (21℃), and sealed up for further use [11]. The macroscopic evaluation results of the coal samples are displayed in Table 1.
Table 1. The macroscopic evaluation results of the coal samples
|
Coal samples |
Macroscopic physical properties of coal samples |
General description |
||
|
Gloss |
Structural feature |
Try-hand strength |
||
|
Fat coal |
Bright |
Layered structure, block structure, clear and obvious strip |
Rigidity, hard to break with the hand |
The coal body is complete and hard, and the stratification is clearly visible. The primary strip structure is well preserved, and the fracture is smooth and flat with a stepped shape. The endogenous fractures develop and are relatively stable. The fracture density is 2 strips per 5cm. |
|
Lean coal |
Semibright |
The primary structure is well preserved without the obvious signs of extrusion and sliding, and the cracks are not developed |
Rigidity, hard to break with the hand |
The burnish is not strong and black, and the texture is hard. The fracture is stepped. The composition of coal petrography is mainly bright coal. The cutting surface is not smooth and the bedding is developed. The fracture density is 2 strips per 5cm. |
|
Anthracitic coal |
Bright |
The primary bands are obvious and there is no displacement between blocks |
Rigidity, hard to break with the hand |
The burnish is strong and black gray, and the texture is hard. The fracture is stepped, and the two groups developed vertical bedding. The fracture density is 3 strips per 10cm. |
According to the Chinese National Standard Proximate Analysis of Coal (GB/T212-2008), the dry 60~80 mesh coal particles were tested by an SDLA618 proximate analyzer to measure their vitrinite reflectance, maceral composition, proximate composition, true density, apparent density and porosity. The test results are recorded in Tables 2 and 3.
Table 2. The vitrinite reflectance and maceral composition of coal samples
|
Coal samples |
origins |
Stratum/ Coal seams |
Ro,max/% |
Macerals/% |
|||
|
Vitrinite |
Exinite |
Inertinite |
Mineral |
||||
|
1# |
No.12 mine of Pingdingshan |
P1s/Two1 |
1.14 |
82 |
6 |
9 |
3 |
|
2# |
Wuyang mine of Lu’an |
P1s(3#) |
2.10 |
89 |
2 |
7 |
2 |
|
3# |
Zhongma village mine of Jiaozuo |
P1s/Two1 |
3.38 |
90 |
Trace |
7 |
3 |
|
Coal samples |
Industrial analysis |
ARD/(g/cm3) |
TRD/(g/cm3) |
Porosity/% |
|||
|
Mad/% |
Ad/% |
Vdaf/% |
(FC)ad/% |
||||
|
1# |
0.81 |
9.24 |
29.13 |
78.23 |
1.34 |
1.4 |
4.29 |
|
2# |
1.22 |
16.37 |
12.96 |
69.63 |
1.50 |
1.40 |
6.67 |
|
3# |
2.97 |
9.01 |
6.53 |
83.15 |
1.50 |
1.57 |
4.46 |
2.2 Pore structure experiments
2.2.1 Low-temperature liquid nitrogen adsorption
The low-temperature liquid nitrogen adsorption experiment was performed on an ASAP 2020 Accelerated Surface Area and Porosimetry System (Micromeritics, US).
Using the static volumetric method and the adsorption principle (especially that of nitrogen gas), this instrument can determine the pore volume, SSA, pore size distribution, mesopore volume and area, micropore volume and area, isothermal adsorption and desorption hysteresis.
To ensure the accuracy of analytical tests, the instrument has a device to stabilize the level of liquid nitrogen, namely, an isothermal jacket. There are two degas stations and an analysis station in the instrument. Each station is equipped with an independent vacuum system. Specifically, the analysis station has a two-stage mechanical pump and a molecular vortex pump, while each degas station has a two-stage mechanical pump. The mechanical pump can be oil-free. Both types of stations can operate fully automatically.
The instrument can measure any SSA equal to or greater than 0.0005m2/g, capture the pore size between 0.35nm and 500nm, identify the micropore as small as 0.02nm, and detect any pore volume equal to or greater than 0.0001mm3/g [12].
2.2.2 SEM
The micropores of the coal samples were observed by a Sigma500 field emission SEM (Gemini Optics, US), whose resolution is more than 0.8nm. Three detectors are available to acquire the images of different samples, such as InLens, SE2 and BSD. For example, a gold-plated coal sample can be observed under the SEM with a back-scattered electron (BSE) detector and an energy dispersive spectroscopy (EDS) system. The resulting electronic images reflect the topological changes, while the BSE images reflect changes in mineral composition. Together, these images provide important information about the changes of the entire sample, and the position of pores. To identify the pore growth in coal, the author decided to directly observe the fresh section of coal samples.
2.3 Diffusion experiments of CH4 in coal
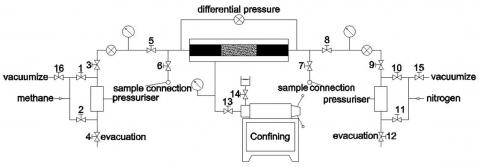
To identify the CH4 diffusion features in the coal samples, regular block samples were subjected to gas chromatography, and the diffusion process was simulated systematically based on the principle that CH4 diffuses freely in the sample under the concentration gradient. Each coal sample was placed between two diffusion chambers. Then, CH4 was introduced into the chamber on one side, and N2 into the chamber on the other side. No pressure difference between the two chambers was allowed throughout the experiments. Under constant temperature and pressure conditions, the concentration of each component changed over time, and was measured at different time points. Based on the measured data, the diffusion coefficients of CH4 and N2 in the coal sample were computed. The device of the diffusion experiment is illustrated in Figure 1 below.
Figure 1. The device of the diffusion experiment
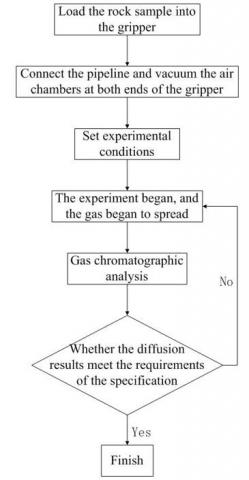
As shown in Figure 2, each diffusion experiment was carried out in the following steps: First, load the coal sample to be tested to the core holder at a constant temperature, install and fix the chambers and pipelines, and apply a preset ambient pressure. Next, empty both chambers with an evacuator; once the chambers are fully evacuated, introduce high-purity CH4 and N2 of equal pressure into the two chambers separately across the coal sample, and adjust the pressure of the two chambers to the designed pressure. Then, turn off the high-pressure inlet and outlet valves, kicking off the diffusion process. After a period, take gas samples from the two chambers by exhaust gas extraction, and perform gas chromatography on the gas samples. If CH4 has completely diffused, evacuate the chambers again, change the experimental conditions, and conduct measurement of diffusion coefficients under the new conditions; otherwise, wait for further diffusion of CH4.
Figure 2. Flow of the diffusion experiment
2.4 Calculation and processing of experimental data
2.4.1 Calculation and processing of the SSA and pore volume
(1) Test principle of the SSA
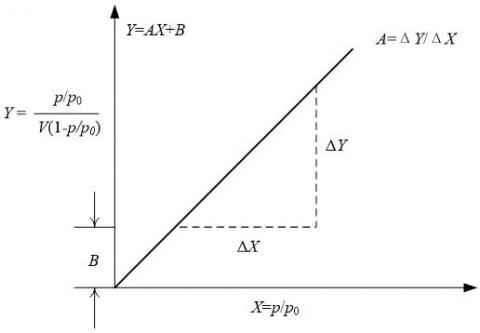
The SSA refers to the total surface area of 1g solid substance. By low-temperature liquid nitrogen adsorption method, the energy of N2 molecules decreases at -195.8℃. Under the van der Waals force, the adsorption equilibrium can be achieved nearly on the single molecular layer (monolayer). In this case, the adsorption amount is directly proportional to the adsorption surface area. According to the relationship between the adsorption pressure and the adsorption amount, the SSA of the target substance can be calculated based on the adsorption amount of the known SSA. The monolayer adsorption amount, Vm (mL), can be derived from the Brunauer-Emmet-Teller (BET) theory of isothermal adsorption (Figure 3):
$\frac{p / p_{0}}{V\left(1-p / p_{0}\right)}=\frac{C-1}{V_{m} C} \times p / p_{0}+\frac{1}{V_{m} C}$ (1)
where, V is the amount of adsorbed gas (mL); p is adsorbate pressure (Pa); p0 is the saturated vapor pressure of adsorbate (Pa); C is a constant.
Let $Y=\frac{\frac{p}{p_{0}}}{V\left(1-\frac{p}{p_{0}}\right)}, X=p / p_{0}, A=\frac{c-1}{V_{m} c}$ and $B=\frac{1}{V_{m} c},$ i.e.:
$Y=AX+B$ (2)
From (1) and (2), we have:
${{V}_{m}}=\frac{1}{A+B}$ (3)
Then, the Langmuir monolayer adsorption SSA, Sg (m2/g), can be computed by:
${{S}_{g}}=\frac{4.36\cdot {{V}_{m}}}{W}$ (4)
where, W is the sample mass (g); Vm is the saturated adsorption amount (mL).
Substituting (3) into (4), the SSA of the sample can be obtained as [6]:
${{S}_{g}}=\frac{4.36}{W(A+B)}$ (5)
Figure 3. The BET isothermal adsorption model
(2) Test principle of pore size distribution
To measure the pore size distribution, the BET method for SSA measurement was extended based on the isothermal adsorption curve of N2:
When gas molecules are in contact with the solid surface, some of them will be adsorbed on the solid surface. The gas will desorb if the free field potential energy of the solid surface is insufficient to overcome the internal energy of gas molecules. Once the adsorption and desorption reach the same speed, the gas molecules achieve the adsorption equilibrium on the solid surface.
At the temperature of the liquid nitrogen, the amount of N2 adsorbed on the solid surface depends on the relative pressure (p/p0) of the adsorbate. If 0.05<(p/p0)<0.35, the relationship between adsorption amount and p/p0 obeys the BET equation for isothermal adsorption; If p/p0≥0.35, the N2 molecules will condense in the micropores; If p/p0≤0.05, the number of N2 molecules is too far from the number required for multilayer adsorption, making it difficult to achieve the adsorption equilibrium.
The change rate of pore volume with pore sizes can be measured through experimental and theoretical analysis. The pore size distribution can be determined by gas adsorption method, using the capillary condensation phenomenon and the principle of volume equivalent exchange (the amount of liquid nitrogen that fills up the target pore is equivalent to the pore volume). The capillary condensation refers to the phenomenon that steam condenses into a liquid in the capillary, because it has reached the saturated or supersaturated state relative to the concave liquid surface in the capillary, while the steam over the horizontal liquid surface has not yet reached the saturated state [12].
2.4.2 Calculation of CH4 diffusion speed in coal
The diffusion coefficient (D/cm2/s) is an important indicator of the gas diffusion capacity in coal. If the diffusion speed through a unit area per unit time is proportional to the concentration gradient, then the diffusion speed depends only on the distance and has nothing to do with time. This diffusion pattern is called (quasi) steady-state diffusion, which obeys Fick’s first law of diffusion. If the diffusion flux of coalbed CH4 changes with both time and distance, the diffusion pattern is called an unsteady-state diffusion, and can be described by Fick’s second law of diffusion [24].
Therefore, the diffusion coefficient, D (cm2/s), of CH4 can be computed by Fick’s second law of diffusion:
$D=\frac{\ln (\Delta {{C}_{0}}/\Delta {{C}_{i}})}{B({{t}_{i}}-{{t}_{0}})}$ (6)
where, $\Delta C_{0}$ is the initial concentration difference between the CH4 in the two diffusion chambers (%); $\Delta C_{i}=C_{1 i}-C_{2 i}$ is the concentration difference between the CH4 in the two diffusion chambers at time i(%);$C_{1 i}$ is the CH4 concentration in the CH4 diffusion chamber at time i(%);$C_{2 i}$ is the CH4 concentration in the N2 diffusion chamber at time i(%); A is the cross-sectional area of the coal sample (cm2); L is the length of the coal sample (cm); V1 and V2 are the volumes of the CH4 diffusion chamber and the N2 diffusion chamber, respectively (cm3); $B=A\left(1 / V_{1}+1 / V_{2}\right) / L$.
3.1 Pore characterization
3.1.1 Pore volume and the SSA
In this research, the low-temperature liquid nitrogen adsorption method can accurately calculate the structure parameters of pores between 2nm and 361nm in the coal samples. The pores in the coal samples were divided into four levels by the decimal classification method of ходот (1961): large pores (Ф>1,000nm), medium pores (1,000nm≥Ф>100nm), transition pores (100nm≥Ф>10nm), and micropores (10nm≥Ф>2nm). The pore volume, the SSA and percentage of each type of pores in our samples are listed in Tables 4 and 5.
Table 4. Pore volumes measured by low-temperature liquid nitrogen adsorption method
|
Coal types |
Samples |
Ro,max(%) |
Pore volume(ml/g) |
The rate of pore volume (%) |
|||||
|
V2 |
V3 |
V4 |
Vt |
V2/Vt |
V3/Vt |
V4/Vt |
|||
|
Fat coal |
1# |
2.09 |
0.0018 |
0.0020 |
0.0032 |
0.0070 |
25.71% |
28.57% |
45.71% |
|
Lean coal |
2# |
2.11 |
0.0015 |
0.0019 |
0.0040 |
0.0074 |
20.27% |
25.68% |
54.05% |
|
Anthracitic coal |
3# |
2.13 |
0.0013 |
0.0022 |
0.0042 |
0.0077 |
16.88% |
28.57% |
54.55% |
As shown in Table 4, the total pore volume of coal sample 1# was 0.0070mL/g. The pores in this sample are mainly micropores (45.71%), followed in turn by transition pores (28.57%) and medium pores (25.71%); the total pore volume of coal sample 2# was 0.0074mL/g. The pores in this sample are mainly micropores (54.05%), followed in turn by transition pores (25.68%) and medium pores (20.27%); the total pore volume of coal sample 3# was 0.0077mL/g. The pores in this sample are mainly micropores (54.55%), followed in turn by transition pores (28.57%) and medium pores (16.88%). The above results show that the medium-rank fat coal, high-rank lean coal and anthracite have the same pore volume distribution: micropores have the dominance, followed by the transition pores, leaving only a small presence for medium pores. The more the micropores, the higher the total pore volume. This is a typical features of pore volume distribution in medium and high-rank lean coal.
Table 5. Pore SSAs measured by low-temperature liquid nitrogen adsorption method
|
Coal types |
Samples |
Pore specific surface area(m²/g) |
The rate of pore specific surface area (%) |
|||||
|
S2 |
S3 |
S4 |
St |
S2/St |
S3/St |
S4/St |
||
|
Fat coal |
1# |
0.041 |
0.4191 |
5.018 |
5.4781 |
0.75% |
7.65% |
91.60% |
|
Lean coal |
2# |
0.036 |
0.3861 |
5.274 |
5.6961 |
0.63% |
6.78% |
92.59% |
|
Anthracitic coal |
3# |
0.029 |
0.4002 |
5.783 |
6.2122 |
0.47% |
6.44% |
93.09% |
As shown in Table 5, the total SSA of coal sample 1# was 5.4781m²/g. The SSA of micropores accounts for the largest proportion (91.60%), followed in turn by the SSA of transition pores (7.65%) and the SSA of medium pores (0.75%); the total SSA of coal sample 2# was 5.6961m²/g. The SSA of micropores accounts for the largest proportion (92.59%), followed in turn by the SSA of transition pores (6.78%) and the SSA of medium pores (0.63%); the total SSA of coal sample 3# was 5.783m²/g. The SSA of micropores accounts for the largest proportion (93.09%), followed in turn by the SSA of transition pores (6.44%) and the SSA of medium pores (0.47%). To sum up, the micropores contribute the most to the total SSA (>90%), whether in the medium-rank fat coal, high-rank lean coal or anthracite.
3.1.2 SEM-based pore feature analysis
There are lots of matrix pores between coal particles. These matrix pores are extremely small, due to the fineness of coal particles. The coals of different metamorphic degrees vary greatly in the shape and size of particles and matrix pores. Therefore, the coal of each metamorphic degree has its unique porosity, SSA and gas diffusion features.
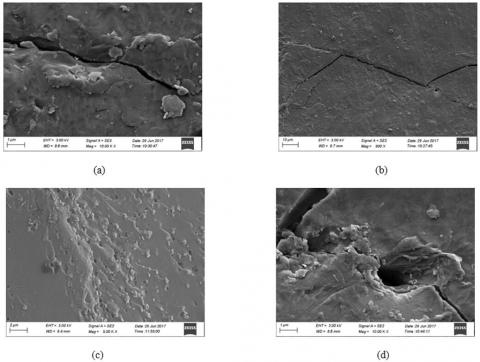
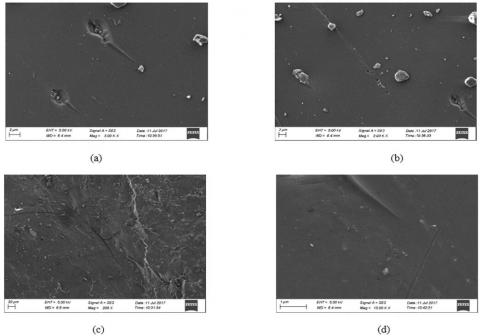
(1) Fat coal (1 #)
As shown in Figure 4, coal sample 1# exhibited micro-factures and micropores under the SEM. In the high-precision SEM image, cave-like pores and streak-like pores appeared on the surface of the sample. These pores are mainly the air vents developed in the coal formation. On the inner edges of cave-like pores, near-circular cavities may develop, ranging in diameter from 200nm to 2,000nm. Petal-like laminated structure was observable after partial enlargement. The streak-like pores look like tadpoles, which are 20μm long and 2-3μm at the widest point.
The micro-fractures mainly concentrated in the microscopic stripes of homogeneous vitrinite and phyllovitrinite with scattered pores of residual cells. There are both relaxation fractures and tension fractures. With varied lengths, the micro-fractures were mainly distributed as thin slits or narrow segments, which are 50-500nm in width. The distribution is highly uneven. Most of the micro-fractures developed in parallel and were perpendicular to the stratum. Overall, coal sample 1# had a few narrow micro-fractures, without any penetrating micro-fracture or large macro-fracture.
There are many impurities on the coal sample, including clay minerals like floc illite and irregular flaky montmorillonite. These clay minerals can expand rapidly in contact with water.
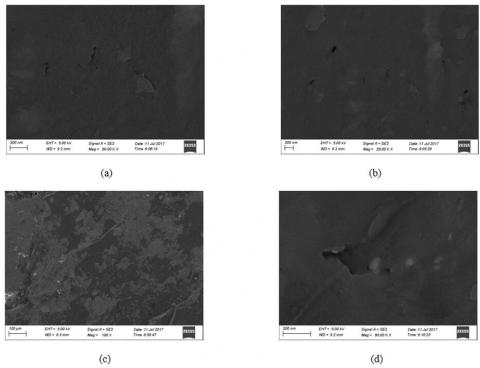
(2) Lean coal (2#)
As shown in Figure 5, coal sample 2# exhibited micro-factures and micropores under the SEM. In the high-precision SEM image, cave-like pores and streak-like pores could be seen on the surface of the sample. These pores are mainly the air vents developed in the coal formation. The streak-like pores look like tadpoles, which are 20μm long and 2-3μm at the widest point. Compared with streak-like pores, the cave-like pores were small and deep, with a diameter ranging from 50nm to 200nm. The edges of cave-like pores were clear, without laminated or petal-like structure.
The micro-fractures mostly belonged to the microscopic stripes of homogeneous vitrinite and phyllovitrinite with scattered pores of residual cells. The tension fractures were developed, while the relaxation fractures were not observed. With varied lengths, the micro-fractures were mainly distributed as thin slits or narrow segments, which are 50-500nm in width. The distribution is highly uneven. The micro-fractures intersected each other, and were perpendicular to the stratum. Overall, coal sample 2# had relatively more ultra-narrow micro-fractures, without any penetrating micro-fracture or large macro-fracture.
Clay minerals, mainly floc illite, were found on the coal sample. The illite is highly sensitive to water, and expands rapidly in contact with water.
(3) Anthracite (3#)
As shown in Figure 6, coal sample 3# only displayed micropores under the SEM; no micro-fractures were detected. In the high-precision SEM image, cave-like pores were found on the surface of the sample, which are also the air vents developed in coal formation. Some of the cave-like holes were shallow and some were deep. Compared with shallow ones, the deep cave-like holes had simple inner structure. No laminated or petal-like structure was noticed. Most of the pores were distributed in small streaks. The pore width and length fell within 30nm-100nm and 30nm-300nm, respectively.
Clay minerals, mainly irregular flaky montmorillonite, were found on the coal sample. The montmorillonite is highly sensitive to water, and expands rapidly in contact with water.
Figure 6. The SEM image of anthracite (3#)
3.2 Analysis on the migration and diffusion speed of CH4 in coal
3.2.1 Experimental conditions
In addition to the organization, structure and chemical composition of the coalbed, the diffusion of coalbed CH4 is influenced by external factors like coalbed temperature, reservoir pressure and gas pressure. Our experiments adopt the reservoir pressure, temperature and geo-stress of the coalbeds in the study areas, and fully consider the sensitivity of instruments and compressive properties of coal samples. The migration and diffusion speed of CH4 in coal was characterized by the diffusion coefficient. The greater the coefficient, the faster the migration and diffusion speed. The final experimental conditions and the measured results (the diffusion coefficients of CH4 in coal samples under different conditions) are listed in Table 6 and Table 7, respectively.
Table 6. Experimental conditions
|
Samples |
Confining pressure (MPa) |
Temperature (℃) |
Air pressure (MPa) |
|
1# |
16.00 |
18.00 |
4.00 |
|
2# |
18.00 |
24.00 |
6.00 |
|
3# |
20.00 |
30.00 |
8.00 |
Table 7. The diffusion coefficients of CH4 in coal samples under different conditions
|
Number |
Samples |
Experimental conditions |
CH4 diffusion coefficient (cm2/s) |
||
|
Confining pressure (MPa) |
Temperature (℃) |
Air pressure (MPa) |
|||
|
1 |
1# |
16.00 |
18.00 |
4.00 |
1.72E-08 |
|
2 |
1# |
18.00 |
24.00 |
6.00 |
1.58E-08 |
|
3 |
1# |
20.00 |
30.00 |
8.00 |
1.49E-08 |
|
4 |
1# |
18.00 |
18.00 |
4.00 |
1.34E-08 |
|
5 |
1# |
20.00 |
18.00 |
4.00 |
1.03E-08 |
|
6 |
2# |
16.00 |
18.00 |
4.00 |
1.31E-08 |
|
7 |
2# |
18.00 |
24.00 |
6.00 |
1.25E-08 |
|
8 |
2# |
20.00 |
30.00 |
8.00 |
1.21E-08 |
|
9 |
2# |
16.00 |
24.00 |
4.00 |
1.43E-08 |
|
10 |
2# |
16.00 |
30.00 |
4.00 |
1.51E-08 |
|
11 |
3# |
16.00 |
18.00 |
4.00 |
1.22E-08 |
|
12 |
3# |
18.00 |
24.00 |
6.00 |
1.17E-08 |
|
13 |
3# |
20.00 |
30.00 |
8.00 |
1.06E-08 |
|
14 |
3# |
16.00 |
18.00 |
6.00 |
1.13E-08 |
|
15 |
3# |
16.00 |
18.00 |
8.00 |
1.04E-08 |
3.2.2 Influence of confining pressure on CH4 diffusion coefficient
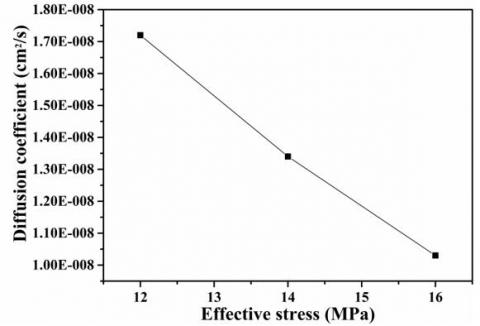
The coal reservoir is a 3D geological body buried at a certain depth underground. The physical properties of the reservoir, especially diffusion and permeability, are closely related to the geo-stress (confining pressure). The confining pressure of coalbed pores is generated under the action of the natural geo-stress field. This pressure acts on the coalbed pores, exerting an impact on the fluids in the pores. The effective stress refers to the difference between the geo-stress acting on the coal reservoir and the fluid pressure in its pores and fractures. In our experiments, the CH4 diffusion coefficients were measured under eight different confining pressures, when the temperature and air pressure remained the same.
Table 8. The diffusion coefficients of CH4 in coal samples under different confining pressures
|
Number |
Samples |
Experimental conditions |
CH4 diffusion coefficient (cm2/s) |
||
|
Confining pressure (MPa) |
Temperature (℃) |
Air pressure (MPa) |
|||
|
1 |
1# |
16.00 |
18.00 |
4.00 |
1.72E-08 |
|
4 |
1# |
18.00 |
18.00 |
4.00 |
1.34E-08 |
|
5 |
1# |
20.00 |
18.00 |
4.00 |
1.03E-08 |
Table 9. Effective stresses of pores under different confining pressures
|
Number |
Samples |
Experimental conditions |
Effective stress/MPa |
CH4 diffusion coefficient (cm2/s) |
||
|
Confining pressure (MPa) |
Temperature (℃) |
Air pressure (MPa) |
||||
|
1 |
1# |
16.00 |
18.00 |
4.00 |
12 |
1.72E-08 |
|
4 |
1# |
18.00 |
18.00 |
4.00 |
14 |
1.34E-08 |
|
5 |
1# |
20.00 |
18.00 |
4.00 |
16 |
1.03E-08 |
Figure 7. The relationship between diffusion coefficient and confining pressure
According to the data shown in Table 8, the effective stresses of pores were calculated for coal samples 1#-1, 1#-4 and 1#-5 (Table 9). It can be seen that the CH4 diffusion coefficient decreased exponentially, with the growing effective stress (confining pressure) (Figures 7 and 8), and the decreasing rate slightly slowed down through the process. Without damaging the coal samples, the confining pressure was increased to the ultimate level of 20MPa, under which decreasing rate did not slow down abruptly. It is speculated that, with further growth in the confining pressure, the diffusion coefficient will become stable, rather than further decline.
According to the theory of material mechanics, coal deformation has a positive correlation with stress. If the other conditions remain the same, the growth in confining pressure will not change the pore pressure (air pressure), but will bring a continuous growth in the effective stress on the coal body, causing a growing deformation of the coal body. Under the effective stress, the pores and throats in the coal will shrink and deform. Eventually, the porosity of the coal body will decline and the diffusion coefficient will decrease. Therefore, the diffusion coefficient, like the permeability, is negatively affected by the effective stress [26].
Figure 8. The relationship between diffusion coefficient and effective stress
3.2.3 Influence of temperature on CH4 diffusion coefficient
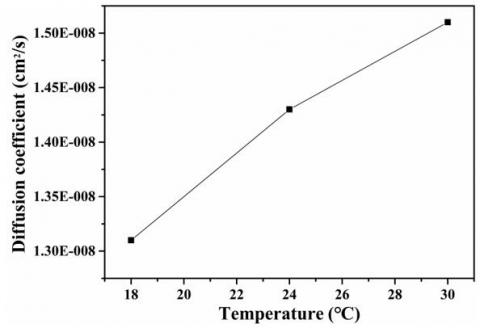
Based on the data shown in Table 10, the relationship between diffusion coefficient and temperature was plotted (Figure 9). Under constant air pressure and confining pressure, the CH4 diffusion coefficients of coal samples 2#-6, 2#-9 and 2#-10 all increased exponentially, as the temperature rose from 18°C to 30°C, and the increasing rate slightly grew with the rising temperature.
According to theories on gas molecule kinematics, the influence of temperature on the diffusion of gas molecules is mainly exhibited as changing the root mean square velocity and mean free travel of the molecules. The theory of molecular motion shows that the temperature of gas signifies the mean kinetic energy of the gas molecules. The higher the temperature, the more violent and frequent the molecules vibrate. Therefore, the gas molecules will move faster under the rising temperature. Meanwhile, the molecular motions will become more active, and faster from high concentration to low concentration. Therefore, the gas diffuses at a faster speed, causing a gradual increase of the diffusion coefficient.
Figure 9. The relationship between diffusion coefficient and temperature
Table 10. The diffusion coefficients of CH4 in coal samples under different temperatures
|
Number |
Samples |
Experimental conditions |
CH4 diffusion coefficient (cm2/s) |
||
|
Confining pressure (MPa) |
Temperature (℃) |
Air pressure (MPa) |
|||
|
6 |
2# |
16.00 |
18.00 |
4.00 |
1.31E-08 |
|
9 |
2# |
16.00 |
24.00 |
4.00 |
1.43E-08 |
|
10 |
2# |
16.00 |
30.00 |
4.00 |
1.51E-08 |
3.2.4 Influence of air pressure on CH4 diffusion coefficient
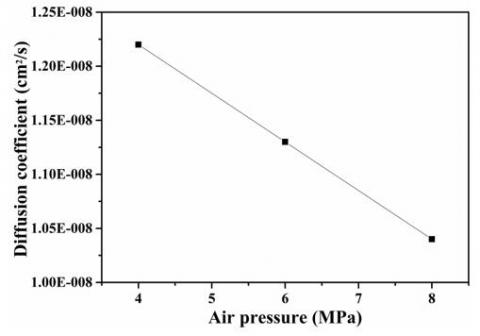
Based on the data shown in Table 11, the relationship between diffusion coefficient and air pressure was plotted (Figure 10). Under constant temperature and confining pressure, the CH4 diffusion coefficients of coal samples 3#-11, 3#-14 and 3#-15 changed similarly under growing air pressure (4.0~8.0MPa) and under growing confining pressure: an exponential decline at a decreasing rate.
The previous research [26] has demonstrated that, as the gas pressure of CH4 in coal grows, the coal has a stronger adsorption of CH4 molecules. Under the constraints of external forces, expansion stress of the adsorption will increase, suppressing the effective stress of the coal body. According to Subsection 3.2, the decline in effective stress will lead to an increase in the diffusion coefficient. However, the coal samples have an adsorption effect on CH4 during the diffusion process. The adsorption expansion volume is partially converted to the expansion stress at the contact point, and partially transformed into the inward adsorption expansion strain acting on the pore volume. If the CH4 gas pressure increases, the inward adsorption deformation of coal particles will exacerbate, the coal particles will swell, the porosity will decrease, and thus the diffusion coefficient will reduce. The inverse is also true. Hence, the air pressure has two effects on the CH4 diffusion in coal: mechanical effect and adsorption effect.
Our experimental results show that the growth in air pressure reduced the diffusion coefficient, indicating that the control effect of gas pressure on CH4 diffusion is constrained by two factors, namely, effective stress and the shrinkage/expansion of coal particles. The two constraints have the opposite effects. Of course, the relationship between gas pressure and diffusion coefficient is ultimately regulated by the main control factor: the expansion volume strain of coal particles induced by the CH4 adsorption.
Table 11. The diffusion coefficients of CH4 in coal samples under different air pressures
|
Number |
Samples |
Experimental conditions |
CH4 diffusion coefficient (cm2/s) |
||
|
Confining pressure (MPa) |
Temperature (℃) |
Air pressure (MPa) |
|||
|
11 |
3# |
16.00 |
18.00 |
4.00 |
1.22E-08 |
|
14 |
3# |
16.00 |
18.00 |
6.00 |
1.13E-08 |
|
15 |
3# |
16.00 |
18.00 |
8.00 |
1.04E-08 |
Figure 10. The relationship between diffusion coefficient and air pressure
3.2.5 Influence of metaphoric degree on diffusion coefficient
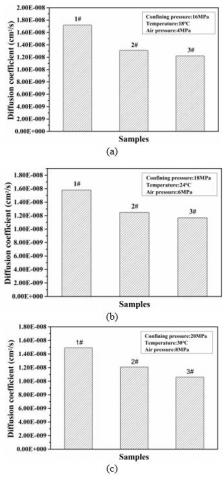
Based on the data shown in Table 12, the relationship between the diffusion coefficients of fat coal, lean coal and anthracite under three sets of experimental conditions (a, b and c) were plotted (Figure 11). The three sets of experimental conditions are as follows: (a) confining pressure 16MPa, temperature 18℃ and gas pressure 4MPa; (b) confining pressure 18MPa, temperature 24℃ and gas pressure 6MPa; (c) confining pressure 20MPa, temperature 30℃ and gas pressure 8MPa. As shown in Figure 11, the diffusion coefficient gradually decreased with the growth in the metaphoric degree.
Table 12. The diffusion coefficients of CH4 in coal samples under three sets of experimental conditions (a, b and c)
|
Group |
Number |
Samples |
Experimental conditions |
CH4 diffusion coefficient (cm2/s) |
||
|
Confining pressure (MPa) |
Temperature (℃) |
Air pressure (MPa) |
||||
|
a |
1 |
1# |
16.00 |
18.00 |
4.00 |
1.72E-08 |
|
6 |
2# |
16.00 |
18.00 |
4.00 |
1.31E-08 |
|
|
11 |
3# |
16.00 |
18.00 |
4.00 |
1.22E-08 |
|
|
b |
2 |
1# |
18.00 |
24.00 |
6.00 |
1.58E-08 |
|
7 |
2# |
18.00 |
24.00 |
6.00 |
1.25E-08 |
|
|
12 |
3# |
18.00 |
24.00 |
6.00 |
1.17E-08 |
|
|
c |
3 |
1# |
20.00 |
30.00 |
8.00 |
1.49E-08 |
|
8 |
2# |
20.00 |
30.00 |
8.00 |
1.21E-08 |
|
|
13 |
3# |
20.00 |
30.00 |
8.00 |
1.06E-08 |
|
The diffusion coefficients of different coal samples obtained from the diffusion experiments agree well with the SEM analysis on pores. This means, under the same experimental conditions, the CH4 diffusion speed in coal is controlled by the difference in diffusivity between the coal with well-developed micro-fractures and that with poorly-developed micropores, the development of micropores, especially the micro-pores.
Figure 11. The relationship between diffusion coefficients of fat coal, lean coal and anthracite under three sets of experimental conditions (a, b and c)
Normally, the diffusion patterns of gas molecules in porous media can be categorized as Fick diffusion, Knudsen diffusion, transitional diffusion, surface diffusion and crystal diffusion. The Fick diffusion coefficient (Df:10-3~10-4 m2/s)>transitional diffusion coefficient (Dt: 10-5 m2/s)>Knudsen diffusion coefficient (Dk: 10-6 m2/s)>surface diffusion coefficient (Dse:<10-7m2/s)>crystal diffusion coefficient (Dc:<10-9m2/s) [27].
According to the magnitude of the diffusion coefficients calculated in Section 3.2.1, it can be seen that surface diffusion is the leading diffusion pattern of CH4 molecules insides the pores of coal body. The surface diffusion means the adsorbed gas molecules move along the wall surface of the channels. In general, the larger the SSA of the pores, the higher the surface concentration, and the greater the surface diffusion coefficient Dse. Since the micropores in coal samples are much larger than the medium pores in the SSA, the CH4 diffusion in the pores of coal body is mainly controlled by the micropores.
(1) Through the SEM, clay minerals like illite and montmorillonite were found on different coal samples. The coals in different metamorphic degrees have various types of pores with different lengths, and multiple kinds of fractures with different lengths and widths.
(2) The diffusion coefficients of different coal samples obtained from the diffusion experiments agree well with the SEM analysis on pores. This means, under the same experimental conditions, the CH4 diffusion speed in coal is controlled by the difference in diffusivity between the coal with well-developed micro-fractures and that with poorly-developed micropores, the development of micropores, especially the micro-pores.
(3) For the same coal sample, the CH4 diffusion speed in coal decreases with the growth in confining pressure or the air pressure, and increases exponentially with the rising temperature. The influence of temperature on the diffusion of gas molecules is mainly exhibited as changing the root mean square velocity and mean free travel of the molecules. The control effect of confining pressure and gas pressure on CH4 diffusion is constrained by two factors, namely, effective stress and the shrinkage/expansion of coal particles. The two constraints have the opposite effects.
This study was sponsored by the National Natural Science Foundation of China (Grant No. 41872169 and 41972177), the Industry-university-research cooperation of Henan Province (182107000004), the Doctoral Scientific Fund Project of Henan Institute of Engineering (D2017010) and Key Research Project of Higher Education in Henan Province (19A440004).
[1] Keshavarz, A., Sakurovs, R., Grigore, M. (2017). Effect of maceral composition and coal rank on gas diffusion in Australian coals. International Journal of Coal Geology, 173: 65-75. https://doi.org/10.1016/j.coal.2017.02.005
[2] Vishal, V. (2017). In-situ disposal of CO2: Liquid and supercritical CO2 permeability in coal at multiple down-hole stress conditions. Journal of CO2 Utilization, 17: 235-242. https://doi.org/10.1016/j.jcou.2016.12.011
[3] Naveen, P., Asif, M., Ojha, K. (2017). Sorption kinetics of CH4 and CO2 diffusion in coal: theoretical and experimental study. Energy Fuels, 31: 6825-6837. https://doi.org/10.1021/acs.energyfuels.7b00721
[4] İhsanKarayiğit, A., Maria, M., Görkem Oskay, R. (2017). Meso- and microporosity of the subbituminous kM2 coal seam (Soma, Turkey) and its relationship with coal characteristics. International Journal of Coal Geology, 184(4): 73-87. https://doi.org/10.1016/j.coal.2017.10.015
[5] Katz, B., Arango, I. (2018). Organic porosity: A geochemist's view of the current state of understanding. Organic Geochemistry, 123: 1-16. https://doi.org/10.1016/j.orggeochem.2018.05.015
[6] Howaniec, N. (2016). Development of porous structure of lignite chars at high pressure and temperature. Fuel Processing Technology, 154: 163-167. https://doi.org/10.1016/j.fuproc.2016.08.028
[7] Rodrigues, C., Dinis, M., Lemos, M. (2016). Gas content derivative data versus diffusion coefficient. Energy Exploration & Exploitation, 34(4): 606–20. https://doi.org/10.1177/0144598716643629
[8] Dang, G.X., Wu, C.F., Zhao, K. (2017). Pore property and its impact on the coalbed methane adsorption of anthracite from the Zhu-Zang syncline, Guizhou Province. Coal Geology & Exploration, 45(6): 72-78. https://10.3969/j.issn.1001-1986.2017.06.012
[9] Li, H., Wang, F.G., Li, Z. (2019). Study on pore properties of main coal seams of Yangmeishu syncline in Liupan-shui coalfield. Coal Science and Technology, 47(7): 234-243. https://10.13199/j.cnki.cst.2019.07.031
[10] Jia, X.M., Lin, Y.B., Ma, D.M. (2019). Study on porosity characteristics of macro coal components in high and low rank coal. Coal Engineering, 51(6): 24-27. https://10.11799/ce201906005
[11] Zhao, P.D., Guo, Y.H., Geoff, W. (2019). Quantitative characterization of pore structure characteristics of high quality coal based on fractal modeling: taking coal samples from Shanxi Formation in Yangquan Mining Area as an example. Journal of Northeast Petroleum University, 43(3): 53-68. https://10.3969/j.issn.2095-4107.2019.03.006
[12] Lin, Y.B., Jia, X.M., Ma, D.M. (2016). Study and application of coal pore features based on liquid nitrogen adsorption method. Coal Science and Technology, 44(3): 135-140. https://10.13199/j.cnki.cst.2016.03.026
[13] Guo, W., Yao, Y.B., Liu, D.M. (2016). Research on measurement of pores in coals with NMRC technique. Oil & Gas Geology, 37(1): 141-148. https://10.11743/ogg20160120
[14] Xu, Q.L., Huang, W.H., Tang, S.H. (2016). Pore structure and adsorption of deep medium-high rank coal reservoirs. Geoscience, 30(2): 413-419. https://10.3969/j.issn.1000-8527.2016.02.017
[15] Ozdemir, E. (2017). Dynamic nature of supercritical CO2 adsorption on coals. Adsorption, 23(1): 25-36. https://10.1007/s10450-016-9814-9
[16] Perez, F., Devegowda, D. (2017). Estimation of adsorbed-phase density of methane in realistic overmature kerogen models using molecular simulations for accurate gas in place calculations. Journal of Natural Gas Science and Engineering, 46: 865-872. https://doi.org/10.1016/j.jngse.2017.08.008
[17] Tesson, S., Firoozabadi, A. (2018). Methane adsorption and self-diffusion in shale kerogen and slit nanopores by molecular simulations. Journal of Physical Chemistry C, 122: 23528-23542. https://doi.org/10.1021/acs.jpcc.8b07123
[18] Lee, T., Bocquet, L., Coasne, B. (2016). Activated desorption at heterogeneous interfaces and long-time kinetics of hydrocarbon recovery from nanoporous media. Nature Communications, 7: 1-10. https://10.1038/ncomms11890
[19] Mastalerz, M., Hampton, L.B., Drobniak, A. (2017). Significance of analytical particle size in low-pressure N2, and CO2 adsorption of coal and shale. International Journal of Coal Geology, 178: 122-131. https://doi.org/10.1016/j.coal.2017.05.003
[20] Hazra, B., Wood, D.A., Vishal, V. (2018). Pore characteristics of distinct thermally mature shales: influence of particle size on low-pressure CO2 and N2 adsorption. Energy Fuel, 32(8): 8175-8186. https://doi.org/10.1021/acs.energyfuels.8b01439
[21] Senthamaraikkannan, G., Gates, I., Prasad, V. (2016). Development of a multiscale microbial kinetics coupled gas transport model for the simulation of biogenic coalbed methane production. Fuel, 167: 188-198. https://doi.org/10.1016/j.fuel.2015.11.038
[22] Liu, J., Fokker, P.A., Spiers, C.J. (2017). Coupling of swelling, internal stress evolution, and diffusion in coal matrix material during exposure to methane. Journal of Geophysical Research. Solid Earth, 122: 844-865. https://10.1002/ 2016JB013322
[23] Zhao, F.J., Chen, X.X., Liu, M.J. (2016). Comparison of methane adsorption and diffusion characteristics in soft and hard coal. Coal Geology & Exploration, 44(4): 59-63. https://10.3969/j.issn.1001-1986.2016.04.011
[24] Zhao, J.J., Tang, D.Z., Xu, H. (2016). Measurement of methane diffusion coefficient and analysis of its influencing factors in coal matrix. Coal Science and Technology, 44(10): 77-82,145. https://10.13199/j.cnki.cst.2016.10.015
[25] Wang, B.J., Zhang, L.N., Ling, L.X. (2016). Effects of coal molecular structure on adsorption and diffusion behaviors of coalbed methane. Journal of Chemical Industry and Engineering, 67(6): 2548-2558. https://10.11949/j.issn.0438-1157.20151780
[26] Fu, X.H., Qin, Y., Zhang, W.H. (2003). Coupling correlation between high-rank coal matrix mechanic effect and coal reservoir permeability. Geological Journal of China Universities, 9(3): 373-377. https://10.3969/j.issn.1006-7493.2003.03.005
[27] Li, X.C., Li, Z.B., Zhang, L., Gao, J.X., Nie, B.S., Meng Y.Y. (2018). Pore structure characterization of various rank coals and its effect on gas desorption and diffusion. Journal of China Coal Society. https://doi.org/10.13225/j.cnki.jccs.2018.1374