Mohammed Allae Bennini | Abdelghani Koukouch | Ilias Bakhattar | Mohamed Asbik | Toufik Boushaki* | Brahim Sarh | Abdallah Elorf | Benoit Cagnon | Sylvie Bonnamy
© 2019 IIETA. This article is published by IIETA and is licensed under the CC BY 4.0 license (http://creativecommons.org/licenses/by/4.0/).
OPEN ACCESS
The aim of this study is to characterize and burn out three olive pomace samples in a fixed bed boiler. These products are: raw olive pomace (R.O.P), exhausted olive pomace (E.O.P), and deoiled olive pomace (D.O.P). Before their combustion, they have been characterized using different analyses: proximate, ultimate, and thermogravimetric. So, proximate analysis illustrated that raw olive pomace contains volatile matter (74.2%), fixed carbon (20.2%), moisture (7.51%) and ash (2.8%). Next, ultimate analysis showed that R.O.P has important content percentages of carbon and oxygen (48.2% and 44.3% respectively). Furthermore, thermogravimetric analysis proved that the weight loss corresponding to the burnt volatile matter (VM) is ranging between 65% and 75% for all these biomasses. During the combustion of (R.O.P) and (E.O.P) samples, which is compared to that of wood sawdust, ignition propagation and char oxidation were observed. Moreover, effects of olive pomace particle size on temperature distributions at different combustor device positions were highlighted. The maximum temporal average temperature was reached with the smaller particles. Finally, the flue gas composition (O2, CO, CO2, NOx, SOx) has been measured and it has shown that the emissions of nitrogen oxides (NOx) are very low and sulphur oxides (SOx) are negligible.
agricultural waste, biomass, char oxidation, flue gas, grate boiler, ignition front, thermogravimetric analysis, volatile matter
The transition from fossil fuels to renewable energies, such as wind, solar and biomass, has become one of the key energy issues in terms of renewable, clean resources, and important reduction in carbon emissions [1].
In recent years, Morocco has adopted an energy transition strategy whose objective is to generalize and secure supply and access to clean energy to preserve the environment [2]. Nevertheless, biomass remains a neglected energy source despite of its abundance in Morocco, especially, in the form of agriculture and forestry wastes (olive pomace, argan shells, bagasse, date palm trunk, wood chips,...).
The high energy potential of biomass takes a large part in scientific research, particularly in the field of renewable energies. In 2009, Khan et al. [3] provided more data concerning the impact of biomass properties on the combustion process and emission characteristics. They concluded that a lot of efforts are needed to make biomass economically competitive by comparison with the currently used energies, but they affirmed that there are no insurmountable obstacles for this sustainable energy source. Moreover, a large diversity of biomass forms constitutes a fertilized field of scientific research that studied separately each variety such as biomass pellets [4-10], pin chips [11] and olive cake [12-26]. These studies cover experimental and numerical studies on biomass combustion, synthesis characterization and drying of several kinds of biomasses. Forbes et al. [6] have given physico-chemical characteristics of eight different types of biomass (pine, sitka spruce, forest brush, misc, wood pellets, Wr (willow), Wfc (willow), Ws (willow)]. Comparison of results based on particle distribution, thermogravimetric, and ultimate and proximate analyses showed significant differences between the examined biomass types. Additionally, combustion tests in a 120kW multi-fuel boiler revealed also some differences in terms of maximum efficiency, energy conversion efficiency, gaseous emissions and ash residues.
This work being focused on the characterization and combustion of olive pomace and below are reported some bibliographic references related to this topic. In 1995, Abu-Qudais [12] studied experimentally the combustion of olive cake in a fluidized bed combustor in taking into account the effects of bed height, fluidization velocity and the biomass flow rate. He showed that the combustion efficiency which was ranging from 86 to 95 % increased with air-flow rate. Atimtay and co-workers [13-14] carried out experimental studies on combustion and co-combustion performances and emission characteristics of olive cake and lignite coal. Their experiments were performed in a circulating fluidized bed (CFB) by using cumulative average particle sizes of dp (dp= 2.3, 0.56 and 0.46 mm) for two categories of biomass. The effect of excess air ratio on the combustion performances is highlighted, and flue gas concentrations of O2, SO2, CO2, CO, NOx and total hydrocarbons were also measured. In reference [13], the use of olive cake and lignite coal mixture (less than 50 % of olive cake) for cleaner energy production in small-scale industries, is suggested. As for the pyrolysis and combustion of olive cake, important studies have been conducted by Jauhiainen et al. [15-16]. In reference [15], they identified and quantified the combustion pollutants produced in a laboratory horizontal furnace. They showed that low amounts of pollutants were produced during the thermal treatment, and no dangerous inorganic compounds were detected. In reference [16], Jauhiainen et al. have performed dynamic TGA/DTG treatments of olive pomace at heating rates ranging from 5 to 20°C/min. They also proposed a mathematical model to predict pyrolysis and combustion behaviors of this biomass. Miranda et al. [10, 18-19] have also studied the combustion of residues, especially the olive pomace. The properties or characteristics (moisture content, mechanical durability, ash content, calorific value) of the mixture of granulated residues of olive-pomace and Pyrenean oak were analyzed in order to find the best composition to valorize this mixture as a biofuel [10]. Their experiments highlighted that efficient compression of the pellet, improve its handling and transport, without modifying significantly its thermal properties. Furthermore, they used the thermogravimetric analysis (TGA) to illustrate thermal behaviors of olive pomace coming from different olive oil mills [19]. The authors concluded that the Concentrated Olive Mill Waste Water (COMWW) is inappropriate for its use in combustion.
Several other works concerning the different uses of olive pomace have been published [20-22]. Baccar et al. [20] have prepared the activated carbon from Tunisian olive pomace and its application for the adsorption of heavy metal ions. Encinar et al. [21] conducted the pyrolysis of an olive oil extraction waste with the objective to characterize the char, tar and gaseous phases generated in the process, for their possible use in the energy generation. As for Petrov et al. [22], they investigated and evaluated the quality of the carbon adsorbents produced from olive stones by different methods.
In this study, experiments were conducted to predict the potential use of raw olive pomace as a solid biomass fuel. Three samples were characterized, namely, raw olive pomace (R.O.P), exhausted olive pomace (E.O.P) which is pelletized in the cylindrical shape, and deoiled olive pomace (D.O.P) obtained by using Soxhlet extractor [23]. Then, two kinds of olive pomace (R.O.P and E.O.P) were burned and their results are compared to those obtained from wood sawdust combustion. Effects of olive pomace particle size on temperature distributions at different combustor device positions were highlighted and the flue gas composition (O2, CO, CO2, NOx, SOx) has been measured.
2.1 Experimental device
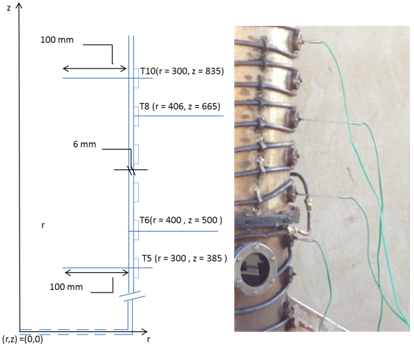
The cylindrical biomass combustor device described in Figure 1 (a) isused for the combustion of raw olive pomace. The experimental setup consists in two vertical compartments: the combustion chamber (fixed-bed reactor), and the flue gas chamber (upper compartment) connected to the chimney by a conical convergent nozzle. In addition, a fuel hopper, a fuel (biomass) feeding system, two blowers, an ash hopper, and a burner hole are also the part of the biomass combustion system. The experimental device is 1500 mm height with a400 mm internal diameter and is made of 6 mm stainless steelthick. A horizontal stainless steel grate with holes of about 1 mm is fixed at the bottom of the combustion chamber. For cooling this experimental prototype, an open loop liquid (water) cooling system is used. Indeed, water flows inside a copper tube (external heat exchanger) which is coiled around the external wall of two compartments of the biomass experimental setup (Figure 1 (a) and (b)).
(a) Scheme of the experimental setup
(b) Positions of thermocouples
Figure 1. Experimental setup
Positions of thermocouples are shown in Figure 1 (b). Thus, thermocouples T5 (r=300 mm, z=385 mm) and T10(r=300 mm, z=835 mm) are localized respectively at the upper position of combustion chamber and the upper position of gas flue chamber to control the thermal behavior at the inlet and at the outlet of the gas flue chamber. Concerning the positions of T6(r=400 mm, z=500 mm) and T8(r=406 mm, z=665 mm), they are respectively placed at the internal wall of gas flue chamber inlet and the external wall of the middle of gas flue chamber in order to quantify the heat loss through combustor wall.
2.2 Procedure and instrumentation
In the experiment tests, raw olive pomace is essentially used as a solid fuel which is previously prepared and stored in the fuel hopper. The biomass fuel is fed to the combustion chamber via a worm screw conveyor which is placed below the fuel hopper. This feeding system is calibrated and it is driven by a variable speed motor (SEW-EURODRIVE, r/min: 1380/238) for controlling the mass flow rate of the biomass (16 kg/h in this study). Both air blowers (Forge blower 2.5” inside diameter, 3600 rpm) are turned on to provide a controlled amount of air to the fixed-bed reactor. These instruments were calibrated in advance and the air flow rate is adjusted to appropriate value (101 m3/h at the blower exit). To ensure uniform distribution of primary air inside the combustion chamber, an object (a half sphere) is placed on the grate center (Figure 1a). Next, the flame was ignited by a gas igniter through the optical portholes, and the combustion chamber was continuously fed by fuel until a stable flame is obtained. Biomass feeding was done periodically every 90 seconds in average, and three flame portholes were used to observe the progress of combustion. Moreover, there are specific holes along the biomass experimental prototype for temperature measurements (Figure 1a). For this last reason, several K-type thermocouples (Ni/Cr) of 1mm in diameter are located at different high levels from the bottom of the combustion chamber (Figure 1b). After calibrating
instruments, temperature measurements were performed with an accuracy of ±0.05% and then recorded every 30 seconds by using the datalogger (Graphtec GL 220) which has 10 analog input channels for voltage or temperature. For viewing and analyzing results, data are transferred to PC in real-time in a binary (or CSV) format. Close to steady-state condition, a combustion gas analyzer (Kig 300 from Kimo) is connected to the chimney inlet in order to measure the flue gas composition (O2, CO, CO2, NOx, SOx). During the tests, the produced ash is collected in an ash hopper at the bottom of the combustor.
3.1 Presentation of biomasses
The raw olive pomace (R.O.P) was coming from a semi-traditional unit of olive oil extraction using a three-phase continuous system. This agricultural waste was composed of a mixture of olive skins, pulp residues, core fragments, water and a quantity of residual oil. Before these experiments were conducted, the biomass was dried in the open air and with solar drying [23, 25].
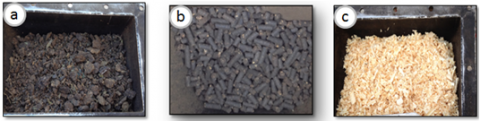
Figure 2. Three kinds of biomasses(a) Raw olive pomace,(b) Exhausted olive pomace,(c) Sawdust of wood
Generally, in the case of the biomass, the combustion is influenced by the biomass composition and particle sizes. In fact, for the performed experiments, three average particle sizes (dp) were used for raw olive pomace (Figure 2a), namely, 1mm <dp ≤ 2 mm; 2mm<dp ≤ 5mm and 20mm ≤ dp ≤ 30mm, whereas exhausted olive pomace (E.O.P) pellets (Figure. 2b) have a cylindrical shape (diameter: 11.5 mm; height: 25 mm). Note that the olive pomace combustion results will be compared to those of sawdust of wood (Figure. 2c) having average particle size ranging from 0.5 mm to 1.5 mm.
3.2 Proximate and ultimate analyses of R.O.P
Raw olive pomace (R.O.P) requires characterization analyzes which will be helpful in the design of an adequate system for their conversion (boiler in the case of this study). Firstly, proximate analysis (volatile matter: VM, fixed carbon: FC, moisture: M, ash) was obtained using standard procedures and high heating values are measured by bomb calorimeter (Parr 1261, reference 242MM Parr 1261-Isoperibol-Bomb-Calorimeter). As for the ultimate analysis, it is important to determine the weight percentage (wt %) of elemental composition (Carbon: C, Hydrogen: H, Oxygen: O, nitrogen: N, sulphur: S) of olive pomace (THERMO SCIENTIFIC – FLASH 2000) and it could also be used to calculate high heating values. Those analyses are compared with literature data (see Tables 1 and 2).
From the proximate analysis, Table 1 shows that volatile matter (VM) is around 70% and it has approximately the same value as various agricultural residues [27]. However, the amount of volatiles from wood is lower and it is about 46% [27]. Additionally, the raw olive pomace contained higher content of volatile matter than fixed carbon (FC), while the percentage of ash is lower. Concerning the elemental analysis, it is noticeable that carbon and oxygen content percentages are higher (48.2% and 44.3% respectively), with low hydrogen percentage (6.1 %) and no sulfur content. When these results are compared with the literature data [10, 13, 16-17, 24] they are in relatively good agreement. On the other hand, raw olive pomace has a significant high heating value (HHV), 22.50 MJ/kg as seen in Table 1. The HHV of this agri-food industry residue is comparable with that of wood, which up to now is the biomass most appreciated and the most used even if its calorific value does not exceed 19.10 MJ/kg [28].
Table 1. Proximate analysis
|
Ref. |
VM |
FC |
M |
Ash |
HHV(MJ/kg) |
|
[10] |
77.77 |
17.92 |
5.5-6.0 |
4.31 |
23.27 |
|
[12] |
43.15 |
44.34 |
6.01 |
6.50 |
25.46 |
|
[13] |
68.82 |
15.64 |
6.53 |
9.01 |
19. 81 |
|
[16] |
58.70 |
33.70 |
- |
7.60 |
- |
|
[17] |
80.19 |
9.94 |
7.31 |
2.56 |
22.14 |
|
[24] |
66.60 |
23.4 |
10.00 |
4.00 |
19.50 |
|
Present work |
74.2 |
20.2 |
7.51 |
2.80 |
22.50 |
Table 2. Ultimate analysis
|
Ref. |
C(wt%) |
H(wt%) |
O(wt%) |
N(wt%) |
S(wt%) |
|
[10] |
54.9 |
8.2 |
34.4 |
2.2 |
< 0.1 |
|
[13] |
46.8 |
6.1 |
36.7 |
0.7 |
0.1 |
|
[16] |
47.0 |
5.7 |
46.2 |
1.1 |
0.0 |
|
[17] |
47.9 |
7.1 |
33.6 |
1.5 |
0.1 |
|
[24] |
52.1 |
6.7 |
41.2 |
1.4 |
<0.3 |
|
Present work |
48.2 |
6.1 |
44.3 |
1.4 |
0.0 |
3.3 Thermogravimetric analysis
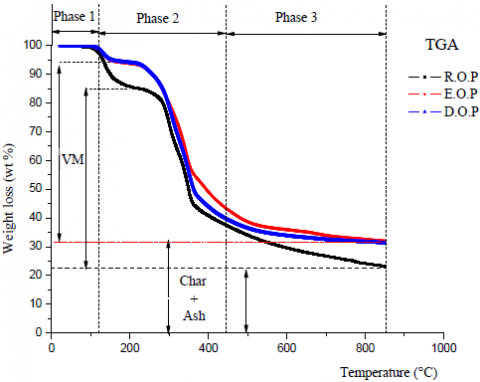
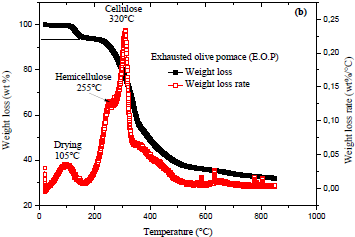
To predict more accurately the thermal behavior of the three aforementioned materials as a fuel in real systems, it is necessary to perform a specific thermal analysis of these biomasses, especially the thermogravimetric analysis (TGA, SETARAM 92). This was performed under inert atmosphere (Argon) with a flowing rate of 160 mL/min, and at the 20 °C/min heating rate from ambient up to 800 °C. In Figure 3, are reported the weight loss (TGA) characteristics of raw olive pomace (R.O.P), exhausted olive pomace (E.O.P) and deoiled olive pomace (D.O.P). In addition, the behavior of TGA and the weight loss rate (derivative thermogravimetric: DTG) curves of each sample kind are displayed in figures 4a, 4b and 4c against temperature in pyrolysis environment. It is seen from these graphs (Figures 3, 4a, 4b and 4c) that the thermal degradation occurs in three different zones which consist in drying and evaporation of water (phase 1), devolatilization of hemicellulose and cellulose especially (phase 2), and decomposition of lignin (phase 3). As readily illustrated in Figure 3, the temperature ranges which correspond respectively to the three phases are: 0-150°C, 150-400°C and 400-800°C, and the TGA analysis is influenced by the type of biomass. In the drying zone (see figures 4a, 4b and 4c), the evaporation of water occurs at the same temperature (105°C) for (E.O.P) and (D.O.P) while it appears at 120°C for (R.O.P). This can be explained by the fact that water is trapped by the residual oil into micropores of the (R.O.P) contrary to (E.O.P) and (D.O.P) which seem to be deoiled. Nevertheless, the amount of evaporated water is more important for the (R.O.P) (about 15%) than the treated products (about 7-8% for E.O.P and D.O.P). In the second interval of temperatures (150°C-400°C), the weight loss, corresponding to the burned volatile matter (VM), is lying between 65-75% for all biomasses. The VM release occurs particularly during the decomposition of hemicellulose and cellulose (see Figures 4a, 4b and 4c). As for a lignin (phynolic polymer) that is considered as a heavier volatile, its VM release occurs essentially from 400 °C up to 800 °C. At high temperature, the residue is composed of ashes and char mixture (20 à 30%). Note that this residue is more important in the case of E.O.P and D.O.P considered as deoiled products which have almost the same variation of weight loss (see Figure 3).
Figure 3. Experimental data of weight loss (%) for the three different kinds of olive pomace
(a) Raw olive pomace (R.O.P)
(b) Exhausted olive pomace (E.O.P)
(c) Deoiled olive pomace (D.O.P)
Figure 4. TGA and DTG of three types of olive pomace
4.1 Effects of particle size
Combustion tests were performed with discontinuous biomass feeding. To better simulate the real conditions of a semi-industrial unit using biomass to heat water or to produce water steam, the particle sizes of the used biomass have already been indicated. Density of the (R.O.P) has been measured and it is equal to 550 kg/m3 [12], average porosity of fixed bed varies from 0.3 to 0.6, and the initial bed height varies as a term of particle sizes (from 30mm to 100mm).
In contrast to several studies deal with different biomasses those have focused on thermal behavior inside the fixed bed [32-35], this study is essentially focused on the thermal attitude on its outside. Therefore, the locations of the thermocouples take this fact into account (see Figure 1b).
The combustion was started by manual ignition at the top layer of the biomass fuel spread on the grate and hence the ignition propagation front moved downwards. After few minutes, the flame was lighting up, temperature measurements have been started.
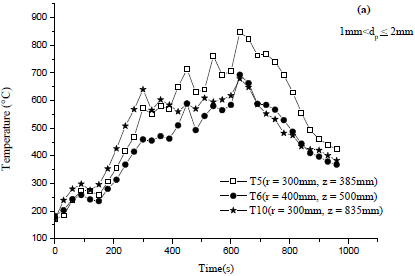
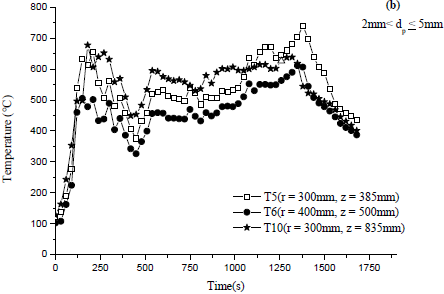
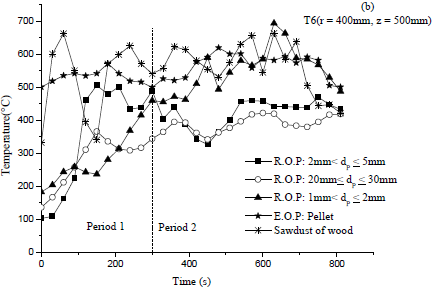
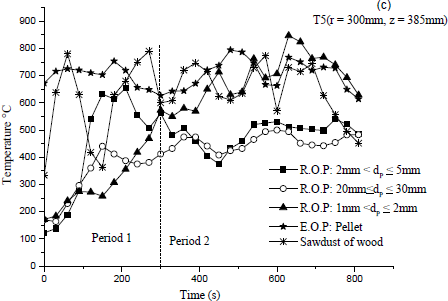
For specified range particle sizes, Figure 5 curves (a, b and c) show the raw olive pomace (R.O.P) temperature distributions versus time at different combustor positions (T5, T6 and T10) above the grate (z=0 mm). Obviously, T5 and T10 could respectively give information on the thermal behavior at the exit of the combustion chamber (first compartment) and at the upper position of the gas flue chamber (second compartment), while T6 coupled with T8 (see Figure 8(a and b)) could help us to evaluate the heat losses through the wall. Before discussing the influence of particle sizes on the combustion process, it is important to explain its mechanism according to these figures (see Figure 5(a, b and c)). Indeed, the three graphical representations highlight two well defined periods during the combustion process, namely, ignition propagation and char oxidation. It can be seen from these curves (Figure 6(a, b and c)) that, for T5, T6 and T10 positions, temperatures increase rapidly from an initial temperature to a peak value relative to each biomass particle sizes (about 650°C, 440°C and 580°C respectively for each figure at the position T5). Furthermore, when the ignition front is fully developed, the char particles (see Table 1; FC: 20.2 % and Ash: 2.8 %, and Figures 3, 4(a, b and c)) which are being oxidized covered the upper layer of biomass fuel (R.O.P) at the same time as volatile matters (see Table 1: VM=74.2% and Figures 3, 4(a, b and c)) are burned in the gas phase after having left the packed bed to generate the flame. Another fundamental aspect of the ignition propagation is also the decrease of the temperatures after reaching various peaks because the ignition front propagates downward into the bed against the air flow, and then they rose again to attain other peaks after a new biomass feed. This sawtooth variation (increase/ decrease of temperatures), due to discontinuous biomass feed, persists until the end of the experimental tests reserved for each particle size (see Figure 5(a, b and c)). Besides, during the ignition period, biomass is represented by four layers which are from the top to the bottom of the fixed bed: Ash, char oxidation, pyrolysis and drying. These last phases are generated by one part of the heat produced by different reactions (char oxidation and gaseous reactions).
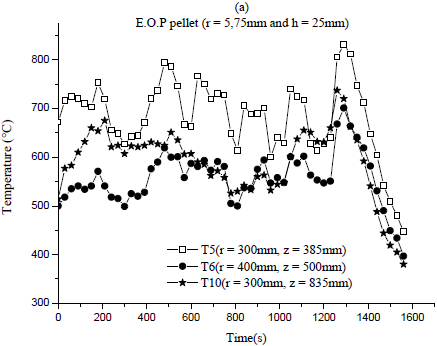
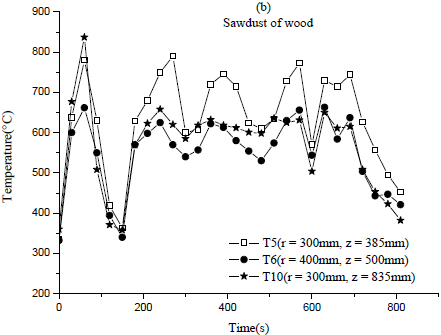
Now let move from untreated biomass fuel (R.O.P) to pelletized fuel (E.O.P) and sawdust of wood which are the industrial biomasses. It should also be pointed out that, generally, pelletized fuel consists in densifying treated biomass over 600 kg/m3 [32-33] and the sawdust of wood is by-product of sanding wood. So, Figure 6 (a and b) show the evolution of temperatures at the same positions defined above. These temperatures undergo the same behavior as those corresponding to raw olive pomace (R.O.P) but their magnitudes are much higher.
To better understand the effect of particle sizes on thermal behavior outside the fixed bed combustor (Figure 7(a to d)), results are presented according to the positions order put in brackets (T8, T6, T5 and T10). For different biomass fuels used in this study, Figure 7a displays temperature distributions at the external wall designed by T8. It shows clearly the chronological order of experimental tests which are distinguished by the initial temperature. The first three tests relative to (R.O.P) were performed successively without taking time to cool the combustor device, and hence the initial temperatures were respectively 26°C, 107°C and 187 °C. Consequently, these initial values lead to completely mask the granulometry effect on the temperature distributions during the first five minutes (period 1) but for the second period (see Figure 7a) its influence is very obvious. In fact, both curves, which correspond to $2mm<d_p≤5mm$ and $20mm≤d_p≤30mm$, are very close to each other, butthe one associated to smaller particles ($1mm<d_p≤2mm$) has higher values by comparison with the two previous curves. Otherwise, it is also clear that temperature distribution of (R.O.P) small particles and the (E.O.P) follow the same evolution and have comparable values.
(a) R.O.P: 1mm<dP£ 2mm
(b) R.O.P: 2mm£dP£ 5mm
(c) R.O.P: 20mm<dP£ 30 mm
Figure 5. Temperature evolution vs time at different positions above the grate
(a) E.O.P pellet (r=5.75mm, h = 25mm)
(b) Sawdust of wood
Figure 6. Temperature variations of E.O.P and sawdust of wood versus time at different positions above the grate
Moreover, the maximal temperature reaches by (R.O.P) is about 270 °C. As for the sawdust of wood, it heats up more and more the external wall combustor which is in direct contact with the heat exchanger device. Figure 7a shows that the external wall temperature increases with decreasing (R.O.P) particle sizes and hence heat released (see Figure 9 (a and b)) which is a guarantee for supplying the external heat exchanger with heat. This is because a smaller particle size improves the moisture evaporation and char burning rates too. Furthermore, it absorbs radiation flux more quickly and raises the burning rate of volatile gaseous fuel which generates higher temperature values. Note that concluding remarks for Figure 7a, especially for period 2, are also valid for Figure 7(b and c) while Figure 7d behaves a little differently since the temperature of large particles ($20mm≤d_p≤30mm$) moves away from that of $2mm<d_p≤5mm$.
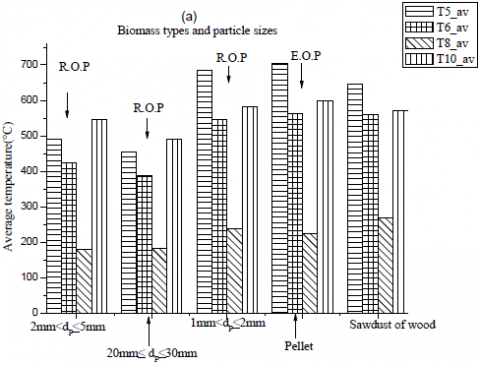
In order to attain the objectives, particularly the possibility of installing two heat exchangers for producing water steam (internal heat exchanger) and hot water (external exchanger) too, it is necessary to quantify magnitudes of the different significant quantities in connection with the heat flux transfer within the combustion device. Figure 8(a and b) provides some additional indication about instantaneous and average heat transfer density that crosses the combustor wall, whereas Figure 9c serves to give some information regarding average temperature at different position of combustor.
(a) Position T8 (r=406mm, z=665mm)
(b) Position T6(r=400mm, z=500mm)
(c) T5(r=300mm, z=385mm)
(d) T10(r=300mm, z=835mm)
Figure 7. Effects of particle size on the temperature distributions at different combustor device positions
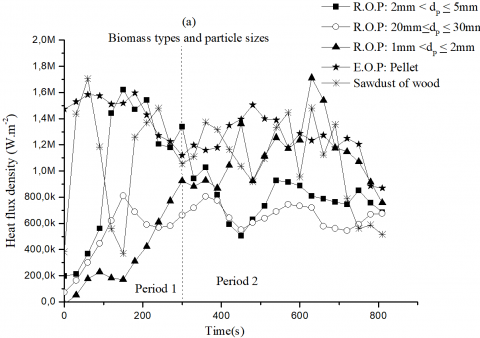
(a) Instantaneous heat flux density
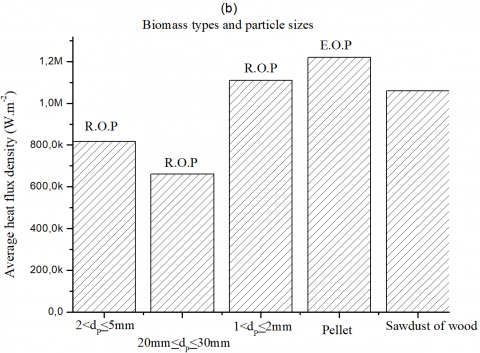
(b) Average heat flux density
(c) Average temperature at different position of combustor
Figure 8. Effects of particle sizes on different thermal quantities
During period 2 (Figure 8a), it is observed that the effects of biomass types and particle sizes on thermal behavior outside the fixed bed combustor, are confirmed. For the three samples (R.O.P with 1mm<dp£5mm, E.O.P and Sawdust of wood), Figure 8b shows that the average heat density exceeds 1MW.m-2.Also, average temperatures, at the inner wall (T6_av) and at the outer wall (T8_av<T6_av), were evaluated for all biomass fuels (Figure 9c). The temperature difference between both sides of the wall generates an important conductive heat flux, described by Fourier’s law, crossing the combustor wall. This difference (T6_av-T8_av) is about 310°C for smaller R.O.P particle sizes. Consequently, the external heat exchanger would receive the necessary quantity of thermal energy for heating up water.
4.2 Combustion gas analysis
Concentrations of exhaust gases such as NOx, CO, CO2, O2 and SO2 are measured by a Kigaz 500 KIMOmulti-gas analyzer. These combustion products are sampled at a heated probe and transported with a heated transfer line to prevent condensation of water vapor. The sampling probe is located at 1.5m above the burner at the exit of the combustion chamber. Table 3 summarizes average values, obtained from instantaneous values, of the flue gas emissions and gas exhaust temperatures. The five cases of biomass with theirs sizes are reported in Table 3. For the different configurations, the experiments are carried out at almost the same excess air.
In fact, the analysis of the combustion gases shows that the emissions of nitrogen oxides (NOx) are very low and sulphur oxides (SOx) ones are practically nil. These are positive results because they are below the pollutant limitation standards [13-14]. For the R.O.P, the NOx emissions are lower in the case 1 with the lower size of biomass particles. The NOx values obtained in the case of sawdust of wood are interesting, but those from EOP are higher. The results of the carbon monoxide (CO) emissions are very different depending on the five cases of biomass. The CO rate of R.O.P cases is lower compared to the EOP and sawdust of wood cases. This could be due to a bad mixing between air and biomass. However, for the first case of R.O.P (2mm<dP£5 mm), the carbon monoxide (CO) emission value is higher than that of the two other cases. Indeed, in the case 2 (20mm £dP£ 30 mm) and case 3 (1mm <dP£ 2 mm), the amount of CO emission is respectively 323 ppm and 415 ppm, while in the case 1 (1mm <dP£ 2 mm) the CO rate is 1181 ppm. These values are close to the current emission standards in several countries [13-14, 36]. The temperature measurements show that the values are about 600°C in average.
Table 3. Temperatures and gas emissions for the five configurations
|
|
R.O.P |
E.O.P |
Sawdust of wood |
||
|
|
Case 1: 2mm<dP£5 mm |
Case 2: 20mm£dP£30 mm |
Case 3: 1mm<dP£2 mm |
||
|
O2 (%) |
19.43 |
16.23 |
16.14 |
11.6 |
19 |
|
CO (ppm) |
1181 |
323 |
415 |
1272 |
15485 |
|
CO2 (%) |
4.90 |
4.23 |
4.31 |
8.4 |
2.7 |
|
NOx (ppm) |
3 |
21 |
49 |
60 |
16 |
|
SOx (ppm) |
0 |
0 |
0 |
0 |
0 |
|
Gas exhaust temperature (°C) |
651 |
668 |
626 |
622 |
593 |
Characterization and combustion of olive pomace in a fixed bed have been done. Three samples were characterized, namely, raw olive pomace (R.O.P), exhausted olive pomace (E.O.P) and deoiled olive pomace (D.O.P). Proximate analysis showed that raw olive pomace (R.O.P) contains volatile matter (74.2%), fixed carbon (20.2%), moisture (7.51%) and ash (2.8%). As for the ultimate analysis, it highlighted that R.O.P has important content percentages of carbon and oxygen (48.2% and 44.3% respectively). Thermogravimetric analysis showed that in the temperature range 150°C to 400°C, the weight loss corresponding to the burnt volatile matter (VM) is ranging between 65% and 75 % for three samples.
During combustion process, two well defined phases are identified; namely, ignition propagation and char oxidation. For the first phase and for each biomass, temperatures increase rapidly from an initial temperature to a first peak (about 600 °C) relative to each sample type and particle sizes. The smaller ones allow reaching maximum temporal average temperature and improve the moisture evaporation and char burning rates. Also, they exhibit maximum average flux density in radial direction.
The analysis of the combustion gases shows that the emissions of nitrogen oxides (NOx) are very low and sulphur oxides (SOx) ones are practically nil. These are positive results because they are below the pollutant limitation standards.
The authors would like to thank the French region "Centre-Val de Loire, France" and the“Institut de Recherche en Energie Solaire et Energies Nouvelles, Rabat, Morroco) for financial support. Thanks are also due to“Biosec" company (Meknès, Morocco) for the supply of exhausted olive pomace (E.O.P).
[1] Li X, Chen G. (2003). A local-world evolving network model. Physical A: Statistical Mechanics and its Applications 328(1): 274-286. http://doi.org/10.1016/S0378-4371(03)00604-6
[2] Kingdom of Morocco. Ministry of Mines Energy and Sustainable Development. http://www.mem.gov.maaccessed on Jun, 2017.
[3] Khan AA, de Jong W, Jansens PJ, Spliethoff H. (2009). Biomass combustion in fluidized bed boilers: Potential problems and remedies. Fuel Processing Technology 90(1): 21-50. http://doi.org/10.1016/j.fuproc.2008.07.012
[4] Collazo J, Porteiro J, Míguez JL, Granada E, Gómez MA. (2012). Numerical simulation of a small-scale biomass boiler. Energy Conversion and Management 64: 87-96. http://doi.org/10.1016/j.enconman.2012.05.020
[5] Shan F, Lin Q, Zhou K, Wu Y, Fu W, Zhang P, Song L, Shao C, Yi B. (2017). An experimental study of ignition and combustion of single biomass pellets in air and oxy-236 fuel. Fuel 188: 277-284. http://doi.org/10.1016/j.fuel.2016.09.069
[6] Forbes EGA, Easson DL, Lyons GA, McRoberts WC. (2014). Physico-chemical characteristics of eight different biomass fuels and comparison of combustion and emission results in a small scale multi-fuel boiler. Energy Conversion and Management 87: 1162-1169. http://doi.org/10.1016/j.enconman.2014.06.063
[7] Kraszkiewicz A, Przywara A, Kachel-Jakubowska M, Lorencowicz E. (2015). Combustion of plant biomass pellets on the grate of a low power boiler. Agriculture and Agricultural Science Procedia 7: 131-138. http://doi.org/10.1016/j.aaspro.2015.12.007
[8] Liu H, Chaney J, Li J, Sun C. (2013). Control of NOx emissions of a domestic/small-scale biomass pellet boiler by air staging. Fuel 103: 792-798. http://doi.org/10.1016/j.fuel.2012.10.028
[9] Chaney J, Liu H, Li J. (2012). An overview of CFD modelling of small-scale fixed-bed biomass pellet boilers with preliminary results from a simplified approach. Energy Conversion and Management 63: 149-156. http://doi.org/10.1016/j.enconman.2012.01.036
[10] Miranda T, Arranz JI, Montero I, Román S, Rojas CV, Nogales S. (2012). Characterization and combustion of olive pomace and forest residue pellets. Fuel Processing Technology 103: 91-96. http://doi.org/10.1016/j.fuproc.2011.10.016
[11] Serrano C, Portero H, Monedero E. (2013). Pine chips combustion in a 50kW domestic biomass boiler. Fuel 111: 564–573. http://doi.org/10.1016/j.fuel.2013.02.068
[12] Abu-Qudais M. (1996). Fluidized bed combustion for energy production from olive cake. Energy 21: 173-178. http://doi.org/10.1016/0360-5442(95)00101-8
[13] Atimtay AT, Topal H. (2004). Co-combustion of olive cake with lignite coal in a circulating fluidized bed. Fuel 83: 859-867. http://doi.org/10.1016/j.fuel.2003.09.015
[14] Topal H, Atimtay AT, Durmaz A. (2003). Olive cake combustion in a circulating fluidized bed. Fuel 82: 1049-1056. http://doi.org/10.1016/S0016-2361(02)00404-0
[15] Jauhiainen J, Martin-Gullon I, Conesa JA, Font R. (2005). Emissions from pyrolysis and combustion of olive oil solid waste. Journal of Analytical and Applied Pyrolysis 74(1-2): 512-517. http://doi.org/10.1016/j.jaap.2004.10.003
[16] Jauhiainen J, Conesa JA, Font R, Mart´ın-Gullón I. (2004). Kinetics of the pyrolysis and combustion of olive oil solid waste. Journal of Analytical and Applied Pyrolysis 72(1): 9-15. http://doi.org/10.1016/j.jaap.2004.01.003
[17] Al-Widyan MI, Tashtoush G, Hamashab AM. (2006). Combustion and emissions of pulverized olive cake in tube furnace. Energy Conversion and Management 47(11-12): 1588-1596. http://doi.org/10.1016/j.enconman.2005.08.007
[18] Miranda MT, Cabanillas A, Rojas S, Montero I, Ruiz A. (2007). Combined combustion of various phases of olive wastes in a conventional combustor. Fuel 86(3): 367-372. http://doi.org/10.1016/j.fuel.2006.07.026
[19] Miranda MT, Esteban A, Rojas S, Montero I, Ruiz A. (2008). Combustion analysis of different olive residues. International Journal of Molecular Sciences 9(4): 512-525. http://doi.org/10.3390/ijms9040512
[20] Baccar R, Bouzida J, Fekib M, Montiela A. (2009). Preparation of activated carbon from Tunisian olivewaste cakes and its application for adsorption of heavy metal ions. Journal of Hazardous Materials 162(2-3): 1522-1529. http://doi.org/10.1016/j.jhazmat.2008.06.041
[21] Encinar JM, González JF, Martínez G, González JM. (2008). Two stages catalytic pyrolysis of olive oil waste. Fuel Processing Technology 89: 1448-1455. http://doi.org/10.1016/j.fuproc.2008.07.005
[22] Petrov N, Budinova T, Razvigorova M, Parra P, Galiatsatou P. (2008). Conversion of olive wastes to volatiles and carbon adsorbents. Biomass and Bioenergy 32(12): 1303-1310. http://doi.org/10.1016/j.biombioe.2008.03.009
[23] Koukouch A, Idlimam A, Asbik M, Sarh B, Izrar B, Bostyn S, Bah A, Ansari O, Zegaoui O, Amine A. (2017). Experimental determination of the effective moisture diffusivity and activation energy during convective solar drying of olive pomace waste. Renewable Energy 101: 565-574. http://doi.org/10.1016/j.renene.2016.09.006
[24] Chouchene A, Jeguirim M, Khiari B, Trouvé G, Zagrouba F. (2010). Study on the emission mechanism during dévolatilisation/char oxidation and direct oxidation of olive solid waste in a fixed bed reactor. Journal of Analytical and Applied Pyrolysis 87(1): 168-174. http://doi.org/10.1016/j.jaap.2009.11.008
[25] Koukouch A, Idlimam A, Asbik M, Sarh B, Izrar B, Bah A, Ansari O. (2015). Thermophysical characterization and mathematical modeling of convective solar drying of raw olive pomace. Energy Conversion and Management 99: 221-230. http://doi.org/10.1016/j.enconman.2015.04.044
[26] Elorf A, Mrad NK, Boushaki T, Sarh B, Chaoufi J, Bostyn S, Gokalp I. (2016). Swirl motion effects on flame dynamic of pulverized olive cake in vertical furnace. Combustion Science and Technology 188(11-12): 1951-1971. http://doi.org/10.1080/00102202.2016.1214419
[27] Werther J, Saenger M, Hartge EU, Ogada T, Siagi Z. (2012). Combustion of agricultural residues. Progress in Energy and Combustion Science 26(1): 1-27. http://doi.org/10.1016/S0360-1285(99)00005-2
[28] Kastanaki E, Vamvuka D. (2006). A comparative reactivity and kinetic study on the combustion of coalbiomass char blends. Fuel 85(9): 1186-1193. http://doi.org/10.1016/j.fuel.2005.11.004
[29] Cagnon B, Bonnamy S, Pineau A, Charpentier JP, Asbik M, Sarh B. (2016). Combustion and carbonization of olive-pomaces dried using solar process. Presented at Carbon 2016; The World Conference on Carbon: common fundamentals remarkably versatile applications, Pennsylvania, USA (2016-07-10 - 2016-07-15). https://prodinra.inra.fr/record/362301
[30] Xu F, Yu J, Tesso T, Dowell F, Wang D. (2013). Qualitative and quantitative analysis of lignocellulosic biomass using infrared techniques: A mini-review. Applied Energy 104: 801-809. http://doi.org/10.1016/j.apenergy.2012.12.019
[31] Jenkins BM, Baxter LL, Miles TR, Miles TR Jr. (1998). Combustion properties of biomass. Fuel Processing Technology 54(1-3): 17-46. http://doi.org/10.1016/S0378-3820(97)00059-3
[32] Ryu C, Yang YB, Khor A, Yates NE, Sharifi VN, Swithenbank J. (2006). Effect of fuel properties on biomass combustion: Part I. Experiments-fuel type, equivalence ratio and particle size. Fuel 85(7-8): 1039-1046. http://doi.org/10.1016/j.fuel.2005.09.019
[33] Porteiro J, Patino D, Collazo J, Granada E, Moran J, Miguez JL. (2010). Experimental analysis of the ignition front propagation of several biomass fuels in a fixed-bed combustor. Fuel 89(1): 26-35. http://doi.org/10.1016/j.fuel.2009.01.024
[34] Yang YB, Ryu C, Khor A, Sharifi VN, Swithenbank J. (2005). Fuel size effect on pinewood combustion in a packed bed. Fuel 84(16): 2026-2038. http://doi.org/10.1016/j.fuel.2005.04.022
[35] Khor A, Ryu C, Yang YB, Sharifi VN, Swithenbank J. (2007). Straw combustion in a fixed bed combustor. Fuel 86(1-2): 152-160. http://doi.org/10.1016/j.fuel.2006.07.006
[36] Lou JC, Huang CC, Yang TL. (1999). Effect of excess air on combustion efficiency and emissions from incineration of municipal solid waste. Journal of the Chinese Institute of Environmental Engineering 9(4): 219-227.