OPEN ACCESS
The test studies the gas-liquid two-phase flow characteristics in pump-assisted evacuation process for hilly-terrain pipeline system. In pump-assisted evacuation process, there appear two flow patterns: stratified flow and slug flow. By means of reducing upstream back pressure, the pump-assisted evacuation can increase the liquid flow rate, promoting the transition of flow pattern. For the pipe-bottom pressure change process, it increases firstly, then decreases, and slowly increases at last. During the process of pressure drop, there will appear temporary buffer section for the slug accumulation. The pressure fluctuation doesn’t increase with inlet superficial gas velocity, and the max fluctuation range appears in the working condition with 0.88m/s superficial gas velocity. The outlet liquid flow rate corresponds to the pressure fluctuation. Four stages are divided for the variation process. The flow rate is less influenced by the inlet superficial gas velocity, but more influenced by the inclined angle. By using gas front-end velocity meter to check the evacuation efficiency, it is found that with inclined angle of upward inclined pipe (UIP) unchangeable, the higher the gas superficial velocity, the greater the gas front-end velocity, presenting an approximate linear relationship; with the gas superficial velocity unchangeable, the gas front-end velocity almost remains the same, even with the inclined angle of upward inclined pipe increasing.
Hilly-terrain Pipeline, Pump-assisted Evacuation, Gas Liquid Flow, Flow Pattern Transition, Pressure Fluctuation
n pipeline gas-cap evacuation process, it is very hard to be emptied only with air compressor pumping into the pipe sections between two pump stations (except the continuous down-grade line), since the working pressure of air compressor differ greatly from that of pump station. As one effective method to reduce gas-liquid mixing section length and improve the evacuation efficiency, pump-assisted evacuation aims to form the state of “compressed air pushing and booster pump assisted-pumping” by adding booster pump at original oil transmittal pump station, decreasing gas waste and improve evacuation efficiency. The sliding vane pumps are mostly used as assisted pump for its availability to transmit gas-liquid mixture.
In recent years, many scholars have studied the mixture flow in the evacuation process of mobile pipeline gas cap [1-3]. The scholars, such as Jiang Junze etc. [4], have built the transient model of field gas pipe line evacuation process, including gas motion equation, liquid motion equation and coupled equation of phase interface, and adopted finite volume method to solve the model. Also, Liu Zhenjiang [5] etc. established the pressure drop model in different working conditions by dividing the evacuation pipelines into different sections such as pure gas section, gas-liquid mixture section and pure liquid section. The key issue in the gas-cap evacuation process was the gas-liquid mixture section in upgrade pipeline, which not only has greatly increased the degree of oil-gas mixing and caused serious oil waste, but also brought challenges for flow pattern judgement and pressure drop calculation in the evacuation process. Hence, it is imperative to adopt the new pump-assisted evacuation method to improve gas-cap evacuation technique. This paper mainly aims to study the flow pattern of upward inclined pipe, pressure fluctuation characterizes at pipe bottom and pipeline outlet flow variation in pump-assisted evacuation process, so as to draw the conclusions and suggestions guiding mobile pipeline evacuation in actual operation.
2.1 Test facility
The whole test facility for pipeline evacuation was composed of water flooding system and evacuation system as shown in Figure 1. The flooding system made of centrifugal pump, water tank and valve filled the pipeline with water before evacuation; the evacuation system of air compressor, sliding vane pump. flow meter and organic glass tube. In the test, use the piston-type air compressor at rated discharge capacity 18m3/h and discharge pressure 0.1Mpa, install gas buffer tank at air compressor outlet to ensure stable flow rate, and inject gas into pipeline with the discharge pressure controlled by ball valve at pump outlet; adopt the light-oil sliding vane pump SUB50-15/40 as shown in Table 1 for related parameters. The pipeline system was composed of downward micro-inclined pipe (organic glass tube), elbow (steel-wired rubber tube) and upward inclined pipe (organic glass tube). The downward micro-inclined pipe was designed to ensure gas-liquid mixture in stratified flow status before entering upward inclined pipe, avoiding disturbing the flow pattern of upward inclined pipe which is 2m long with 40mm inner diameter. MIK-P300 pressure sensors (range between-0.1-0.1Mpa, and accuracy class 0.1) were installed respectively at air compressor outlet, bottom and top of upper inclined pipe). For capturing the sharp image of pipeline flow status, FAST CAM Ultima 512 high-speed camera with 500 FPS collection speed was installed 1m away from the pipe line in the middle location of upward inclined pipe.
Table 1. Parameters of sliding vane pump tested
|
Type No.
|
Differential Pressure /Mpa |
Rated Flow / m3·h-1 |
Rotation /r·min-1 |
Efficiency / % |
|
SUB50-15/40 |
0.4 |
15 |
1440 |
71 |
Figure 1. Experiment schematic
2.2 Test procedure
At 17°C indoor temperature, firstly open the valve 2 # and 3#, close the valve 1# and 4#, and turn on the centrifugal pump to inject water into pipeline until the pipeline is filled with liquid by observing the glass tube; then turn off the centrifugal pump, and valve 2 and 3#. The evacuation started with opening valve 1/4/5#, air compressor and sliding vane pump at the same time. Change the opening degree of air compressor discharging valve 1# to keep inlet gas velocity within test specified range, and change the opening of relay valve 5# to control liquid flow rate. The inlet valve 5# of sliding vane pump was called relay valve, which opening could influence the front pipe friction, change the liquid flow rate for adjusting its assisted efficiency. Use high-speed camera to record flow process in the upward inclined pipe, close the air compressor after evacuation, and open the elbow to drain the residue. Conduct the next test with inlet gas flow rate 0.44~1.32m/s and inclined angle range 5°~25° by changing the inclination of upward inclined pipe. Make records of the pipe-bottom pressure, outlet flow, and flow status of upward inclined pipe.
3.1 Flow pattern changing rule in liquid evacuation process
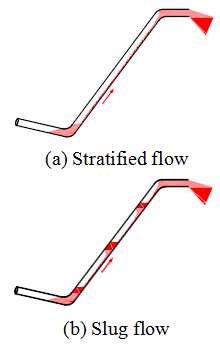
The test shows that two flow patterns called as stratified flow and slug flow appeared in the upward inclined pipe during the pump-assisted evacuation process as shown in Figure 2. It was difficult to form bubble flow, because the booster pump was opened to speed up liquid flow rate and reduce the back pressure of upper pipe, increasing the differential pressure at two ends of pipe, which was far greater than the static pressure and friction of the liquid in upward inclined pipe; so the gas could rapidly flow into upward inclined pipe within a short time, and drive the liquid slug to be sprayed at high speed.
Figure 2. Flow pattern of evacuation process
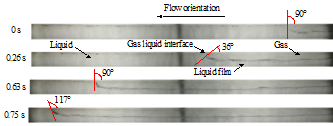
Figure 3 and 4 shows the high-speed images of stratified flow and slug flow respectively in the development process of upward inclined pipe. It can be concluded in Figure 3 that the liquid layer thickness of stratified flow basically remains the same, but the included angle of the gas-liquid interface at front end of gas in horizontal direction decreased firstly and then increased, because at first the gas velocity was over liquid, and the more the gas intruded into liquid, the smaller the inclined angle of the interface; also in the evacuation process, the liquid velocity was gradually accelerated to be over gas velocity finally, and then it got less for gas intrusion while the inclined angle of the interface became larger.
Figure 3. High speed photograph of stratified flow(USG=1.32m/s, θ=5°)
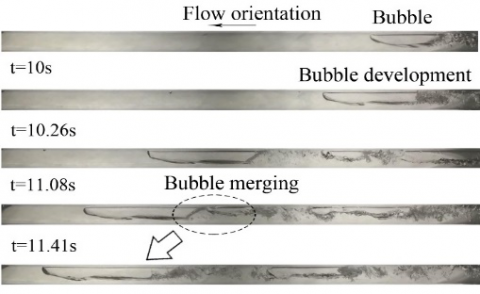
With gas velocity decreases, the gas couldn’t rapidly and continuously flow into the upward incline pipe, which made the internal liquid to be dispersed by gas; the gas-liquid mixture flew intermittently in the form of big bubbles and slugs, converting the flow pattern from stratified flow to slug flow in the upward inclined pipe as shown in Figure 4. The Taylor bubbles have passed three stages: generation, growth and merging. Generated at the inlet, the bubbles gradually merged with the previous ones, while the leading bubbles increased constantly to achieve max value at pipe top; at t=10 s, gas flowing into upward inclined pipe, Taylor bubbles were formed, and then the leading bubbles merged with following bubbles continuously as shown in Figure 4 (t=11.08 ~ 11.41 s) for merging details.
Figure 4. High speed photograph of slug flow (USG=0.44m/s, θ=20°)
Figure 5 shows the flow pattern of pump-assisted evacuation for upward inclined pipe. The stratified flows were mostly found in high-gas velocity and small inclined-angle areas, because the smaller the inclined-angle was, the smaller the static pressure, and the more the gas flow rate was, the greater the gas pressure, which made it easier for the liquid to be drained at one time and for the gas-liquid mixture to form stratified flow. The slug flows were centred on low gas-velocity and large inclined-angle area, because the lower the gas velocity was, the worse the liquid-carrying capacity for the gas, and the larger the angle, the greater the static pressure of the liquid, which made it easier for the liquid to form terrain slug in evacuation process.
Figure 5. Flow patterns of pump-assisted evacuation
3.2 Variation rule of pipe-bottom pressure
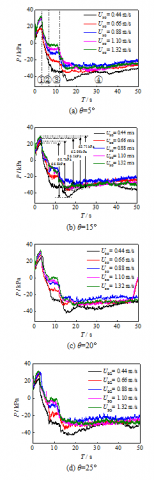
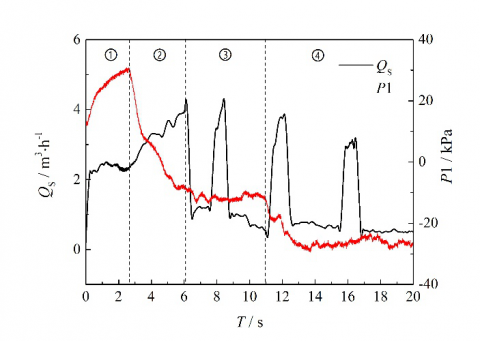
Figure 6 shows the variation rule of upward inclined pipe-bottom pressure over time at different inlet superficial gas velocity. Keep the opening degree of relay valve to be 0.6, to avoid exaggerated vacuum degree and liquid velocity. Generally, the pipe-bottom pressure increases firstly, then decrease, and rises slowly at last, which can be divided into four stages marked with sequence number respectively in Figure 6(a) . At stage 1, with pressure increased, open the sliding vane pump and air compressor simultaneously, but the measured points were farther from sliding vane pump and closer to air compressor, thus, the barotropic pressure wave by air compressor was firstly transmitted to measured points, causing the pipe-bottom pressure of upward inclined pressure to rise, and the higher the gas velocity, the bigger the pressure increases. At stage 2, pressure decreased, because the suction waves by sliding vane pumps have transmitted to the measured points, and the liquid inside started accelerated movement by pumping and pushing of air compressor. With the differential pressure of sliding pump far above the power by air compressor, the sliding vane pump played a leading role in liquid evacuation process and the pipe-bottom pressure decreases sharply [6][7]. At stage 3, the pressure drop stopped. The pipe-bottom pressure started to remain stable at this stage, because the liquid inside the pipe was erupted by the exhausted transient gas-liquid mixture, while there existed some recoil force at the pipe outlet applied to internal gas, sealing the pipe bottom with the retreated gas, which causes the suction wave of booster pump to be un transmittable. At stage 4, the pressure started to rise stably, but less than the previous two stages. The reason was that the air compressor blew into the pipe continuously at lower inlet superficial gas velocity, and the discharge pressure was less than the pumping pressure of the sliding vane pump which cannot entirely offset the negative pressure by sliding vane pump. Hence, only little liquid vibrated in the pipe while gas was the big part there.
The Figure 6 also shows, at different inlet superficial gas-velocity it takes almost the same time for the pressure to achieve the peak value and stable value, i.e. inlet gas velocity has no impact on the pump-assisted evacuation time, because with the liquid dominated in sliding vane pump during the liquid evacuating process, the pump has rather high efficiency, while with greater differential pressure, the pipe liquid velocity is mainly determined by sliding vane pump, and the air compressor has small impact on evacuating efficiency. However, for the first three stages, the pressure increases with the inlet superficial gas velocity, thus the air compressor has higher impact on pipe pressure than on the flow rate. It is found in Figure 6 (b) , the pressure fluctuation doesn’t increase with the inlet superficial gas velocity, with the max fluctuation ranges in the working condition of 0.88m/s gas velocity.
Figure 6. Bottom pressure variation for different inlet velocity
3.3 Variation of flow rate
Figure 7 shows the variation rule of outlet flow rate in pump-assisted evacuating process and the relationship with pipe-bottom pressure. At stage 1 shown in Figure7, with liquid flow rate as fixed value, this stage was considered as quasi-steady state process, because the air compressor played the main role then, the pipeline length was rather short, and the valve opened slowly with inconspicuous transient effect. But at stage 2 with booster pump and air compressor, the flow rate started to increase at 2m3/h; it was rapid pressure drop stage for evacuating mainly: the pressure and flow rate variation both presents transient nature, and most of the liquids was discharged after the gas front end separated from the upward inclined pipe. The flow rates at stage 3 and 4 present non-periodic vibration, indicating that little liquid slug flew out of the pipe line.
Figure 7. Outlet liquid flowrate and pressure fluctuation of P1 (USG=0.88m/s, θ=5°)
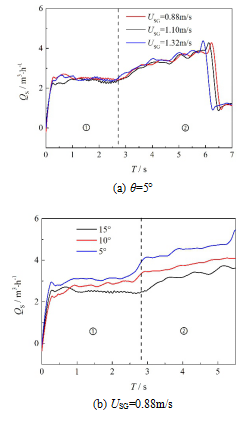
Now the influence factor for flow rate shall be discussed mainly for the first two stages as the key ones for evacuation process. Figure 8 shows the changes in the relationship between outlet flow rate and inclined angle. In Figure 8 (a) , at 5° inclined angle, the liquid flow rate is less influenced by inlet superficial gas velocity, and the curves of liquid flow rate in three working conditions are basically overlapped, because the differential pressure by booster pump is far beyond the pressure by air compressor with constant inclined angle; then the liquid flow rate during the evacuating process is mainly controlled by booster pump with fixed rotation and differential pressure in various working condition. Figure 8 (b) shows the changes in the relationship between outlet liquid flow rate and inclination angle of upward inclined pipe at fixed inlet superficial gas velocity. It is found that the variation trend of flow rate at different angles tends to be the same, but the bigger the inclined angle is, the less the liquid flow rate, since with larger inclined angle and liquid static pressure, it needs to overcome more resistance for evacuation.
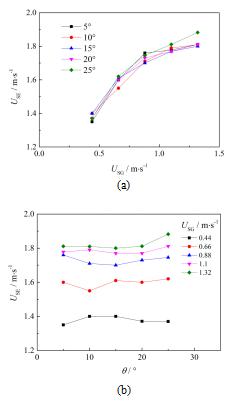
In evacuation process, it is very important to exactly predict the evacuation velocity. Call the speed of the interface between the most front of the gas and the liquid as front end velocity as shown in figure 3 “Gas liquid interface”, which can represent evacuation velocity. The motion velocity at front end doesn’t mean the flow rate of terminal liquid, so the velocity at front end cannot be judged by detecting the outlet liquid flow rate [8]. By means of organic glass tube and high speed camera, this paper captures the motion at front end so as to calculate the motion velocity at front end. The analysis above shows that, divided the glass tube length by the time from front end to glass tube, the front end velocity can be calculated. The Figure 9 shows the relationship between the inclined angle and the gas front-end velocity with the changing of inlet superficial gas velocity.
Figure 8. Outlet liquid flowrate vs. gas superficial velocity and inclination angle
Figure 9(a) shows that the front end velocity increases with the gas superficial velocity, following an approximate linear relationship, when the inclined angle of the upward inclined pipe keeps constant. In evacuation process, liquid pressure was the difference between upstream gas pressure and downstream sliding vane pump inlet pressure; with the inlet pressure of sliding vane pump unchangeable, the gas front-end velocity only depend on gas pressure which varies with its quality, thus, the higher the gas superficial speed, the greater the gas front-end speed.
Figure 9 (b) shows that the front end velocity doesn’t change with the inclined angle of upward inclined pipe at the same gas superficial velocity. Based on the research literature [11], the liquid slug velocity decreased with the inclined angle increasing, because the differential pressure at two pipe ends increased with the larger hydraulic head on gas-liquid interface. The gas forward speed was influenced by differential pressure and also its moving pattern in liquid for the gas was regarded as large bubble in evacuation. According to other research literature [12] [13], the bubble speed increased with the inclined angle, and the max velocity can be reached at 60°. In conclusion, as the inclined angle increases, the front-end speed should remain approximate constant. The previous researches for the bubble flow in the liquid mostly adopted the method of releasing bubbles into upward inclined pipe in the atmospheric pressure condition, without reaching an agreed conclusion for movement speed which was only related to pipeline length, diameter and physical parameters etc. Furthermore, the bubble movement speed showed certain particularity, because the special working condition using the air compressor to fill gas at the inlet and the sliding vane pump to pump at the outlet was applied in this paper.
Figure 9. Gas cap velocity vs. superficial gas velocity and inclination angle
The test studies the flow pattern of upward inclined pipe, pipe-bottom pressure characteristics and outlet flow rate variation in the evacuation process, the following conclusions are made:
(1) For the upward inclined pipe in pump-assisted evacuation process, there are two flow patterns: stratified flow and slug flow; the former appears in the working conditions of high gas velocity and small inclined angle; while the latter in the working condition of low gas velocity and large inclined angle.
(2) For the pipe-bottom pressure, it increases firstly, then decreases, and slowly increases at last. During the process of pressure drop, there will appear temporary buffer section for the slug accumulation. The pressure fluctuation doesn’t increase with inlet superficial gas velocity, and the max fluctuation range appears in the working condition with 0.88m/s superficial gas velocity.
(3) The outlet liquid flow rate corresponds to the pressure fluctuation. Four stages are divided for the variation process. The flow rate is less influenced by the inlet superficial gas velocity, but more influenced by the inclined angle.
(4) By using gas front velocity meter to check the evacuation efficiency, it is found that with inclined angle of upward inclined pipe unchangeable, the higher the gas superficial velocity, the greater the gas front-end velocity, presenting an approximate linear relationship; with the gas superficial velocity unchangeable, the gas front-end velocity almost remains the same, even with the inclined angle of upward inclined pipe increasing.
This work is supported by Graduate Innovation Fund of Logistical Engineering University (20151230), Chongqing Postdoctoral Special Finance Project (xm2016026).
[1] Jiang J.Z., Zhang W.M., Yong Q.W., Jiang M. (2017) . Analysis of the influencing factors and mechanism of gas draining rate of mobile pipeline, Binggong Xuebao/Acta Armamentarii, Vol. 38, No. 3, pp. 585-592. DOI: 10.3969/j.issn.1000-1093.2017.03.023
[2] Jiang J., Zhang W., Yong Q., Jiang M. (2016). Experimental study on characteristics of the liquid holdup during mobile pipe draining, Journal of Experiments in Fluid Mechanics, Vol. 30, No. 4, pp. 48-55. DOI: 10.11729/syltlx20150152
[3] Guo R., Zhang W.M., Jiang J.Z. (2017). Numerical simulation of mobile pipeline gas-gap emptying based on OLGA, Journal of Chemical Engineering of Chinese Universities, Vol. 2, No. 2, pp. 337-345. DOI: 10.3969/j.issn.1003-9015.2017.02.012
[4] Jiang J.Z., Zhang W.M., Duan J.M. (2016). A transient model of gas-liquid two-phase flow for mobile pipeline draining, Acta Armamentaria, Vol. 37, No. 4, pp. 1536-1542. DOI: 10.3969/j.issn.1000-1093.2016.08.028
[5] Wang X.D., Hou K.P., Liu J., Wang X.Y. (2016). Study of jet flow and dust motion in flat chambers based on theory of gas-solid two phase flow, International Journal of Heat and Technology, Vol. 34, No. 2, pp. 261-267. DOI:10.18280/ijht.340215
[6] Bounaouara H., Ettouati H., Ticha H.B., Mhimid A., Sautet J.C. (2015). Numerical simulation of gas-particles two phase flow in pipe of complex geometry: Pneumatic conveying of olive cake particles toward a dust burner, International Journal of Heat and Technology, Vol. 33, No. 1, pp. 91-98. DOI: 10.18280/ijht.330114
[7] Rafiee S.E., Sadeghiazad M.M. (2016). Three-dimensional CFD simulation of fluid flow inside a vortex tube on basis of an experimental model- the optimization of vortex chamber radius, International Journal of Heat and Technology, Vol. 34, No. 2, pp. 236-244. DOI: 10.18280/ijht.340212
[8] Naas T.T., Lasbet T., Benzaoui A., Loubar K. (2016). Characterization of pressure drops and heat transfer of non-Newtonian power-law fluid flow flowing in chaotic geometry, International Journal of Heat and Technology, Vol. 34, No. 2, pp. 251-260. DOI: 10.18280/ijht.340214
[9] Sharma P., Kumar N., Sharma T. (2016). Entropy analysis in MHD forced convective flow through a circular channel filled with porous medium in the presence of thermal radiation, International Journal of Heat and Technology, Vol. 34, No. 2, pp. 311-318. DOI: 10.18280/ijht.340222
[10] Yang J.J., Dong D.W., Meng Z.W., Yang Y.H., Wang Y. (2016). Different types of flow field and engine performance of the vortex throttle, International Journal of Heat and Technology, Vol. 34, No. 2, pp. 319-324. DOI: 10.18280/ijht.340223
[11] Liu Z.J., Zhang W.M., Guo R. (2016). A calculation method on the pressure drop in the process of gas displacing-oil pipeline emptying, Oil & Gas Storage and Transportation, Vol. 35, No. 12, pp. 1306-1313.
[12] Li T., Zhang W.M., Zhou L.J. (2013). Theoretical and experimental study on sliding-vane and centrifugal pumps used in series, Journal of Logistical Engineering University, Vol. 2, No. 2, pp. 48-51.
[13] Tao L.I., Zhang W., Jiang M. (2014). Performance test on sliding-vane pump and performance curve fitting, Machine Tool & Hydraulics, Vol. 42, No. 5, pp. 35-37.
[14] Cui R., Li N.L., Dai Y. (2011). Effect of topside choking on pressure characteristics in an S-shaped flexible riser, Journal of Xian Jiaotong University, Vol. 45, No. 10, pp. 122-126.
[15] Pedersen S., Durdevic P., Yang Z. (2016). Challenges in slug modeling and control for offshore oil and gas productions: A review study, International Journal of Multiphase Flow, Vol. 1, No. 88, pp. 270-284. DOI: 10.1016/j.ijmultiphaseflow.2016.07.018
[16] Ehinmowo A.B., Ogunleye O.O., Orodu O.D. (2016). Experimental investigation of hydrodynamic slug mitigation potential of an intermittent absorber, Chemical Engineering Research & Design, Vol. 113, No. 113, pp. 50-60. DOI: 10.1016/j.cherd.2016.07.006
[17] Li N.L., Guo L.J. (2013). Stability analysis and numerical simulation of riser topside choking on the elimination of severe slugging, Journal of Engineering Thermophysics, Vol. 34, No. 7, pp. 1279-1282.
[18] Liu Y., Wang P., Hu X., Zhang H., Du Z. (2015). Visualization research on characteristics of the cryogenic slug flow in vertical and inclined tubes, Canadian Journal of Chemical Engineering, Vol. 90, No. 6, pp. 1588-1601. DOI: 10.1002/cjce.20645
[19] Mayor T.S., Pinto A.M.F.R., Campos J.B.L.M. (2007). Hydrodynamics of gas–liquid slug flow along vertical pipes in turbulent regime: A simulation study, International Journal of Heat & Fluid Flow, Vol. 85, No. 11, pp. 1497-1513. DOI: 10.1205/cherd06245
[20] Hout R.V., Shemer L., Barnea D. (2003). Evolution of hydrodynamic and statistical parameters of gas–liquid slug flow along inclined pipes, Chemical Engineering Science, Vol. 58, No. 1, pp. 115-133. DOI: 10.1016/S0009-2509(02) 00441-4
[21] Hout R.V., Barnea D., Shemer L. (2001). Evolution of statistical parameters of gas–liquid slug flow along vertical pipes, International Journal of Multiphase Flow, Vol. 27, No. 9, pp. 1579-1602. DOI: 10.1016/S0301-9322(01)00016-7