OPEN ACCESS
As the determinant of thermal propagation velocity and temperature field distribution within rocks, the effective thermal conductivity is not only influenced by the structure characteristics of medium (e.g. mineral compositions, porosity and micro cracks), the multiphase flow characteristics (e.g. saturation and water vapor content), and temperature, but also deeply affected by the multi-field coupling within rock masses. Mudstone contains non-clay minerals and clay minerals, which split apart from each other owing to the difference in thermal expansion coefficient. With the aim to analyze the temperature effect on the slaking characteristics of mudstone during dry-wet cycles, this paper performs the sieving test on air-dry fragments obtained from the dry-wet cycle test. With a customized test device, three dry-wet cycles are conducted on five samples at 60°C, 90°C, 105°C, 120°C and 180°C, respectively. The grains are divided into 4 categories: coarse grains (d³15mm), medium grains (7mm£d<15mm), fine grains (0.075mm£d<7mm) and particles (d<0.075mm). The mass percentage, number of fragments, specific surface area and fractal dimension are calculated after the dry-wet cycle test. The test results show that: the mass percentage of coarse grains decreases but that of medium and fine grains increases as temperature rises, indicating that higher temperature causes higher fragmentation and finer grains; the number of medium and fine grains grows, while that of coarse grains increases firstly and then decreases with the rise of heating temperature, and the fragmentation becomes more obvious after the temperature reaches 120°C; the specific surface area and the fractal dimension of the samples increase with the increase of temperature. The difference in mudstone fragmentation is mainly attributed to mineral composition and pore-fracture structure. The high temperature environment is conducive to mudstone fragmentation and the dry-wet cycles act as the driving engine of the rapid disintegration of mudstone.
mudstone, temperature-induced effects, rock fragmentation, dry-wet cycles, sieving test, fractal dimension
Rock masses in Southwest China are dominated by inter-bedded sandstone and mudstone. As the result of deposition in still water, mudstone is generally composed of clay and silt-sized particles [1]. Mudstone is relatively stable in enclosed environments, but when water is drawn into the rock by the action of strong capillary forces which compress air in its path, resulting in disruption of the rock [2]. The main external causes of rock decay are insolation and rainfall; besides, seasonal weather changes can also lead to deterioration of rocks [3-4]. Some types of mudstone can hold together when immersed in water or heated individually, but will still break apart if subjected to repeated wetting and drying [5-7].
Mudstone breakage during dry-wet cycles is an energy dissipation process, in which micro-scale damages are accumulated into macro-level fragmentation. In this process, multi-scale defects (joints, fractures, cracks, voids, etc.) emerge, develop and propagate in rock masses. Good statistical self-similarity [8] and fractal property [9-10] are displayed in the geometrical features of the structural development and the numerical characteristics of the evolution of mechanical or physical quantities. At present, the sieving test, fragmentation analysis and fractal theory are extensively applied in quantification of the scale distribution characteristics of rock fragmentation [11-14].
Perfect [10] summarized the fractal models for rock and soil fragmentation, pointing out that: 1) a set of fractal algorithms was available for modeling the fragmentation of classical soil masses, pre-decomposition of porous media and surface pre-decomposition; 2) a parallel set of fractal algorithms had been developed for the structural failure of brittle materials based on the propagation of a single irregular crack; 3) fractal models for rock and soil fragmentation were relatively well developed, but were in lack of experimental verification; 4) fractal models provided both description and prediction functions. Xie et al. [11] systemically introduced the application of fractal theory in rock fracturing and fragmentation, including the micro fracture of rocks, dynamic propagation of macro cracks, and fragmentation distribution of fractured rock masses. Hirata [8] examined the self-similarity of rock fracture geometry by box-counting algorithm, revealing good statistical self-similarity (fractal structure) of the fault fracture systems at the scale of about 2 to 20km. Hecht [15] explored the fractal models for densely packed non-cohesive rocks, and conducted shear-box experiments on materials with distinct grain size distributions; the results showed that fractal mixtures boasted far better mechanical strength than non-fractal mixtures. Hence, fractal technologies should be adopted more systematically in reference to the results of material testing experiments in engineering geology. Carpinteri et al. [16] evaluated the impact of fragment size distribution on energy density dissipation and related size effect, and suggested that fragments derived from a given specimen appear geometrically self-similar at any of the observation scales. Chen et al. [17] probed into the variation of the particle size distribution in a small watershed under different land uses and analyzed the effect of the variation on the corrodibility of purple soil. Hou et al. [18] studied the fragmentation features of brittle rock at different impact stress or strain rates by dynamic impact testing, and found that the fractal dimension increased with the growth of specimen stress and the decline of dominant fragment size. Wang et al. [19] applied the fractal geometry theory and MATLAB software to analyze the fractal characteristics of fracture network of overburden stratum. The results showed that the overburden failure evolution was trapezoidal, accompanied with collapse in formation and fluctuations in fracture height. Ma et al. [20] revealed that the dominant fracture mechanisms were related to the grain morphology: the more complex the shape of grains, the more variable the fracture patterns deviating from simple vertical splitting.
As listed above, the previous studies are limited to the characteristics of rock fragmentation under various loads. However, the failure behavior and fragmentation characteristics of rock masses are greatly affected by the large number of natural joints, cracks and other structural surfaces. Moreover, mudstone is easily weathered and disintegrated under the sun and rainfall. Under natural conditions, wetting and drying are known as the main processes responsible for the physical disintegration of mudstone [21]. The exposure to dry-wet cycles breaks down the cementing agents of mudstone, resulting in mechanical erosion [22], and disintegrates the stone into gravel and sand-sized particles [23-24]. Temperature is also an important determinant of physical rock decay. Coupled with moisture, temperature variations can change the moisture in rocks, especially the water phase, leading to swelling and shrinking [25], freezing and thawing [26-27], the loss of easily soluble elements, and the ultimate deterioration of rocks [28].
Therefore, this paper adopts a customized test device and an original test method of dry-wet cycles in the experiment, and carries out the sieving test on rock fragments after dry-wet cycles, aiming to disclose the effect of different temperatures on the fragmentation characteristics of mudstone after dry-wet cycles. The change rules of the fragmentation distribution, specific surface area and fractal dimension are discussed based on experimental results.
2.1 Dry-wet cycle test
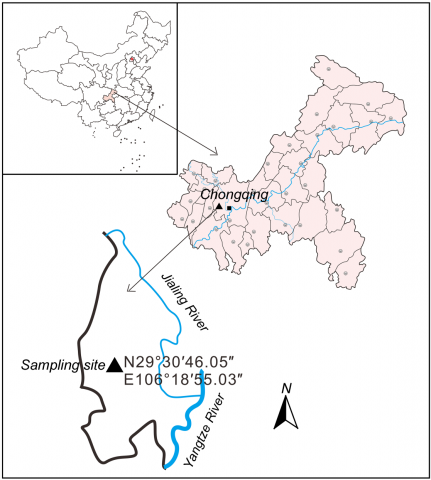
The experimental materials are typical mudstone sampled from the mudstone layers of the Suining Formation (lithostratic unit: J3s) located in Jinfeng District, Chongqing, Southwest China (29°30′46.05″N, 106°18′55.03″E). Chongqing is located where the Yangtze River and Jia-ling River meet [29]. Figure 1 shows the sampling site. The sampled region has a subtropical climate, with an annual average temperature of 18.4°C and rainfall of 1,151.5mm. Featuring warm climate, plenty rainfall and abundant sunshine, this region is extremely warm during the rainy season, resulting in strong and frequent dry-wet cycles under natural conditions.
Figure 1. Sampling site
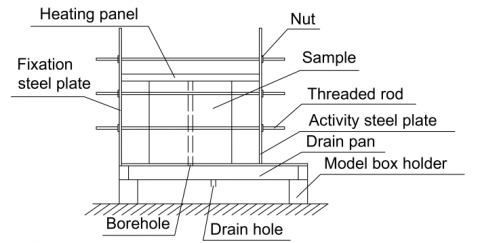
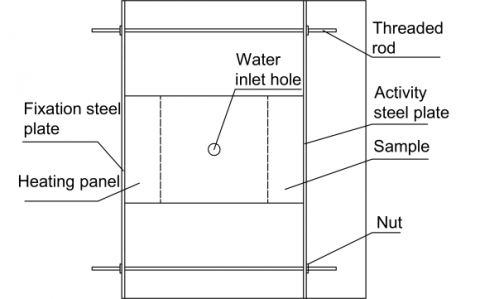
As shown in Figure 2, the customized testing device consists of a container, a thermostat-controlled heating panel and a water supply and drainage unit. The sample is placed in the container, and lateral restraints are provided to the sample by tightening the nuts of the moving steel plate. The heating panel is in series with a temperature controller, a thermocouple and a relay. It controls the temperature and maintains a constant temperature. The drying process goes as: 1) Place the heating panel on the top of the sample and put the thermocouple atop the sample to detect temperature. 2) Switch on the power and adjust the temperature controller to keep the temperature at 60°C; 3) Heat up the sample for 24h at 60°C; 4) Turn off the power and remove the heating panel.
(a) Front view
(b) Top view
Figure 2. Test device
The dry-wet cycle test is conducted by heating up the sample with the heating panel, and maintaining the water supply and drainage through the top-down borehole. Tap water is used in the experiment at a constant flow of 82.8kg/h. The purpose of the lab test is to examine how temperature influences rock fragmentation during dry-wet cycles. During the five treatments, the temperature is kept constant at 60°C, 90°C, 105°C, 120°C and 180°C, respectively. The treatment at each temperature contains three dry-wet cycles.
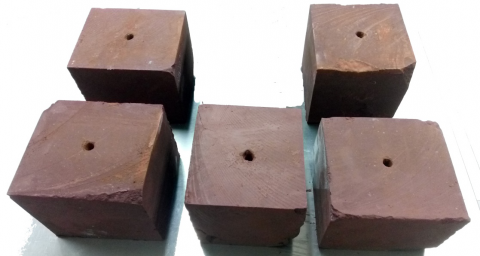
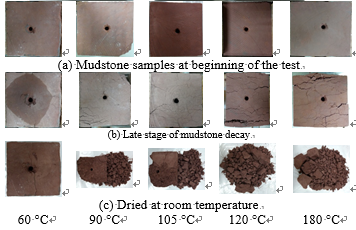
Figure 3. Photographs illustrating the stages of the rock sample decay process
In the first treatment, each cycle lasts 32h, involving the following steps: heating for 24h at 60°C→water exposure for 8h→heating for 24h at 60°C→water exposure for 8h. The procedure is repeated for another sample. After the first treatment, the heating temperature is adjusted to 90°C, 105°C, 120°C and 180°C, respectively. Figure 3 illustrates different phases of the rock fragmentation process.
2.2 Sieving test
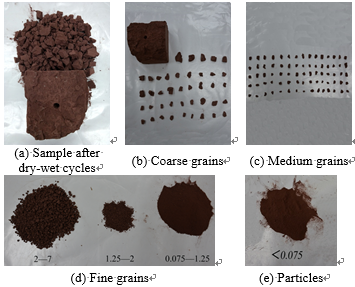
After the dry-wet cycles test, the samples are air-dried at room temperature. The sample fragments are then sieved by 8 sieves, which are 70, 50, 35, 15, 7, 2, 1.25 and 0.075mm, respectively, in diameter. The grains are divided into 4 categories: coarse grains ( $d \geq 15 m m$ ), medium grains ( $7 m m \leq d<15 m m$ ), fine grains ( $0.075 m m \leq d<7 m m$ ) and particles ( $d<0.075 \mathrm{mm}$ ). Figure 4 lists the particle size fraction before and after the sieving at 90°C. The measuring methods are described below:
(1) Coarse grains ( $d \geq 35 \mathrm{mm}$ ): Measure the length, width and height of each fragment with vernier caliper, and record the mass of each fragment. In order to minimize the error, the average value position should be selected as much as possible.
(2) Coarse grains ( $15 m m \leq d<35 m m$ ): Count the total number of fragments and record the gross mass.
(3) Medium grains ( $7 m m \leq d<15 m m$ ) and fine grains ( $2 m m \leq d<7 m m$ ): Calculate the total number by the sampling method (sample mass: gross mass = sample number: total mass) and record the gross mass of each particle size range.
(4) Fine grains ( $1.25 \mathrm{mm} \leq d<2 \mathrm{mm}$ , $0.075 m m \leq d<1.25 m m$ ) and particles ( $d<0.075 \mathrm{mm}$ ): Record the gross mass of each particle size range.
Figure 4. Particle size fraction before and after sieving at 90°C
3.1 Mass percentage of each particle size fraction
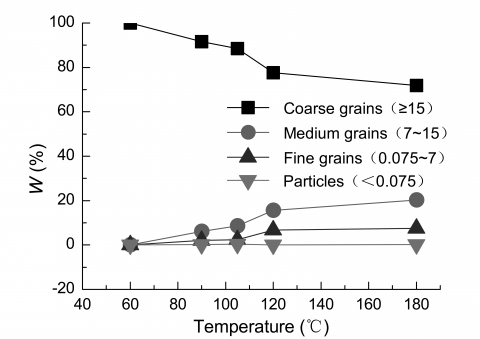
Figure 5. Variation of mass percent of each particle size fraction with temperature
The gross mass and the mass percentage of each particle size fraction are calculated in this research. According to the relationship between temperature and mass percent of each particle size fraction in Figure 5, the author draws the following conclusions:
(1) At the heating temperature of 60°C, the sample remains intact after three dry-wet cycles. In this case, the mass percentage of coarse grains is 100%, while that of medium grains, fine grains and particles are all 0%. Even so, there are cracks on the surface of the sample, indicating that cracks have emerged and expanded inside the sample. The sample might rupture and no longer hold together with more dry-wet cycles.
(2) The mass percentage of coarse grains, medium grains, fine grains and particles falls in the range of 71.93% ~ 100%, 0% ~ 20.33%, 0% ~ 7.51% and 0% ~ 0.38%, respectively. This means coarse grains account for the most amount of weight, while particles account for the least.
(3) With the changing heating temperature, the mass percentage of coarse, medium and fine grains varies regularly. Specifically, the mass percentage of coarse grains decreases but that of medium and fine grains increases as temperature rises. As for particles, which account for a small portion of mass, the mass percentage fluctuates with the temperature, showing unobvious regularity. The results show that higher temperature causes higher fragmentation and more medium and fine grains.
3.2 Number of fragments of each particle size fraction
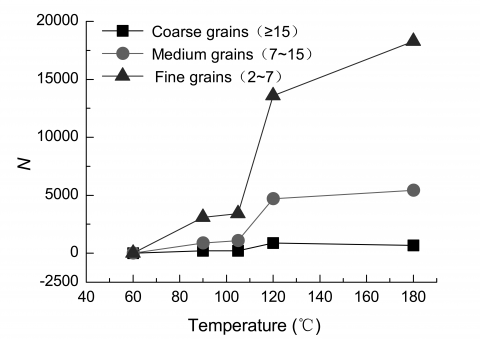
The number of fragments of coarse, medium and fine grains (2mm£d<7mm) are counted in this research. Figure 6 displays how the number of fragments of each particle size fraction varies with temperature. The findings are as follows:
(1) The number of coarse grains (d³15mm), medium grains (7mm£d<15mm) and fine grains (2mm£d<7mm) falls in the range of 1 ~ 884, 0 ~ 5414 and 0 ~ 18269, respectively.
(2) The number of coarse, medium and fine grains changes regularly with the heating temperature. The number of medium and fine grains grows, while that of coarse grains increases firstly and then decreases with the rise of heating temperature. From 60°C to 120°C, the number of coarse grains increases continuously and the number of coarse grains at 120°C is more than 3 times than that at 105°C, indicating that the fragmentation becomes more obvious after the temperature surpasses 120°C. However, the number of coarse grains falls back at 180°C, down by 202 from that at 120°C, while the number of medium and fine grains is higher at 180°C. Therefore, the fragmentation degree is positively correlated with the temperature.
Figure 6. Variation of the number of fragments of each particle size fraction with temperature
3.3 Specific surface area
During quasi-static failure, energy dissipation mainly occurs in the form of the generation of new fracture surface in rock masses. Hence, the energy dissipation can be measured by the total surface area of fragments [30]. By definition, the specific surface area of the sample refers to the ratio of the total surface area to the gross mass of fragments. Below is the calculation method of the surface area of each particle size fraction [31]:
(1) Surface area of coarse grains (d³35mm)
The mass and size of each fragment of coarse grains (d³35mm) are measured as follows. If the mass, length, width, thickness and material density of a fragment are denoted as m, l, h, w and ρ, respectively, then the real volume Vt and the envelope volume Vc of the fragment should be defined as
The real volume stands for the volume of equivalent sphere and the envelope volume as the volume of equivalent cube. Thus, the equivalent particle size req and equivalent side length Leq of the fragment are obtained:
$\left\{\begin{array}{l}{V_{t}=\frac{m}{\rho}} \\ {V_{c}=\ln w}\end{array}\right.$ (1)
The surface area of the fragment equals that of its equivalent sphere:
$\left\{\begin{array}{l}{r_{e q}=\left(\frac{3 V_{t}}{4 \pi}\right)^{1 / 3}} \\ {L_{e q}=\left(V_{c}\right)^{1 / 3}}\end{array}\right.$ (2)
$S=4 \pi r_{e q}^{2}$ (3)
The surface area of each fragment is calculated according to Eq (3). Add up all the surface areas to get the total surface area of all coarse grains (d³35mm).
(2) Surface area of coarse grains (15mm£d<35mm), medium grains (7mm£d<15mm) and fine grains (2mm£d<7mm)
The gross mass and the total number of grains of each particle size range are measured and denoted as M and n, respectively. Assuming that grains within each particle size range are composed of spheres with a radius r, the volume Vi and mass mi of each sphere are:
$V_{i}=\frac{4}{3} \pi r^{3}, m_{i}=\rho V_{i}$ (4)
The gross mass of a particle size range is
$M=n m_{i}=\frac{4}{3} \pi n \rho r^{3}$ (5)
The radius of the equivalent uniform distribution sphere is
$r=\left(\frac{3 M}{4 \pi n \rho}\right)^{1 / 3}$ (6)
The total surface area of the particle size fraction is
$S=4 \pi r^{2} n=\left(\frac{36 \pi n M^{2}}{\rho^{2}}\right)^{1 / 3}$ (7)
(3) Surface area of fine grains (0.075mm£d<2mm) and particles (d<0.075mm)
The particle size range of such grains covers 1.25mm£d<2mm, 0.075mm£d<1.25mm and d<0.075mm. Only the gross mass M is measured, and the number of grains is not counted. Suppose the minimum and maximum diameters are respectively d1 and d2 for particles of a particle size range, and particles in the size range are composed of spheres with a diameter of d=(d1+d2)/2.
The volume and mass of each sphere are:
$\left\{\begin{array}{l}{V_{i}=\frac{\pi}{6} d^{3}} \\ {m_{i}=\rho V_{i}}\end{array}\right.$ (8)
The gross mass of the particle size fraction is
$M=n m_{i}=\frac{\pi}{6} n \rho d^{3}$ (9)
The total number of spheres can be calculated as
$n=6 \frac{M}{n \rho d^{3}}$ (10)
The total surface area of the particle size fraction is
$S=n \pi d^{2}=6 \frac{M}{\rho d}$ (11)
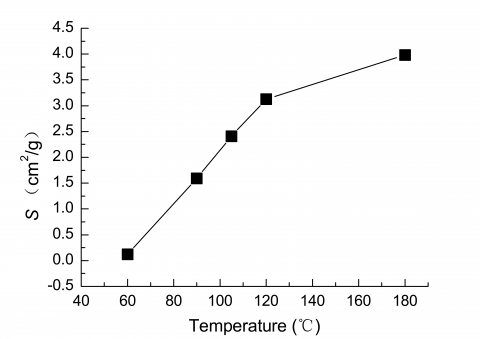
The results of surface area are summarized in Table 1. The temperature-induced changes of specific surface area of each particle size fraction are shown in Figure 7. It can be seen that:
(1) The specific surface area of samples falls in the range of 0.12~3.98cm2/g under dry-wet cycles at various temperatures.
(2) The specific surface area of the samples increases with the temperature. The growth rate is high between 60°C and 120°C but slows down from 120°C to 180°C. The results show that a sample would break down completely at a certain temperature if the dimension and mass remain constant, and its specific surface area tends to a certain value.
Table 1. Surface area of each particle size fraction
|
T/°C |
Surface area of each particle size fraction /cm2 |
Specific surface area/cm2/g |
|||||
|
≥15 |
7~15 |
2~7 |
1.25~2 |
0.075~1.25 |
<0.075 |
||
|
60 |
1679 |
0 |
0 |
0 |
0 |
0 |
0.12 |
|
90 |
3737 |
2472 |
1305 |
211 |
4573 |
9795 |
1.59 |
|
105 |
3497 |
3354 |
1430 |
298 |
5461 |
19517 |
2.41 |
|
120 |
11795 |
8443 |
4428 |
675 |
18240 |
5050 |
3.13 |
|
180 |
9212 |
10910 |
5706 |
1042 |
18972 |
13341 |
3.98 |
Figure 7. Variation of specific surface area of each particle size fraction with temperature
3.4 Fractal dimension
During the dry-wet cycle test, new cracks keep emerging, developing and propagating inside the samples under the effect of temperature and fluid, leading to macro-level fractures and the loss of integrity. This is essentially an energy dissipation process featuring fractal properties, in which micro-scale damages are accumulated into macro-level fragmentation. Good statistical self-similarity is displayed in the geometrical features (e.g. crack density and microstructure fracture mode) of the structural development and the numerical characteristics of the evolution of mechanical or physical quantities [9]. The fractal dimension of fragments is demonstrated by the relationship between the scale and the frequency distribution or the relationship between the scale and the mass distribution. Considering the ease of operation, the author decides to calculate the fractal dimension based on the relationship between the scale and the mass distribution.
The relationship between the scale and the mass distribution is [9]:
$\frac{M}{M_{t}}=\left(\frac{L_{e q}}{a}\right)^{\alpha}$ (12)
where M is the cumulative mass of the equivalent side length shorter than Leq; Mt is the gross mass; $a$ is the average size of fragments; $\alpha$ is the exponent.
Take logarithm of Eq (12) to establish the formula of the exponent $\alpha$ :
$\lg \frac{M}{M_{t}}=\alpha \lg L_{e q}-\alpha \lg a$ (13)
where $\alpha$ is the slope of the straightline of lg(M/Mt)-lgLeq. The relationship between the fractal dimension D and the exponent $\alpha$ is (Xie 1997) [9]:
$D=3-\alpha$ (14)
Table 2 presents the mass in the range of the equivalent side length Leq, the cumulative mass M’ of the equivalent side length shorter than Leq, lgLeq and lg(M/Mt) at 90°C.
Table 2. Equivalent side length and cumulative mass of particles at 90°C
|
$\Delta L_{e q}$ /mm |
M/g |
$L_{e q}$ /mm |
M'/g |
$\lg L_{e q}$ |
$\lg \left(M / M_{t}\right)$ |
|
|
<0.075 |
26.57 |
0.08 |
26.57 |
-1.12 |
-2.67 |
|
|
0.075~1.25 |
109.59 |
1.25 |
136.16 |
0.10 |
-1.96 |
|
|
1.25~2 |
12.40 |
2.00 |
148.56 |
0.30 |
-1.92 |
|
|
2~7 |
172.68 |
7.00 |
321.24 |
0.85 |
-1.59 |
|
|
7~15 |
849.57 |
15.00 |
1170.81 |
1.18 |
-1.03 |
|
|
15~35 |
148.82 |
35.00 |
1319.63 |
1.54 |
-0.98 |
|
|
35~50 |
0.00 |
50.00 |
1319.63 |
1.70 |
-0.98 |
|
|
50~70 |
0.00 |
70.00 |
1319.63 |
1.85 |
-0.98 |
|
|
50~140 |
0.00 |
140.00 |
1319.63 |
2.15 |
-0.98 |
|
|
140~280 |
11150.00 |
280.00 |
12469.63 |
2.45 |
0.00 |
|
Figure 8. Variation of fractal dimension with temperature
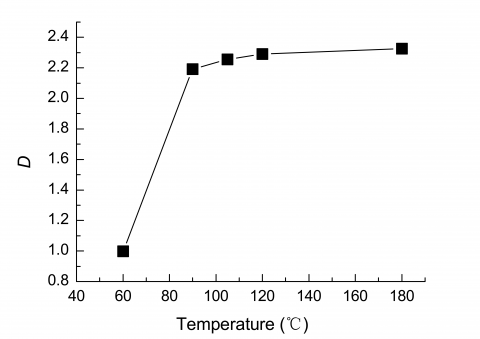
The following can be inferred from the variation of fractal dimension with temperature in Figure 8:
(1) The fractal dimension of samples falls in the range of 1.00~2.33.
(2) The fractal dimension increases with the increase of temperature. At the heating temperature of 60°C, the sample remains intact and the fractal dimension reaches the minimum. From 60°C to 90°C, the fractal dimension increases rapidly, but the growth rate slows down after 90°C. Thus, the fragmentation degree increases with the increase of temperature; when the heating temperature surpasses a certain level, however, the fractal dimension of the sample may reach a stable state.
Since the difference in mudstone fragmentation is mainly attributed to mineral composition and pore-fracture structure, the shape and size of samples may vary with mineral composition and pore-fracture structure in spite of the constant temperature [32-33] and the same number of dry-wet cycles. For the same type of mudstone, however, the fragmentation degree grows as the temperature rises, bringing about more fragments, larger specific surface area and greater fractal dimension. The high temperature environment is conducive to mudstone fragmentation and the dry-wet cycles act as the driving engine of the rapid disintegration of mudstone. The effect of temperature should not be ignored in the analysis of rock fragmentation during dry-wet cycles. The temperature has a three-fold effect on rock decay: 1) Changing temperature will cause stronger thermal stress in rocks, which in turn produces tensile stress, compressive stress or shear stress. Under these stresses, cracks and cleavage planes may develop along grain boundaries. When the resultant stress exceeds the tensile strength of samples, internal cracks will appear, creating channels for water seepage. 2) With higher temperature and more frequent dry-wet cycles, the moisture will be evaporated and absorbed by rock masses, resulting in strong swelling-shrinking phenomenon. As the water evaporates, the mudstone shrinks and develops tensile cracks. The resulting gaps of evaporation are filled up by air. When water is reabsorbed, the air is trapped and compressed in capillary openings, contributing to even more tensile stresses and rock deterioration [34]. In this research, the samples contain water-absorbing and pressure-generating swelling minerals. This explains why so many cracks are formed in the samples under the effect of temperature during dry-wet cycles and how the rise in temperature leads to stronger swelling and shrinking, and the ultimate deterioration of mudstone. 3) The expansion coefficient of mineral grains differs with temperature and temperature gradient. Apart from clay minerals, mudstone also contains non-clay minerals like quartz and feidspar, which are cemented by clay minerals. Rocks containing different minerals feature different thermal and mechanical properties. For instance, the volume expansion coefficient is quite low for feidspar and high for quartz [35]. Due to the different heat conduction [36-38] and thermal expansion anisotropy [39] between mineral grains, thermal stress will concentrate in local areas between mineral particles. Consequently, the internal structure of the particles will be changed, new cracks will appear along the grain boundary or within particles, and the cement and the grains will eventually split apart.
To a certain extent, the dry-wet test simulates many of the natural disasters induced by abrupt environmental changes, namely heavy rain and high temperature. These changes often accelerate the failure process of landslides and surface collapses. According to Zhang et al. [40-41], the temperature difference has a great impact on rock decay, and the threshold of fatigue efficiency varies with rock type. The temperature difference in dry-wet cycles is the result of moisture variation [42]. Once it is in contact with water, the mudstone will be weakened with water seeping through the cracks [43-46]. The higher the heating temperature, the faster the water absorption, and the faster the mudstone ruptures and disintegrates.
This paper designs a customized test device consisting of a model test container, a thermostat-controlled heating plate and a water supply and drainage unit for the experiment, carries out the sieving test on air-dry fragments to analyze the effect of different temperatures on the fragmentation characteristics of mudstone during dry-wet cycles, and performs a systematic study on how temperature variation affects the mass fraction, the number of fragments, the specific surface area and the fractal dimension. The results show that the temperature has a significant effect on the above distribution parameters of rock masses under dry-wet cycles.
Specifically, the mass percentage of coarse grains decreases but that of medium and fine grains increases as temperature rises, indicating that higher temperature causes higher fragmentation and more medium and fine grains; the number of medium and fine grains grows, while that of coarse grains increases firstly and then decreases with the rise of heating temperature, and the fragmentation becomes more obvious after the temperature reaches 120°C; the specific surface area and the fractal dimension of the samples increase with the temperature. However, the fast growth rate slows down after the temperature surpasses 120°C, indicating that a sample would break down completely at a certain temperature if the dimension and mass remain constant, and its specific surface area tends to a certain value.
The difference in mudstone fragmentation is mainly attributed to mineral composition and pore-fracture structure. The high temperature environment is conducive to mudstone fragmentation and the dry-wet cycles act as the driving engine of the rapid disintegration of mudstone. For the same type of mudstone, however, the fragmentation degree grows as the temperature rises, bringing about more fragments, larger specific surface area and greater fractal dimension.
The authors gratefully acknowledge the financial support from the Chongqing Research Program of Basic Research and Frontier Technology (No. cstc2015jcyjBX0073), the Chongqing Research Program of Basic Research and Frontier Technology (No. cstc2015jcyjA30007) and the science and technology project of Land Resources and Real Estate Management Bureau of Chongqing Government (No. CQGT-KJ-2014052).
[1] Krumbein W.C., Sloss L.L. (1963). Stratigraphy and Sedimentation (2nd. Edition), W.H. Freeman and Co., San Francisco, p. 269.
[2] Anwar H.Z., Shimada H., Ichinose M., Matsui D. (1999). Slake durability behaviour of coal mine shales, Proceedings of 1999 International Symposium on Mining Science and Technology, Beijing, pp. 343-346.
[3] Regüés D., Pardini G., Gallart F. (1995). Regolith behaviour and physical weathering of clayey mud rock as dependent on seasonal weather conditions in a badland area at Vallcebre, Eastern Pyrenees, Catena, Vol. 25, No. 1-4, pp. 199-212. DOI: 10.1016/0341-8162(95)00010-P
[4] Wang G.J., Yang S., Kong X.Y., Tang Y.J. (2016). Study on the process and mechanism of indoor overtopping dam-failure of tailings dam model experiment under the rainfall, Modelling, Measurement and Control C, Vol. 77, No. 1, pp. 86-97.
[5] Cantón Y., Solé-Benet A., Queralt I., Pini R. (2001). Weathering of a gypsum-calcareous mudstone under semi-arid environment at Tabernas, SE Spain: laboratory and field-based experimental approaches, Catena, Vol. 44, No. 2, pp. 111-132. DOI: 10.1016/S0341-8162(00)00153-3
[6] Erguler Z.A., Shakoor A. (2009). Relative contribution of various climatic processes in disintegration of clay-bearing rocks, Engineering Geology, Vol. 108, No. 1-2, pp. 36-42. DOI: 10.1016/j.enggeo.2009.06.002
[7] Yang J.L., Wang L.G., Li X.L., Zhao G. (2014). Research on micro-fracture mechanism of mudstone after wet-dry cycles, Chinese Journal of Rock Mechanics and Engineering, Vol. 33, No. A02, pp. 3606-3612 (in Chinese).
[8] Hirata T. (1989). Fractal dimension of fault systems in Japan: fractal structure in rock fracture geometry at various scales, Pure and Applied Geophysics, Vol. 131, No. 1-2, pp. 157-170. DOI: 10.1007/BF00874485
[9] Xie H.P. (1997). Introduction to fractal in rock mechanics, Science Press, Beijing, p. 240.
[10] Perfect E. (1997). Fractal models for the fragmentation of rocks and soils: a review, Engineering Geology, Vol. 48, No. 3-4, pp. 185-198. DOI: 10.1016/S0013-7952(97)00040-9
[11] Xie H., Gao F., Zhou H. (2003). Fractal fracture and fragmentation in rocks, Journal of Seismology, Vol. 23, No. 4, pp. 1-9.
[12] Bagde M.N., Raina A.K., Chakraborty A.K., Jethwa J.L. (2002). Rock mass characterization by fractal dimension, Engineering Geology, Vol. 63, No. 1-2, pp. 141-155. DOI: 10.1016/S0013-7952(01)00078-3
[13] Pourghasemi H.R., Moradi H.R., Aghda S.M.F., Sezer E.A., Jirandeh A.G., Pradhan B. (2014). Assessment of fractal dimension and geometrical characteristics of the landslides identified in North of Tehran, Iran, Environmental Earth Sciences, Vol. 71, No. 8, pp. 3617-3626. DOI: 10.1007/s12665-013-2753-9
[14] Wang Y., Shao C., Xu Y. (2016). Fractal crushing of solid particles, KSCE Journal of Civil Engineering, Vol. 21, No.3, pp. 987-993. DOI: 10.1007/s12205-016-0508-3
[15] Hecht C.A. (2000). Appolonian packing and fractal shape of grains improving geomechanical properties in engineering geology, Pure and Applied Geophysics, Vol. 157, No. 4, pp. 487-504. DOI: 10.1007/PL00001103
[16] Carpinteri A., Lacidogna G., Pugno N. (2004). Scaling of energy dissipation in crushing and fragmentation: a fractal and statistical analysis based on particle size distribution, International Journal of Fracture, Vol. 129, No. 2, pp. 131-139. DOI: 10.1023/B:FRAC.0000045713.22994.f2
[17] Chen X., Zhou J. (2013). Volume-based soil particle fractal relation with soil erodibility in a small watershed of purple soil, Environmental Earth Sciences, Vol. 70, No. 4, pp. 1735-1746. DOI: 10.1007/s12665-013-2261-y
[18] Hou T.X., Xu Q., Zhou J.W. (2015). Size distribution, morphology and fractal characteristics of brittle rock fragmentations by the impact loading effect, Acta Mechanica, Vol. 226, No. 11, pp. 3623-3637. DOI: 10.1007/s00707-015-1409-0
[19] Wang C., Zhang N., Han Y., Xiong Z., Qian D. (2015). Experiment research on overburden mining-induced fracture evolution and its fractal characteristics in ascending mining, Arabian Journal of Geosciences, Vol. 8, No. 1, pp. 13-21. DOI: 10.1007/s12517-013-1178-9
[20] Ma G., Zhou W., Regueiro R.A., Wang Q., Chang X.L. (2016). Modeling the fragmentation of rock grains using computed tomography and combined FDEM, Powder Technology, Vol. 308, pp. 388-397. DOI: 10.1016/j.powtec.2016.11.046
[21] Erguler Z.A., Shakoor A. (2009). Relative contribution of various climatic processes in disintegration of clay-bearing rocks, Engineering Geology, Vol. 108, No. 1-2, pp. 36-42. DOI: 10.1016/j.enggeo.2009.06.002
[22] Imumorin P., Azam S. (2011). Effect of precipitation on the geological development of badlands in arid regions, Bulletin of Engineering Geology and the Environment, Vol. 70, No. 2, pp. 223-229. DOI: 10.1007/s10064-010-0300-4
[23] Doostmohammadi R., Moosavi M., Mutschler T.H., Osan C. (2009). Influence of cyclic wetting and drying on swelling behavior of mudstone in south west of Iran, Environmental Geology, Vol. 58, No. 5, pp. 999-1009. DOI: 10.1007/s00254-008-1579-3
[24] Zhang X.P., Sun J.W., Sun Z.C. (2016). Seismic liquefaction study of sandy soil and its application research, Modelling, Measurement and Control C, Vol. 77, No.1, pp. 65-85.
[25] Yang G.S., Pu Y.B., Ma W. (2002). Discussion on the damage propagation for rock under the frost and thaw condition of frigid zone, Journal of Experimental Mechanics, Vol. 17, No. 2, pp. 220-226 (in Chinese).
[26] Hall K. (2004). Evidence for freeze–thaw events and their implications for rock weathering in northern Canada, Earth Surface Processes and Landforms, Vol. 29, No. 1, pp. 43-57. DOI: 10.1002/esp.1012
[27] Li W.B., Wu Y.M., Fu H.L., Zhang J.B. (2015). Long-term continuous in-situ monitoring of tunnel lining surface temperature in cold region and its application, International Journal of Heat and Technology, Vol. 33, No. 2, pp. 39-44. DOI: 10.18280/ijht.330206
[28] Hale P.A. (2003). A laboratory investigation of the effects of cyclic heating and cooling, wetting and drying, and freezing and thawing on the compressive strength of selected sandstones, Environmental & Engineering Geoscience, Vol. 9, No. 2, pp. 117-130. DOI: 10.2113/9.2.117
[29] Chen J., Zheng Y., Yan J., Yan L. (2015). Influence on the navigation channel in Chongqing reach of the three gorges reservoir caused by reservoirs built upstream, International Journal of Heat and Technology, Vol. 33, No. 2, pp. 9-16. DOI: 10.18280/ijht.330202
[30] Carpinteri A., Pugno N. (2002). A fractal comminution approach to evaluate the drilling energy dissipation, International Journal for Numerical and Analytical Methods in Geomechanics, Vol. 26, No. 5, pp. 499-513. DOI: 10.1002/nag.209
[31] Chen X., Wang S.Z., Li L. (2012). Characteristics of fragments of jointed rock mass model under uniaxial compression, Chinese Journal of Rock Mechanics and Engineering, Vol. 31, No. 5, pp. 898-907 (in Chinese).
[32] Carotenuto A., De Luca G., Fabozzi S., Figaj R.D., Iorio M., Massarotti N., Vanoli L. (2016). Energy analysis of a small geothermal district heating system in southern Italy, International Journal of Heat and Technology, Vol. 34, Special Issue 2, pp. S519-S527. DOI: 10.18280/ijht.34Sp0246
[33] Liuzzi S., Stefanizzi P. (2016). Experimental study on hygrothermal performances of indoor covering materials, International Journal of Heat and Technology, Vol. 34, Special Issue 2, pp. S365-S370. DOI: 10.18280/ijht.34Sp0225
[34] Holland C.T. (1956). Mineral content, a factor in weathering of mine roof, Mining Congress Journal, pp. 49-54.
[35] Weiss T., Siegesmund S., Kirchner D., Sippel J. (2004). Insolation weathering and hygric dilatation: two competitive factors in stone degradation, Environmental Geology, Vol. 46, No. 3-4, pp. 402-413. DOI: 10.1007/s00254-004-1041-0
[36] Mukhopadhyay N. (2016). Heat conduction model development of a cold storage using EPS insulation, Modelling, Measurement and Control B, Vol. 85, No. 1, pp. 18-27.
[37] Nayak M.K. (2016). Steady MHD flow and heat transfer on a stretched vertical permeable surface in presence of heat generation/absorption, thermal radiation and chemical reaction, Modelling, Measurement and Control B, Vol. 85, No. 1, pp. 91-104.
[38] Sorokin V.G., Vyazmin A., Zhurov A.I., Reznik V., Polyanin A.D., (2017), The heat and mass transfer modeling with time delay, Chemical Engineering Transactions, Vol.57, pp. 1465-1470. DOI: 10.3303/CET1757245
[39] Fu C., Uv P.M., Nygreen B., Gundersen T. (2017). Compression and Expansion at the Right Pinch Temperature, Chemical Engineering Transactions, Vol. 56, pp. 1939-1944. DOI: 10.3303/CET1756324
[40] Zhang D., Chen A.Q., Xiong D.H., Liu G.C. (2013). Effect of moisture and temperature conditions on the decay rate of a purple mudstone in southwestern China, Geomorphology, Vol. 182, pp. 125-132. DOI: 10.1016/j.geomorph.2012.11.003
[41] Zhang D., Chen A., Wang X., Liu G. (2015). Quantitative determination of the effect of temperature on mudstone decay during wet-dry cycles: a case study of ‘purple mudstone’ from south-western China, Geomorphology, Vol. 246, pp. 1-6. DOI: 10.1016/j.geomorph.2015.06.011
[42] Phienwej N. (1987). Ground Response and Support Performance in a Sheared Shale, Stillwater Tunnel, Dissertation, University of Illinois, pp 59-62.
[43] Eeckhout E.M.V. (1976). The mechanisms of strength reduction due to moisture in coal mine shales, International Journal of Rock Mechanics and Mining Sciences & Geomechanics Abstracts, Vol. 13, No. 2, pp. 61-67. DOI: 10.1016/0148-9062(76)90705-1
[44] Silva M.R.D., Schroeder C., Verbrugge J.C. (2008). Unsaturated rock mechanics applied to a low-porosity shale, Engineering Geology, Vol. 97, No. 1, pp. 42-52.
[45] Erguler Z.A., Ulusay R. (2009). Water-induced variations in mechanical properties of clay-bearing rocks, International Journal of Rock Mechanics & Mining Sciences, Vol. 46, No. 2, pp. 355-370. DOI: 10.1016/j.ijrmms.2008.07.002
[46] Liu W.P., Luo X.Y. (2016). Elastoplastic analysis of circular tunnel using nonlinear improvement of unified strength theory, Modelling, Measurement and Control B, Vol. 85, No. 1, pp. 163-174.