OPEN ACCESS
The environmental impact of road transport is significant because it is a major user of energy and the major user of the world's petroleum that is extracted every year. This creates air pollution, including nitrous oxides and particulates, and is a significant contributor to global warming through emission of carbon dioxide, for which transport is the fastest-growing emission sector. These impacts assume a particular importance if considered the place where they are emitted such as the cities and highways that develop near the human settlements. By subsector, road transport can globally be considered the largest contributor to global warming. This paper takes into account an effective design methodology, which is based on an effective energy optimization of the vehicle and its main components. This method takes inspiration from constructal law, even if it could not be limited to this. The inspiration is limited to considering the fluxes of different physical magnitudes inside a complex system, such as a vehicle is, and analyzing how they develop and how they develop and mix. This analysis leads to a general analysis to the vehicle and to an effective optimization based on energy principle by a step by step optimization that allows identifying the critical elements that limit the flow of the different magnitudes inside the system, with particular attention to the factor that limits energy efficiency at different scale levels. The components have been considered only if they are industrial grade and inside a modular design, which allows merging design, finalized to energy efficiency, minimization of exergy disruption and of LCA impacts. The emotion that has been caused by the end of the production of the most successful British vehicle that is Land Rover Defender has stimulated to produce a sample design of a vehicle in this class producing different alternatives for different uses. The case of a vehicle that can compete with Discovery in terms of use and specifications has been considered, Results have been surprising demonstrating that the use of industrial grade components and their accurate choice will allow defining new vehicle platforms that can radically improve energy efficiency of vehicles.
Vehicle, Hibrid, Energy, Optimization, Efficiency, Sustainability, Design, Land Rover, Defender.
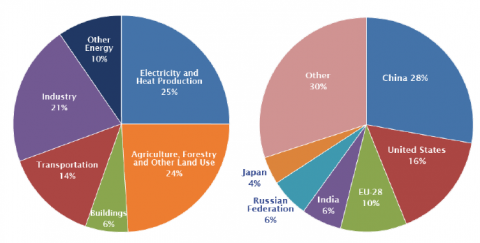
IEA [1] clearly recognizes that transport sector is the one with the highest final energy consumption and, without any significant policy changes. Fig.1 clearly shows that transport is not the main global contributor to GHG emissions but it has a very important contribution.
In 2008, the IEA [2] published 25 energy efficiency recommendations for different sectors. Four of them regard directly the transport sector and include improving tyre energy efficiency, fuel economy standards for both light-duty vehicles (LDVs) and heavy-duty vehicles (HDVs), and eco-driving. The IEA report “Implementing Energy Efficiency Policies: Are IEA member countries on track?” [3] describes the level of implementation of the energy efficiency recommendations by IEA countries. In particular, IEA recommendations about transport are the following:
Recommendation 5.1. Tyres - US has adopted tyre pressure monitoring systems (TPMS) on all passenger cars, multipurpose vehicles, trucks and buses since 2007. EU integrated tires as part of the EU’s integrated approach to reduce CO2 emissions from light duty vehicles (EU, 2009), including mandatory fitting of TPMS, and requirements for rolling resistance and other essential tyre performances. Japan has introduced a voluntary tyre-labelling scheme based on fuel efficiency and wet grip performance by January 2010.
Recommendation 5.2. Fuel economy standards: light-duty vehicles – US introduced the first fuel economy in cars with the Corporate Average Fuel Economy (CAFE) in 1975. The CAFE update (2009) introduced a function of vehicle size or “footprint” by 2011, with the objective of raising the average fuel economy of the fleet to 35.5mpg1 in 2016, with 30% reduction in fuel consumption compared with 2005.
Figure 1. Global GHG Emissions per sector and per county (source EPA based on IPCC data 2010)
Labelling of vehicle fuel economy and associated costs has also been a requirement in the US for more than 30 years. Canada has recently switched from a voluntary to mandatory fuel economy system and aligned with the United States’ revised CAFE standards. Vehicle CO2 emissions and fuel economy labelling has existed in the EU since 2001 with differences in labelling among member states. In 2009, the EU adopted CO2 emissions regulations for passenger cars (implementation over 2012-15), with an average objective of car fleet emissions around 130 g CO2/km by 2015. They were 161 g CO2/km in 2005. Further reduction is expected through tyre efficiency, gearshift indicators, air conditioners and low carbon fuels. In Japan, the Top Runner programme sets standards in energy efficiency across a wide range of equipment, including passenger cars. These standards are based on the “best in class” technology and are a function of vehicle weight. Positive labelling is used in Japan where vehicles are rated by how much they exceed their target.
Recommendation 5.3. Fuel economy: Heavy-duty vehicles - Japan introduced fuel economy standards for heavy-duty vehicles in 2006. They are similar to that for passenger cars in Japan and are based on vehicle weight, in this case gross vehicle weight, and the best in class principle of the “Top Runner” programme. Fuel economy levels are mandated to improve 12% from 2002 to 2015. The problem of emissions’ testing has been solved by measuring engine emissions in the laboratory and simulating full vehicle emissions electronically. The EU is has adopted in 2014 methods and standards for CO2 emissions from HDVs based on simulations. In April 2009 in the US, the EPA initiated rule-making procedures on greenhouse gas (GHG) emissions from HDV. The implementation of fuel economy standards for HDVs is difficult because of the wide range of chassis/engine variations, but the Combined fuel economy standard (34.1mpg) and new EPA standards for air conditioners = 35.5mpg (equivalent to 156 grams CO2/km).
Recommendation 5.4. Eco-driving - Eco-driving can reduce fuel consumption and CO2 emissions by up to 20%. Most countries now have programmes of eco-driving, either at national or sub-national level. Programmes can be supported with technical aids such as in-car feedback instruments. EU adopted Gear Shift Indicators (GSI) in all new cars from 2012. Eco-driving is implemented at member state level and countries have different programmes. Japan promotes ecodriving informative campaigns and manufacturers generally offer feedback instruments even though they are not required to do so. In 2009 more than 70% of new cars contained such instruments. In the US, several programmes at state level are supported by the auto industries. Eco-driving is a low cost method of reducing vehicle fuel consumption without the need of vehicle technology improvements. An advantage is that it can be implemented with drivers of both new and old passenger cars, as well as those of all sizes of commercial vehicles.
Automotive fuel economy standards have proven to be one of the most effective tools in controlling oil demand and greenhouse gas (GHG) emissions from the transportation sector in many regions and countries around the world.
While fuel economy standards for light-duty vehicles have been largely stagnant in the US over the past two decades, EU, Japan, and recently China and California have moved forward, establishing or tightening GHG or fuel economy standards. Data between standards appear different and present results that need to be carefully compared and equalled. Identical vehicles have varying fuel consumption figures listed depending upon the testing methods of the jurisdiction. Lexus IS 250 – petrol 2.5 L 4GR-FSE V6, 153 kW, 6 speeds automatic, rear wheel drive can have the values in Table 1.
Table 1. Comparison between different standards (case of Lexus IS 250 – petrol 2.5 L, 153 kW, 6 speed automatic
|
Fuel economy L/100 km |
COMBINED |
URBAN |
HIGHWAY |
|
Australia |
9.1 |
12.7 |
7.0 |
|
Canada |
9.6 |
11.1 |
7.8 |
|
EU |
8.9 |
12.5 |
6.9 |
|
USA |
9.8 |
11.2 |
8.1 |
Table 1 clearly shows the difference between different standards and the necessity of defining criteria of comparison between different standards [7]. A comparison between different testing conditions is presented in Annex 1.
It must be also observed that averaged values present a larger difference because of US CAFE standards consider a larger domain than any other regulation by coupling in LHV category, both cars and small trucks.
Trancossi [8] has analysed a general energetic model of a vehicle and discussing how the can be used as a design instrument from the preliminary phases of the design. Trancossi [9] has also compared different methods for evaluating the overall Life Cycle Assessment of the impacts of different transport modes. Dewulf and Van Langenhove [10] have defined an innovative exergetic analysis based on an effective analysis of the productivity of the resources. They extend the basic concept of MIPS (Material Input Per Unit of Service) in terms of the second law of thermodynamics. This approach leads to define the concept of EMIPS (Exergetic Material Input per Unit of Service). With respect to transport it takes into account the total mass of the vehicle, the payload to be transported, the total distance, and the speed. This methodology allows on one side an effective evaluation of different transport modes, but also to support an effective design methodology which is based on an effective analysis of vehicle performances.
$E M I P S=\frac{\mathrm{E} \mathrm{x}_{\text { Resources }}}{\mathrm{E} \mathrm{X}_{\text { Service }}}$(1)
The amount of resources extracted from the ecosystem to provide the transport service has quantified defining an inventory of all exergetic resources which are used over a single transport mission but also at whole life cycle level.
This flexibility allows using EMIPS methodology as an integrated design method for an effective energetic and environmental analysis and design, which allows an effective optimization of the system with comparable results. The EMIPS method allows evaluating the cumulative exergy consumption for a specified service with an effective distinction between non-renewable and renewable resource inputs according to Gong and Wall [11]. A model, which can be suitable for design optimization, will be considered and it is much more detailed than the original model by Dewulf. This model will consider two terms one related to the vehicle and one related to the payload. It has been then been possible to understand the energy which is necessary to move the vehicle and the one to move the payload.
Figure 2. Losses in a ground vehicle
With respect to Dewulf the friction with the ground has also been considered. The general expression of the dissipations during service is then
$E x_{\text { Service }}=E_{R o l}+E_{K i n}+E_{D r a g}+E x_{S t a n d l y}$(2)
where:
$E_{K i n}=\frac{1}{2} \cdot M_{t o t} \cdot v_{\max }^{2}$(3)
because the kinetic energy to be acquired depends on the maximum speed vmaxduring the trajectory.
$E_{R o l}=\int_{0}^{t_{d}} \mu \cdot M_{t o t} \cdot g \cdot v \cdot d t$(4)
$E_{D r a g}=\int_{0}^{t_{a}}\left(\frac{1}{2} \cdot C_{D} \cdot \rho_{a i r} \cdot A \cdot v^{3}\right) \cdot d t$(5)
$E x_{\text {Standby}}=\dot{m}_{f, \min } \cdot L H V_{f} \cdot T_{s}$(6)
Rolling and aerodynamic terms depend on the velocity profile. Different speed profiles can be investigated. The most efficient profiles should be without reacceleration in order to avoid loss of kinetic energy. In almost all cases of transport technology, kinetic exergy is completely lost, although in electrically driven cars and trains a fraction can be recovered.
Kinetic and rolling terms can be expressed as the composition of two terms because the mass Mtot is the sum of a mass of the payload Mp and the mass of the vehicle Mv:
$E_{K i n}=\frac{1}{2} \cdot\left(M_{v}+M_{p}\right) \cdot v_{\max }^{2}$(3')
$E_{R o l}=\int_{0}^{t_{d}} \mu \cdot\left(M_{v}+M_{p}\right) \cdot g \cdot v \cdot d t$(4')
These considerations allow defining a specific energy balance for the vehicle and for the payload to be transported.
The service term, which refers to the vehicle, is
$E x_{\text {Service,v}}=E_{\text {Rol}, v}+E_{K i n, v}+E_{\text {Drag}}+E_{\text {Standby}}$(7)
and the service term, which is expressly referred to the payload is
$E x_{\text {Service,p}}=E_{\text {Rol}, p}+E_{K i n, p}$(8)
Some further considerations can be performed about the terms, which are based on speed. In first approximation, the speed v is assumed constant and equal to the average value of speed vav and they become:
$E_{R o l}=\int_{0}^{t_{d}} \mu \cdot m_{t o t} \cdot g \cdot v \cdot d t=\mu \cdot\left(M_{v}+M_{p}\right) \cdot g \cdot v_{a v} \cdot t_{d}$(4")
$E_{D r a g}=\int_{0}^{t_{d}}\left(\frac{1}{2} C_{D} \rho_{a i r} A v^{3}\right) d t=\frac{1}{2} \cdot C_{D} \cdot \rho_{a i r} \cdot A \cdot v_{a v}^{3} t_{d}$(5")
It is possible to express the two service terms as follows:
$E x_{\text {Service,v}}=\frac{1}{2} \cdot M_{v} \cdot v_{\max }^{2}+\mu \cdot M_{v} \cdot g \cdot v_{a v} \cdot t_{d}+$$+\frac{1}{2} \cdot C_{D} \cdot \rho_{a i r} \cdot A \cdot v_{a v}^{3} t_{d}+\dot{m}_{f, \min } \cdot L H V_{f} \cdot T_{s}$
$E x_{\text {Service,p}}=\frac{1}{2} \cdot M_{p} \cdot v_{\mathrm{max}}^{2}+\mu \cdot M_{p} \cdot g \cdot v_{a v} \cdot t_{d}$
During service, the exergy supplied to the system is equal to the one of the necessary fuel.
It is assumed Land Rover Defender as a reference vehicle for the optimization process. The datasheet of the reference data of the car model is reported in Appendix 1.
Final objective is to design a vehicle with the same performances of Land Rover Discovery, and energy consumption reduction in the area of an actual medium class hybrid car. Objectives have been reported into Table 2.
Table 2. Objective of the design activity
|
Fuel consumption |
km/l |
Mpg |
l/100 km |
|
Urban |
14.80 |
41.75 |
6.75 |
|
Extra-urban |
19.90 |
56.30 |
5.00 |
|
Combined |
17.60 |
50.00 |
5.60 |
These objectives can be achieved by mean of different concurrent strategies:
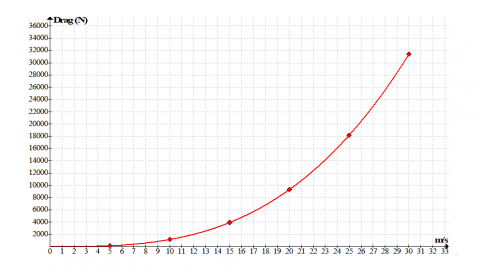
By dimensional analysis front area of a defender can be estimated 3.2 m2. Autobild Magazine [13] has experimentally evaluated drag coefficient by wind gallery testing. For defender it has been obtained CD=0.59 and CD A = 1.9. Aerodynamic Drag effects are presented in Figure 3.
Preliminary calculations have been performed against Sovran and Bohn [14]. The results have been presented in Table 3. They show the full energetic value of the fuel and results in-line with Sovran and Bohn ones. Calculations have been performed by considering the data of a Defender.
Figure 3. Power dissipated by Drag as a function of speed
There are several ways to reduce the sales-weighted average weight during vehicle design stage. Weight reduction can be achieved by a combination of:
1) lightweight material substitution;
2) redesigning the vehicle to minimize weight;
3) downsizing the new vehicle fleet by shifting sales away from larger and heavier vehicles.
First element it is not desired to downsize the system dimensions. It means that the first two ways can be adopted.
For an average vehicle, about three-quarters of its weight are incorporated in its powertrain, chassis, and body, and the bulk of this is made of ferrous metals. Other major materials found in an average automobile include aluminium and plastics or composites. The use of aluminium and high-strength steel (HSS) as a percentage of total vehicle mass has been increasing over the past decades while the use of iron and mild steel has been declining. Aluminium and high-strength steel are two of several alternative lightweight materials that can be used to replace heavier steel and iron in the vehicle. Other material candidates include magnesium, and polymer composites such as glass and carbon-fiber-reinforced thermosets and thermoplastics. The relevant properties of these materials are summarized in Table 4.
With respect to the table of data used by MIT [15] it has been added the ratio between Yield Strength and elastic module which is the most important parameter to evaluate the effects of the substitution of different materials.
Main uses of light weight materials on today cars are:
On a component level, the amount of weight savings resulting from using alternative materials in any vehicle component depends on the application and design intent. For instance, for a body panel designed for strength and resistance to plastic deformation, 1 kg of aluminium can replace 3–4 kg of steel. For a structural component designed for stiffness in order to restrict deflection, 1 kg of aluminium replaces only 2 kg of steel. On a vehicle-level, with aggressive use of lightweight materials, net weight savings of 20–45% can be obtained, as has been demonstrated in a few concept vehicles. Massive use of aluminium in structural elements parts
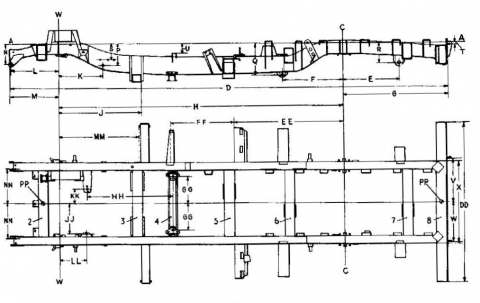
6.1 Chassis redesign
Redesigning the chassis to take advantage of aluminium will give a reduction of structural weights about 40%. It means that the actual chassis could pass from actual 155 kg to an expected value of around 80 kg.
Figure 4. Land Rover Defender 110 Chassis (from user manual)
Table 3. Evaluated energy consumption according to Sovran and Bohn method by data from Appendix 1
|
|
% |
Declared Data |
Evaluated data |
|||||||
|
City |
H way |
Comp |
City |
H way |
Comp |
City |
H way |
Comp |
||
|
(%) |
(%) |
(%) |
MJ/100km |
MJ/100km |
MJ/100km |
MJ/100km |
MJ/100km |
MJ/100km |
||
|
|
Fuel Tank |
100 |
100 |
100 |
414.42 |
308.25 |
345.92 |
538.75 |
400.72 |
449.70 |
|
Engine |
Engine |
69.5 |
65 |
67.25 |
288.02 |
269.37 |
278.70 |
374.43 |
350.19 |
362.31 |
|
|
Standby |
5.5 |
0.75 |
3.15 |
22.79 |
3.11 |
13.05 |
29.63 |
4.04 |
16.97 |
|
|
Output |
25 |
34.75 |
29.9 |
103.61 |
144.01 |
123.91 |
134.69 |
187.21 |
161.09 |
|
Power train |
Driveline |
6 |
5 |
5.5 |
24.87 |
20.72 |
22.79 |
32.32 |
26.94 |
29.63 |
|
|
Output |
19 |
29.75 |
24.4 |
78.74 |
123.29 |
101.12 |
102.36 |
160.28 |
131.45 |
|
Operations |
Rolling |
4.4 |
10.05 |
7 |
18.23 |
41.65 |
29.01 |
23.70 |
54.14 |
37.71 |
|
|
Drag |
3.65 |
15.8 |
8.9 |
15.13 |
65.48 |
36.88 |
19.66 |
85.12 |
47.95 |
|
|
Kinetic |
9.85 |
3.15 |
7.5 |
40.82 |
13.05 |
31.08 |
53.07 |
16.97 |
40.41 |
Table 4. Comparison between materials according to [15 and 16]
|
Material |
Density, [g/cm3] (relative) |
Yield strength, [MPa] |
Tensile strength, [MPa] |
Elastic modulus, [GPa] |
Yield strength / density [kN m/kg] |
Relative cost per part[16] |
|
Mild steel |
7.86 (1.00) |
200 |
300 |
200 |
25.45 |
1.0 |
|
High strength steel (A606) |
7.87 (1.00) |
345 |
483 |
205 |
26.05 |
1.0-1.5 |
|
Iron (D4018) |
7.10 (0.90) |
276 |
414 |
166 |
23.38 |
– |
|
Aluminium (AA6111) |
2.71 (0.34) |
275 |
295 |
70 |
25.83 |
1.3-2.0 |
|
Magnesium (AM50) |
1.77 (0.23) |
124 |
228 |
45 |
25.42 |
1.5-2.5 |
|
Composites - Carbon fiber - Glass fiber |
1.57 (0.20) |
Flexural 200 |
810 |
190 |
121.02 |
2.0-10.0 |
These considerations allow considering a much more extended activity of substitution of material. Just magnesium has not been considered at this moment because of its dangerous workability. This activity lead to evaluating a general structural weight reduction of about 50% with the introduction of composite parts which has been done from years in the military versions.
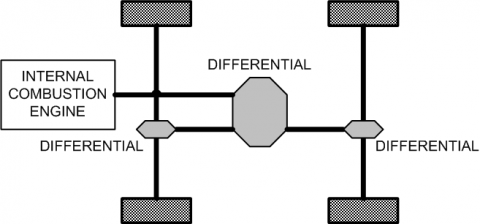
6.2 Hybrid propulsion
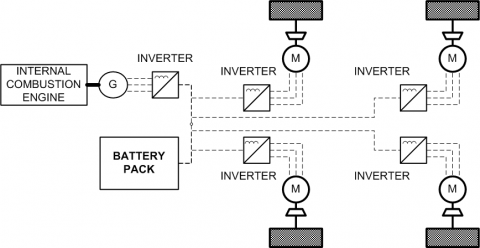
Hybrid propulsion of the vehicle is a basic requirement to meet the expected energy related goals. Different architectures can be considered and compared with the actual configuration (Figure 5). They are in particular:
From a very preliminary analysis the best solution has appeared to be the parallel solution because of lower weights and best performance when compared to traditional in series solutions. After this preliminary analysis a different solution has started to be preferable because of the presentation of extraordinary step advancement in the field of electric propulsion.
Figure 5. Defender Powertrain schema
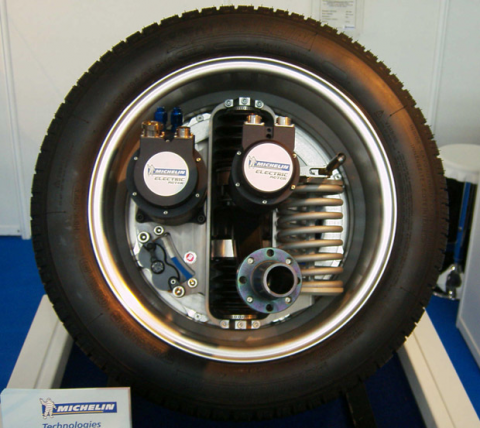
This solution is Michelin in wheel electric power system, which couples a standard wheel and a pair of electric motors. One of the motors spins the wheel and transmits power to the ground, while the other acts as an active suspension system to improve comfort, handling and stability. The system is designed for battery or fuel-cell powered electric vehicles, and the technology is such that a vehicle equipped with it will no longer need any gearbox, clutch, transmission shaft, universal joint or anti-roll bar. Active Wheel’s compact drive motor and integrated suspension system has also enabled designers to fit a standard brake disc between the motors, which means the braking, drive and suspension components are all fitted within the single wheel [18].
Figure 6. Michelin Active in-wheel propulsion, brake, energy recovery, and suspension
Figure 7. In series vehicle powertrain schema
Figure 8. Venturi prototype and link of the Active wheel to the chassis
This propulsion system allows rethinking the entire vehicle, even if a more effective suspension can be considered with respect to the ones that are currently installed. In particular, this redesign activity will be focused on the possibility of installing it on an off road vehicle. Those wheels are water-cooled then placing some protection against external agents seems evidently possible.
According to this architecture and taking the data from Venturi commercial model [20], which is equipped by Michelin Active, wheels it has been developed an effective assessment of the system. The utilized methodology is the one proposed by Belton [20] an in particular according to the model, which has been defined by Ucarol [21].
Whatever they do not consider to do any modification at vehicle level, also the activity by Singer-Englar et al. has been considered. This one considers in detail the design of a SUV with a parallel powertrain hypothesis. A very preliminary assessment, including the reduction of weights according to the above-related evaluations, is reported in Table 5.
According to these evaluations, it is clear the advantage of the proposed powertrain based on active Wheels with respect to any other one.
Table 5. Comparison of different propulsion architectures
|
|
Actual Defender |
Michelin Active Weels |
Hybrid in series |
|
P engine (kW) |
90 |
73 |
73 |
|
P generator (kW) |
- |
90 |
45 |
|
P electric motor(kW) |
- |
100 |
40 |
|
Battery capacity kWh |
- |
90 |
60 |
|
Vehicle weight (kg) |
1375 |
1130 |
1130 |
|
Engine/Motor (kg) |
320 |
140 |
140 |
|
Suspensions (kg) |
70 |
0 |
70 |
|
Powertrain (kg) |
100 |
0 |
75 |
|
Steering system (kg) |
25 |
0 |
25 |
|
Braking system (kg) |
40 |
0 |
40 |
|
Electric motor (kg) |
0 |
120 |
60 |
|
Generator (kg) |
0 |
80 |
60 |
|
Battery (kg) |
0 |
600 |
450 |
|
Curb weight |
1930 |
2070 |
2050 |
|
Fuel |
120 |
45 |
60 |
|
Others (kg) |
134 |
61 |
125 |
|
Passengers (kg) |
140 |
140 |
140 |
|
Total Weight |
2324 |
2316 |
2375 |
|
Max Load (kg) |
980 |
980 |
980 |
|
Max weight (kg) |
3304 |
3296 |
3355 |
This important issue is fundamental for improving the vehicle performance and energy efficiency.
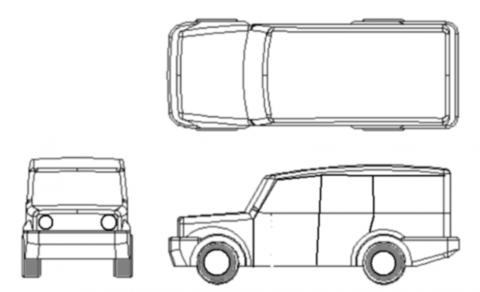
The reshaping activity is currently in an optimization phase. The results allow keeping the same dimensions of the Defender with major aerodynamic improvements without radical changes into the styling.
Figure 9. Preliminary land rover defender reshaping
A preliminary draft is presented in Figure 9. CFD activity which is still running to ensure an effective system optimization is producing a CD of 0.425 with major improvements with respect to the actual configuration. An objective of this activity around 0.38 is expected as a final result.
Considering a pessimistic CD of 0.425 aerodynamic performances of the vehicle can be completely recomputed.
Data have been evaluated according to equations 4,5,6. Energy conversion losses have been extimated about 5%.
By iterating this evaluation process as a function of a step by step by step process focusing on substituting critical components it has been possible to produce an effective and more efficient configuration based on the former choices.
The used methodology has been the one enunciated by Bejan [23] and Reis [24] with the successive modification by Trancossi [8, 9]. These results have been outstanding. They allow a much more performing layout, which has been described in Table 6.
This process has allowed reducing weight and setting up the components for the car with more accuracy. In particular weight has been further reduced with a better analysis of the different kind of missions and a more accurate dimensioning of the energy storage system.
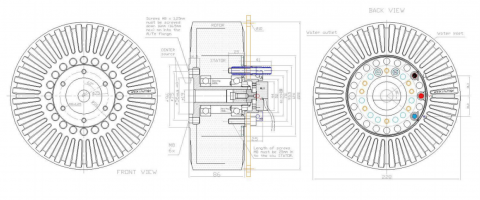
The final results have been delivered in Annex 2. In particular, it has been assumed to adopt an EMRAX 228 100 kW liquid cooled motor-generator connected directly to the motor to work both as start motor and as continuous generator. This component has a low mass and is well performing with reduced losses (less than 2 kW at 4000 rpm).
Figure 10. EMRAX motor generator drawing
Table 6. Evaluated energy consumption according to Sovran and Bohn method by data from Appendix 1
|
|
% |
Actual Defender Declared Data |
New Version Evaluated data |
|||||||
|
City |
H way |
Comp |
City |
H way |
Comp |
City |
H way |
Comp |
||
|
(%) |
(%) |
(%) |
MJ/100km |
MJ/100km |
MJ/100km |
MJ/100km |
MJ/100km |
MJ/100km |
||
|
|
Fuel Tank |
100 |
100 |
100 |
414.42 |
308.25 |
345.92 |
182.83 |
199.95 |
282.40 |
|
Engine |
Engine |
69.5 |
65 |
67.25 |
288.02 |
269.37 |
278.7 |
127.07 |
129.97 |
189.91 |
|
|
Standby |
5.5 |
0.75 |
3.15 |
22.79 |
3.11 |
13.05 |
10.06 |
1.50 |
8.90 |
|
|
Output |
25 |
34.75 |
29.9 |
103.61 |
144.01 |
123.91 |
45.71 |
69.48 |
84.44 |
|
Power train |
Driveline |
6 |
5 |
5.5 |
24.87 |
20.72 |
22.79 |
10.97 |
10.00 |
15.53 |
|
|
Output |
19 |
29.75 |
24.4 |
78.74 |
123.29 |
101.12 |
34.74 |
59.49 |
68.91 |
|
Operations |
Rolling |
4.4 |
10.05 |
7 |
18.23 |
41.65 |
29.01 |
5.25 |
13.67 |
31.24 |
|
|
Drag |
3.65 |
15.8 |
8.9 |
15.13 |
65.48 |
36.88 |
9.08 |
39.29 |
22.13 |
|
|
Kinetic |
9.85 |
3.15 |
7.5 |
40.82 |
13.05 |
31.08 |
20.41 |
6.53 |
15.54 |
The power in the High Voltage configuration (continuous current of 900 Arms) is around 35-55 kW (3000 - 5000 rpm) with an efficiency over 92%. Weight is around 12.3 kg.
This component forces the choice of an adequate engine. The choice has been a small engine such as Fiat 1400L (1400 cc. 16 V 70kW at 5800 rpm and dry weight of 150 kg). In the expected range of utilization (around 3000 rpm at constant speed fuel consumption is expected at less than 4.5 l/100 km and GHG emissions less than 100 g/km). This choice allows assuming a 220 kg all-inclusive weight for motor and generation, including inverters. According to evaluation about consumption in the novel configuration, the battery has been limited to 350 kWh.
Final Summary of the technical data, which have been produced by this algorithmic design activity focused on the energy optimization, is reported in APPENDIX 2.
This paper has demonstrated that a very well defined redesign of a mechanical system, such as a car is, can be performed by considering an effective energy optimization process, which can produce both minimization of impacts but also minimization of emissions.
The obtained layout is an initial configuration for the recursive design process. In particular, it allows thinking a very innovative design of possible future hybrid vehicle specifically designed with the generous dymensions of the Land Rover Discovery.
The results clearly show that outstanding results in terms of energy efficiency can be obtained. The comparison between the original vehicle and the new design is presented and a general reduction of consumption and emissions around 50% can be extimated.
|
A |
Frontal area [m2] |
|
CD |
Drag coefficient [-] |
|
Ex |
dissipated energy [kJ] |
|
c |
friction coefficient [-] |
|
g |
acceleration of gravity [m/s2] |
|
m |
mass [kg] |
|
mp |
mass of payload [kg] |
|
mtot |
total mass [kg] |
|
t |
time [s] |
|
v |
velocity [m/s] |
|
vav |
average velocity [m/s] |
|
vmax |
maximum velocity [m/s] |
Appendix 1
|
LAND ROVER DEFENDER 110 TURBO DIESEL DATA |
||||
|
body type |
4/5 seater off-road vehicle |
|||
|
|
mm |
inches |
||
|
wheelbase |
2794 |
110 |
||
|
length |
4445 |
175 |
||
|
width |
1791 |
70.5 |
||
|
height |
2035 |
80.1 |
||
|
Drag Coefficient |
0.59 |
|||
|
|
kg |
lb |
||
|
kerb weight |
1931.0 |
4257.0 |
||
|
payload |
927.0 |
2043.5 |
||
|
engine type |
turbocharged diesel |
|||
|
cylinders |
Straight 4 |
|||
|
capacity |
2.5 litre |
|||
|
|
2495 cc |
|||
|
(152.254 cu in) |
||||
|
bore × stroke |
90.5 × 97 mm |
|||
|
3.56 × 3.82 in |
||||
|
single overhead camshaft (SOHC) |
||||
|
2 valves per cylinder |
||||
|
maximum power output (din) |
90 kW at 4000 rpm |
|||
|
maximum torque (din) |
360 Nm at 2000 rpm |
|||
|
specific torque (din) |
81.36 Nm/litre - 0.98 ft·lb/cu3 |
|||
|
bmep (brake mean effective pressure) |
1022.4 kPa (148.3 psi) |
|||
|
engine coolant |
Water |
|||
|
aspiration |
Turbo D. |
|||
|
acceleration 0-100 km/h |
15.8 s |
|||
|
Declared fuel consumption |
km/l |
mpg |
l/100 km |
|
|
Urban |
7.4 |
20.8 |
13.6 |
|
|
Extra-urban |
10.3 |
29.2 |
9.7 |
|
|
Combined |
9.1 |
25.9 |
11 |
|
|
Effective fuel cons.* |
km/l |
mpg |
l/100 km |
|
|
|
10.9 |
30.7 |
15.9 |
|
|
|
14.6 |
41.3 |
11.8 |
|
|
|
12.9 |
36.7 |
13.3 |
|
|
Emissions |
Declared (mg/km) |
Effective*(mg/km) |
||
|
CO2 |
295 |
388.2 |
||
|
NOx |
153 |
201.3 |
||
|
PM10 |
1 |
1.3 |
||
|
|
W/kg |
bhp/ton |
||
|
power-to-weight ratio |
33.2 |
44.54 |
||
|
* Real MPG estimated based on real world driving conditions (source www. nexgreencar.com) |
||||
Appendix 2
|
Hibrid Defender Specifications |
||
|
Technical specifications |
||
|
Type |
4-seater hybrid Off road vehicle, 4 wheel drive by Michelin Active Wheel |
|
|
Electric generator |
||
|
Engine |
Fiat 1400 L |
|
|
Power |
70 kW (5800 rpm) |
|
|
Cogeneration regime |
3000 rpm |
|
|
Cogeneration frame |
2500 -4000 rpm |
|
|
CO2 Emissions |
100 g/km |
|
|
Motor Generator |
EMRAX 228 |
|
|
Max Power |
100 kW (5800 rpm) |
|
|
Regime Power |
35 - 55 kW |
|
|
Regime Rpm |
3000 -5000 rpm |
|
|
Michelin Active Wheel” |
||
|
Electric motor |
4 wheel-motors with max power of 55 kW (220 kW total) Liquid cooled |
|
|
Power limitation |
30 kW |
|
|
Max torque |
232 Nm (4x58 Nm) from 0-8,500 rpm |
|
|
Suspension |
Electric shock absorber on wheels |
|
|
Brakes |
Discs and specific calipers |
|
|
Batteries |
Polymer Lithium |
|
|
Energy |
45 kWh |
|
|
Batteries Weight |
350 kg |
|
|
Life-span |
over 1,500 cycles |
|
|
|
Kinetic regeneration system |
|
|
80% recharge |
||
|
Ext. recharge booster (10 kW) |
4 hours (220 V-16 A T) |
|
|
Onboard charger |
8 hours (220 V-16 A mono) |
|
|
Chassis |
||
|
Central unit |
Aluminium profiles reinforced with composite plates |
|
|
Front and rear mesh |
Safety meshes and roll bars in aeronautic steel |
|
|
Bodywork |
Aluminium with carbon fiber doors and engine bonnet Aeronautic steel reinforcements on the doors for protection from side crashes |
|
|
Performance |
||
|
0-100 km/h |
< 12 s |
|
|
Top speed |
120 km/h |
|
|
Range |
||
|
Battery |
at 90 km/h |
320 km |
|
Battery & fuel |
at 90 km/h |
over 600 km |
|
Battery & Fuel |
Medium Off road |
200 km |
|
Dimensions |
||
|
Length |
4785 mm |
|
|
Width |
1790 mm |
|
|
Height |
2000 mm |
|
|
Front gauge |
1486 mm |
|
|
Rear gauge |
1486 mm |
|
|
Wheelbase |
2794 mm |
|
|
Front tyres |
MICHELIN 235/85R16C |
|
|
Rear tyres |
MICHELIN 235/85R16C |
|
|
Curb weight |
1760 kg |
|
|
Curb weight |
2860 kg |
|
[1] E. E. Reber, R. L. Michell and C. J. Carter, “Oxygen absorption in the earth’s atmosphere,” Aerospace Corp., Los Angeles, CA, Tech. Rep. TR-0200 (4230-46)-3, Nov. 1988.
[2] VV. AA., “Transport Energy Efficiency,” IEA, International Energy Agency, 2010.
[3] VV. AA., “25 Energy Efficiency Policy,” IEA, International Energy Agency, 2008 (Updated 2011).
[4] VV. AA., “Implementing Energy Efficiency Policies: are IEA member countries on track?” IEA, International Energy Agency, 2008.
[5] VV. AA., “Tracking Clean Energy Progress,” IEA, International Energy Agency, 2014.
[6] VV. AA., “Energy Technology Perspectives 2015 – Mobilising Innovation to Accelerate Climate Action,” IEA, International Energy Agency, 2015.
[7] VV. AA., “Climate Change 2014: Mitigation of Climate Change,” Contribution of Working Group III to the Fifth Assessment Report of the Intergovernmental Panel on Climate Change, IPCC, Cambridge University Press, Cambridge, NY, USA, 2014.
[8] F. An and A. Sauer, “Comparison of passenger vehicle fuel economy and greenhouse gas emission standards around the world,” Pew Center on Global Climate Change, 2004.
[9] M. Trancossi, “A constructal response to industrial maturity and energetic issues of the transport vehicles,” Eur. Transp. Res. Rev. 7:2, 1-14, 2015.
[10] M. Trancossi, “What price of speed? A critical revision through constructal optimization of transport modes,” International Journal of Energy and Environmental Engineering, 1-24, Feb. 2015.
[11] J. Dewulf and H. Van Langenhove, “Exergetic material input per unit of service (EMIPS) for the assessment of resource productivity of transport commodities,” Resour. Conserv. Recycl. 38(2), 2003, pp. 161–174. DOI: http://dx.doi.org/10.1016/S0921-3449(02)00152-0.
[12] G. Wall and M. Gong, “On exergy and sustainable development – Part 1: Conditions and concepts,” Exergy Int. J., vol. 1, no. 3, pp. 128-145, 2001. DOI: http://dx.doi.org/10.1016/S1164-0235(01)00020-6
[13] G. Wall and M. Gong, “On exergy and sustainable development – Part 2: Indicators and methods,” Exergy Int. J., vol. 1, no. 4. pp. 217-233, 2001. DOI: http://dx.doi.org/10.1016/S1164-0235(01)00030-9.
[14] VV. AA., “Die tops and Flops im Windkanal,” Autobild, Germany, April 2008.
[15] G. Sovran and M. Bonn, “Formulae for the tractive-energy requirements of vehicles driving the EPA Schedules,” SAE Technical Paper 810184, 1981. DOI: http://dx.doi.org/10.4271/810184.
[16] VV. AA., “Fueling our Transportation Future - MIT Report: On The Road in 2035, Chapter 3, Vehicle Weight Reduction Options,” Laboratory for Energy and the Environment, MIT, Massachusetts Institute of Technology, Boston, 2008.
[17] W. F. Powers, “Automotive Materials in the 21st Century,” Advanced Materials & Processes, 157:5/38-41, April 2006. DOI: http://dx.doi.org/ 10.1557/mrs2006.74.
[18] M. Anderson, “Engine and Transmission Mass as a Fraction of Vehicle Mass,” Integrated Vehicle System Design Course Notes, University of Michigan, January, 2007.
[19] V. Vijayenthiran, “Michelin’s Active Wheel technology in detail,” Motor Autority, 2008. http://www.motorauthority.com/news/1030025_michelins-active-wheel-technology-in-detail
[20] VV. AA., “Volage - ultimate electric GT,” Venturi S.A, France, 2015. http://www.v-group.fr/automotive-4/volage-2/
[21] C. Belton, P. Bennett, et al., “A vehicle model architecture for vehicle system control design,” SAE Technical Paper 2003-01-0092, 2003. DOI: http://dx.doi.org/10.4271/2003-01-0092.
[22] H. Ucarol, “Hybrid Electric Vehicle,” MSc. Thesis, Istanbul Technical University, 2003.
[23] A.Singer-Englar, R. Kamisky, et al., “Design and Development of a Parallel Hybrid Powertrain for a High Performance Sport Utility Vehicle,” SAE Technical Paper 2005-01-3827, 2005. DOI: http://dx.doi.org/10.4271/2005-01-3827.
[24] C. Zamfirescu and A. Bejan, “Constructal Tree-Shaped Two-Phase Flow for Cooling a Surface,” Int. J. Heat Mass Transfer, vol. 46, no. 15, pp. 2785-2797, 2003.
[25] H. A. Reis, “Constructal Theory: From Engineering to Physics and How Flow Systems Develop Shape and Structure,” Appl. Mech. Rev, vol. 59, no. 5, 2006, pp. 269-282. DOI: http://dx.doi.org/10.1115/1.2204075.