OPEN ACCESS
The purpose of this study was to obtain preliminary evidence in the fields of corporate financial reporting and financial risk analysis on the relevance of applying the constructal law, areas demarcated according to the golden ratio (≈ 1.618:1), and the second law of thermodynamics – assuming that business entities are attracted toward states of maximum debt. More specifically, the study was aimed at contributing to the interpretation of the capital structure formation of business sectors by means of liabilities–to–assets ratio analyses. Data was obtained from published financial statements pertaining to companies that were listed on the Johannesburg Stock Exchange, mainly relating to the financials, basic materials and consumer goods sectors.
It was found that, respectively, 82,35% and 100% of the liabilities to assets of the basic materials and consumer goods sectors fell within the demarcated areas during the periods that were reviewed. This indicates the tendency of these sectors to arrange their capital structures according to the constructal law. On the contrary, the highly leveraged capital structure of the financials sector fell distinctly out of the demarcated areas.
It is posited that the constructal law, the second law of thermodynamics, as well as the golden ratio are relevant when analysing liabilities to assets; despite of the laws and the ratio being associated with the natural sciences. Further research could lead to the development of new theories regarding corporate financial reporting and risk analysis, with the potential to enhance the transdisciplinary standing and relevance thereof.
Constructal law, Financial risk, Golden ratio, Liabilities to assets.
During 2009 a pilot study was undertaken to determine whether there existed an area or areas within which the capital structures of companies typically formed according to the golden ratio and a notion of the second law of thermodynamics (hereafter also called the second law). The study was terminated during 2010 mainly for two reasons. Firstly, critics claimed that the transdisciplinary scope of the study was too broad as it encompassed the social and natural sciences, and secondly, the liabilities–to–assets ratio analyses of many of the companies that were reviewed failed to show relevance on a consistent basis.
The study was readdressed during 2014 through the constructal law, by noting that the law governs everything that moves – including man–made flow systems, and that large numbers of structures resemble the golden ratio in order to facilitate flow access for the purpose of survival ([1], [115, 223]). Hereby the constructal law provides a scientific basis for explaining the appeal of the golden ratio ([1], [222]) and for bridging the divide between the natural and social sciences.
From a fundamental perspective, the golden ratio, physics, the constructal law, corporate financial reporting, and financial risk analysis were further linked by the ubiquity of symmetry. In short, symmetry is linked to the golden ratio because the ratio is primarily a relationship of unusual balance, harmony and symmetry ([2], [3]). Symmetry permeates all of science and serves as the foundation of the basic laws of physics ([3], [13]). The relationship between symmetry and the second law is evident when noting that the law is about attracting systems to states of equal (symmetric) energy distributions. Noether’s theorem, namely that for every continuous symmetry of the laws of physics there must be a conservation law, and that for every conservation law there must be a continuous symmetry ([3], [97]), links the constructal law to symmetry, because the law pertains to the dynamics of open flow systems for the purpose of them being conserved. In the fields of corporate financial reporting and financial risk analysis (the terms are hereafter also shortly referred to as financial reporting and risk analysis), symmetry is embedded in the basic accounting equation, thereby impacting on the creation and interpretation of corporate capital structures.
The results of the readdress, i.e. the study at hand, are more encouraging than that of the pilot study; mainly because it was found that the capital structures of the basic materials and consumer goods sectors resembled the golden ratio during the periods that were reviewed. Further, the study indicated the probability of the second law governing the attraction of business entities towards maximum debt. The likelihood therefore exists that the dynamics of social systems, similar to that of natural systems, are guided by invariant underlying principles.
The paper offers a problem statement and aim of study, followed by a theoretical review of the main aspects considered, a discussion on the research methodology and findings, after which it ends with a conclusion.
At present, business entities are driven by flow based and nonlinear economic performance variables – in addition to those pertaining to previous stages of economic development. Corporate financial reporting theory, embedded in linear, static and fragmented Newtonian thought, is losing relevance to those business entities operating in fast moving, information driven, highly interconnected and uncertain economies. This problem also occurs, to a lesser extent, in the field of financial risk analysis.
In recognition of such declining relevance, and motivated by the emerging transdisciplinary trend in the development of science, many professionals are calling for resourceful initiatives by which to understand the dynamics and structural formation of business entities and economies, based on various branches of the natural sciences, and on out–of–equilibrium, network oriented models ([4], [3]).
To deal with the complexity of business entities operating in present-day economies from a classical perspective often results in the development of contradictory, over– or under elaborated theories in the fields of financial reporting and risk analysis. Such theories compromise the creation, stability and simplicity of the guiding principles necessary to sustain relevance in an increasingly uncertain economic age. In the field of financial risk analysis, consider for example the vague suggestion to compare “ratios to rules of thumb, ... industry averages, or [to] look for changes in the ratios over time” ([5], [57]).
A different language is required to more effectively report on and analyse complex systems such as business entities and volatile economies; one based on a stable set of underlying, unified transdisciplinary theories. In search of such language, scientific interest is emerging in the description of irregular rather than regular phenomena ([6], [7]) to complement the anti–reductionist perspectives that have steadily been developed from around the mid–twentieth century ([7], [x]). In addition to the constructal theory, also consider for example the theoretical development occurring in the realm of chaos and complexity. These theories are transdisciplinary and holistic, increasing in relevance as they are steadily being woven into the web of science. In the fields of financial reporting and risk analysis, the usage of such theories is at best in an early stage, requiring a deliberate impetus to be applied more intensively.
The main aim of this study was to determine whether the collective capital structures of companies, statistically representative of the sectors within which they function, were formed according to the constructal law, the golden ratio and the second law. If the aim could be affirmed, a contribution can be made towards implementing an in–depth transdisciplinary view of business dynamics and design – from a much broader perspective as the mere formation of capital structures and risk analysis.
4.1 Constructal law
Bejan ([1], [3]) defines the constructal law as follows: “For a finite size flow system to persist in time (to live), its configuration must evolve in such a way that provides easier access to currents that flow through it”.
The constructal law is supported by Prigogine’s theory on dissipative structures ([8], [244]), positing that the structure of an open system is created and sustained by the continuous flow of energy and matter through the system ([9], [14]). Accordingly, one could argue that the constructal law is a conservation and an evolutionary law pertaining to open systems.
The law was applied in this study because it is revolutionary in that it governs the dynamics of any kind of flow system, whether it is natural or social. Hereby the law aids to unify the separate disciplines of science from the standpoint that life is generally about movement and morphing, and that with these attributes lacking, a system is dead ([1], [6)]). The constructal law thus supports transdisciplinary research at fundamental level, which aids in achieving the aim of this study.
According to the constructal law, it is clear that the structure of a system represents a footprint of the flow of energies through it. In this study, the capital structures of business entities and sectors were similarly assessed.
4.2 Golden ratio
After the crash of the American stock market in 1929, investor confidence was at an all–time low with the stock market being viewed by many as “a costly roll of the dice” ([10], [177]). This viewpoint pertains to the fact that stock market crashes are often unforeseen because macroeconomic flows look good before a crash occurs ([11], [13-14]). In an attempt to explain the crash, Elliott, an accountant and engineer, studied decades of stock performance charts, eventually concluding that all human activities have three distinctive features, namely patterns, time and ratio, all of which observe the Fibonacci summation series ([10], [177-178]; ([12], [23]). The Fibonacci numbers are linked to the golden ratio because the proportion of two consecutive Fibonacci numbers approximates the golden ratio.
Hemenway ([2], [3]) argues that by finding patterns, relationships and tell–tale signs, a formula could be found that is key to a unifying principle, a base principle of first order, and that in “proportion we find a strategy to do this; in Divine Proportion, a real possibility”. The divine proportion, also referred to as the golden ratio, was described mathematically by Euclid in Elements as follows: “A straight line is said to have been cut in extreme and mean ratio when, as the whole line is to the greater segment, so is the greater to the lesser” ([2], [190]).
The divine proportion is illustrated in figure 1, where AC/AB = AB/BC, that is where AC/AB ≈ 1.61803:1, and AB/BC ≈ 1.61803:1.
Figure 1. Illustration of the divine proportion
The Greek symbol Phi (ф) is the mathematical symbol for the golden ratio, expressed as (1 + √5)/2 or approximately 1.61803:1 ([2], [190]). Phi inverted, 1/ф, equals ф minus 1. Interestingly, Phi is the only number with such a relationship ([10], [111]). In this study, Phi inverted was used to determine the areas within which the capital structure ratios could fall over time.
A notable trait of the golden ratio is that it “connects humanity to nature” ([1], [229]). Therefore, the application of the ratio, similar to applying the constructal law, aids to bridge the divide between the natural and social sciences. Complementary to the complexity of the theories that have been developed to report on and analyse capital structures, analyses according to the golden ratio could hold a simpler, more impartial approach by which to assess capital structures, given that a systemic structure representing the ratio is indicative of a system that has created the necessary flow of energy through it to survive ([1], [222]).
4.3 Second law of thermodynamics
In essence, the second law of thermodynamics states that heat in an isolated thermodynamic system flows from hotter to colder particles until all the particles in the system reach more or less the same temperature ([13], [689]). Roughly speaking, an isolated system is a system that does not exchange energy, matter and information with its environment, while an open system does ([14], [32]). A closed system is cut off from its environment to such extent that the system cannot interact with the environment effectively ([15], [189]). Business entities are viewed as open systems because they can exchange for example natural resources, labour, cash, inventory and financial information with the environments within which they function.
The second law relates to the entropy of the universe, which is continuously increasing towards a maximum ([16], [129]). Therefore, the law is viewed as an evolutionary law, embedded in the so–called arrow of time that progresses from earlier to later stages ([16], [128], [130]). In contrast, the first law of thermodynamics, declaring that the “energy of the universe remains constant” ([16], [129]), is a conservation law that allows for reversibility in the assessment of isolated systems.
The fields of financial reporting and risk analysis fundamentally involve activities pertaining to information theory. In turn, information theory is based on a notion of entropy through statistical mechanics ([7], [55]). Financial reporting and risk analysis are thus rooted in entropy by means of information theory. This alliance could be contested by arguing that “efforts to marry communication theory and physics have been more interesting than fruitful”, but a number of new approaches in physics related to Shannon’s information theory, for example the physics of information, are proving to be both fruitful and interesting ([7], [55]). In fact, the connection between information theory and entropy led to the viewpoint that the basic nature of economic processes is entropic, and that the law of entropy rules supreme over these processes ([16], [283]).
It ought to be considered however that one of the major shortcomings in economics is the purely classical application of the second law, by assuming that an economy as a whole can be understood by solely focusing on the equilibria resulting from the optimal use of its utilities ([4], [3]). Wheatley ([17], [77]) argues that in so doing “we have blinded ourselves to the processes that foster life. It is both sad and ironic that we have treated organizations like machines, acting as though they were dead, when all this time they’ve been living, open systems capable of self-renewal”. Similar to Wheatley, McCauley ([18], [23]) states that the idea of a market as a frictionless, 100% efficient machine that runs perpetually is an illegal idea from the standpoint of statistical physics, and as a result, empirically illegitimate assumptions about equilibrium were made in the field of economics. McCauley ([18], [23-24]) further infers that the second law is relevant to the assessment of market dynamics, because markets require mechanical acts like production, consumption and information processing, and that economists cannot apply the second law simply by postulating the maximisation of utilities.
In acknowledgement of the problem that deterministic and reversible laws do not address “the whole story” ([19], [2-3]) of the dynamics and design of an open system, the constructal law was applied in this study to assess how business entities avert stasis by forming flexible structures where flows are better, farther etc. ([1], [31]). Accordingly, a notion of the second law was applied in this study by regarding the law merely as governing the attraction of a business entity towards an unwanted state of financial equilibrium or stasis, where the liabilities of the entity are equal to its assets. In such state of stasis, a business entity is viewed as being highly limited in taking advantage of opportunities because the free cash flow of the entity is restricted.
4.4 Business entities viewed as flow systems
Constructal theory views social systems such as economies, governments and educational institutions as “always in flux, ever evolving to provide better and better flow access” ([1], [151]). Given that business entities form a significant part of economies, they likewise qualify to be viewed as flow systems.
According to the constructal theory, a flow system comprises two basic features, namely currents flowing through it and a design through which the currents flow ([1], [3]). In this study, the currents that were reviewed are the flows of assets, equity and liabilities, and the relationship between the values of these variables at a given point in time comprises the design through which these financial currents flow.
4.5 Corporate financial reporting theory
Corporate financial reporting theory was viewed in this study as the International Financial Reporting Standards (IFRSs) issued by the International Accounting Standards Board. This field of theory was selected because the financial statements of the companies reviewed were prepared accordingly. The relevance of corporate financial reporting theory was interpreted against the objective of general purpose financial reporting, stated in the 2010 Conceptual Framework for Financial Reporting ([20], [A19]) as follows:
to provide financial information about the reporting entity that is useful to existing and potential investors, lenders and other creditors in making decisions about providing resources to the entity. Those decisions involve buying, selling or holding equity and debt instruments, and providing or settling loans and other forms of credit.
4.6 Capital structure formation and financial risk analysis
A financial risk analysis is a comprehensive exercise including the investigation of a number of interrelated financial ratios from data published in corporate financial reports. Such investigations are conducted from various perspectives, among others, from differing opinions concerning the formation of capital structures in relation to financial risk. The numerous publications over several decades concerning capital structure formation and financial risk analysis indicate the complexity and importance thereof ([21], [140]; [22], [52]).
In essence, a financial risk analysis investigates the security of capital and income. The security of capital is determined by the quality of financial structures and liquidity. Therefore, an analysis of liabilities to assets over time pertains to the assessment of the security of capital ([23], [50]).
The study of Modigliani and Miller in 1958 concerning the financing of firms to ensure survival and growth serves as a starting point for obtaining an overview of capital structure formation and the financial risk associated with it. Modigliani and Miller posed the following question: “What is the ‘cost of capital’ to a firm in a world in which funds are used to acquire assets whose yields are uncertain; and in which capital can be obtained by many different media, ranging from pure debt instruments, representing money – fixed claims, to pure equity issues, giving holders only the right to a pro–rata share in the uncertain venture?” ([24], [261]). In their study, Modigliani and Miller unrealistically assumed the existence of perfect, frictionless capital markets ([25], [81]). This assumption can be associated with Newton’s classical first and third laws of motion, namely that “every object in a state of uniform motion tends to remain in that state of motion unless an external force is applied to it, and that for every action there is an equal opposite reaction” ([26], [33]). Consequently, the finding of their study, namely that the market value of any firm is independent of its capital structure ([24], [268, 287]), was irrelevant to the real dynamics that Modigliani and Miller attempted to explain. In 1963, Modigliani and Miller ([27], [441]) diverted from this finding, stating that a firm’s capital structure in the long run will contain both debt and equity, and that investment planning ought to recognise this fact.
For background purposes, three further main capital structure formation theories are summarised in table 1.
Table 1. Main capital structure formation theories
|
1. Trade–off theory (from the 1960s to the 1970s) Theory: The value of a firm is maximised by a capital structure formation where the marginal benefits of debt equal the marginal cost of debt or financial distress ([22], [51]; [25], [81]). Debt is preferred to equity as the cost of debt is tax deductible. This theory relates a high liabilities–to–assets ratio to good performance and the lowering of financial risk ([28], [78]), but fails to explain why some of the most profitable companies tend to borrow the least funds ([25], [89]). Practice: Target debt ratios are met by trading off bankruptcy costs against the benefit of debt tax shields ([28], [76]). |
|
2. Agency theory (from the mid–1970s) Theory: If both parties to an agency relationship, namely the principal and the agent, aim to maximise utilities, there is good reason to believe that the agent will not always act in the best interest of the principal ([29], [5]). As an agent group, managers could thus act in their own interest by engaging in over–investment practices ([25], [81]). The agency theory functions in line with the free cash flow theory. The free cash flow theory posits that free cash flow influences firm growth negatively ([22], [52]) and that debt reduces the agency costs of free cash because less cash is available for spending at the discretion of managers ([30], [3]). Under the agency and free cash flow theories, high debt levels increase market value, provided that operating cash flows significantly exceed profitable investment opportunities ([25], [81]). Practice: Target debt ratios are met by offsetting debt interest tax shields against bankruptcy and agency costs ([28], [78]). Free cash is often spent on the cost of debt, as straight debt offerings are not associated with significant stock price reactions ([31], [557]). |
|
3. Pecking order theory (from the mid–1980s) Theory: Owing to the information asymmetry between firms and investors, firms prefer to rely on internal sources of funds, and to incur debt rather than issuing equity if external financing is required ([32], [187, 189]). This theory explains why the majority of external financing is sourced from debt and why profitable firms borrow less ([25], [92-93]). According to the pecking order theory, high liabilities–to–assets ratios indicate poor performance. The theory fails to show how information asymmetry affects financing ([25], [95]). Practice: No target debt ratio is set ([25], [93]) because a hierarchy of financing is followed ([28], [78]). |
In view of the complexity of the theories pertaining to the formation of capital structures, Myers ([25], [81]) concluded that “there is no universal theory of the debt–equity choice, and no reason to expect one”. This viewpoint is in line with the constructal law and the pecking order theory, where benchmarks are not set ([1], [25]). Business entities could however benefit from forming capital structures according to designs generally found in nature, given that “Mother Nature has a much, much more significant track record than rationalistic humans. It is imperfect, but much better” ([33], [429]).
5.1 Sample and data selection
The statements of financial position of the 291 companies listed on the main board of the Johannesburg Stock Exchange (JSE) for 2013 served as the database. All the companies had access to the capital (equity) and bank (debt) markets, allowing them in this respect sufficient financial freedom to evolve. Currently, the JSE lists approximately 400 companies on its main board and AltX. The main board lists well–established companies seeking to attain the next level in growth, while the AltX lists promising, good quality small and medium–sized companies ([34], [n.p.]). The data was obtained from InetBFA, a South African database ([35], [n.p.]).
The sampling methodology was done according to the constructal theory, positing that “every multiscale flow system exhibits a hierarchical structure composed of a few large channels and many smaller ones” ([1], [157]). Firstly, the largest sectors, collectively comprising 90.84% of the main board listings, were sampled in terms of total asset value for 2013 by assessing the entire database. Both financial and nonfinancial entities were included in this study to assess the impact of the unique traits of the entities on the formation of their capital structures. The sectors hence identified were the financials, basic materials, and consumer goods sectors, contributing 55.18%, 27.66%, and 8% respectively to the database.
Secondly, the largest main board companies pertaining to the above three sectors were identified according to total asset size for 2013. The companies hence selected jointly had to comprise at least 80% of the total asset values of the sector within which they functioned. The number of companies sampled and the joint contribution made to their sector’s total asset size are given in table 2.
Table 2. Number of sampled companies and joint percentage of sector total asset size for 2013
|
Sector |
Number of companies sampled out of the total number of companies comprising the sector |
Joint percentage of the total asset size of the sector |
|
Financials |
8 out of 79 (10.13%) |
83.92% |
|
Basic materials |
4 out of 61 (6.56%) |
84.32% |
|
Consumer goods |
3 out of 23 (13.04%) |
80.63% |
The variables used in the analysis were the total equity (including preference shares), total liabilities and total assets (including intangible assets), as the relationship between these three variables comprises the main formation of a corporate capital structure.
The data was obtained from published financial statements. To allow for comparability, it was verified that all the entities having reported in currencies other than the South African Rand (ZAR), prepared their statements according to the IFRSs, or to other comparable reporting standards. All foreign financial currencies were converted to the ZAR at calendar year end.
The periods of the sector analyses were determined by the consistent availability of data for all the related companies sampled. Due to the listing and delisting of companies over time, the periods differed. Table 3 indicates the periods that were reviewed for the three sampled sectors.
Table 3. Period reviewed per sampled sector
|
Sector |
Period reviewed |
(n years) |
|
Financials |
2003 to 2013 |
11 |
|
Basic materials |
1997 to 2013 |
17 |
|
Consumer goods |
2008 to 2013 |
6 |
5.2 Research model
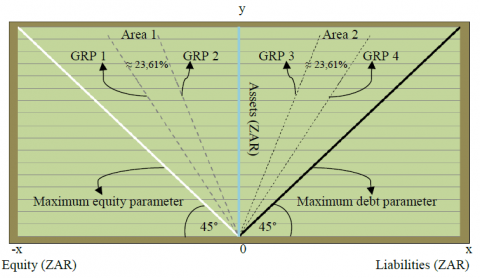
To aid the comprehension of the liabilities–to–assets ratio analysis per sector in line with the golden ratio and the second law, the ratios were illustrated in a graphic research model designed by the author specifically for the study at hand (see figure 2).
Figure 2. Illustration of the research model
The model is discussed briefly below:
5.2.1 Basic accounting equation
A = E + L (1)
5.2.2 Main parameters Two main parameters are indicated in the research model, namely the maximum debt parameter, where liabilities equal assets, and the maximum equity parameter, where equity equals assets. Therefore, the angles of both parameters are 45 degrees. It is assumed that the capital structure of an entity cannot form beyond these parameters indefinitely. When the liabilities of a business entity exceed the assets of the entity, the entity is regarded as insolvent and in a stage of dissolution.
At the maximum debt parameter, namely at the edge of bankruptcy, limited or no flow occurs without bifurcation or regulation. The reason being that excessive debt obligations can limit the available cash by which to seize operating or investing opportunities.
At the maximum equity parameter, the potential to seize operating or investing opportunities through external debt financing is at a maximum, provided that an entity has access to such financing owing to, for example, acceptable operating performance and good credit standing.
5.2.3 Areas demarcated according to the golden ratio In this study it was theorised that the capital structures of the companies under review form in two designated areas between the main parameters of the research model. These areas, referred to as area 1 and 2, were determined according to the golden ratio because the companies were regarded by the JSE as being well established, and because large numbers of sustainable systemic designs resemble the ratio ([1], [223]).
In the research model, area 1 is located in the equity–to–assets section, ranging from golden ratio parameter (GRP) 1 to GRP 2. Area 2 is located in the liabilities–to–assets section, ranging from GRP 3 to GRP 4.
The golden ratio parameters were calculated as follows:
GRP 4 = A x 0.6180339887 (2)
A equals the total asset values at financial year end.
GRP 3 = GRP 4 x 0.6180339887 (3)
GRP 2 = -GRP 3(4)
GRP 1 = -GRP 4(5)
Areas 1 and 2 each comprise approximately 23.61% of the total assets under review at a given point in time. The other areas comprise around 76.39% within each of the equity–to–assets and the liabilities–to–assets sections. It is thus about three times more likely for a liabilities–to–assets ratio to fall outside of area 2.
5.3 Data analysis
This study focussed on the ratio analysis of the liabilities to assets because it pertains directly to the security of the capital of a business entity. Mainly, it was determined whether the ratios fell within area 2 of the research model. A discussion on the equity to assets is not within the scope of this study, and the section is illustrated in the research models merely to aid comprehension.
The analysis methodology of the study is in line with the fluctuation theorem, applicable to the measurement of the sustainability of a wide variety of systems in disequilibrium ([36], [632]). This theorem acknowledges that the most effective dynamics of open systems occur at levels where the energy throughput is far from equilibrium – at relatively high throughput and uncertain rates ([9], [24]). It was assumed in this study that the liabilities to assets of entities “far from equilibrium” fall within area 2, and the equity to assets within area 1.
As a secondary analysis, it was determined whether the polynomial trend lines of the liabilities to assets fell within or curved towards the maximum debt parameter.
6.1 Sector 1: financials
Figure 3 shows that the liabilities to assets of the eight entities that jointly comprised 83,92% of the total asset values of the financials sector for 2013 fell significantly outside of area 2.
Figure 3. Financials sector: liabilities–to–assets ratio analysis from 2003 to 2013
During the period that was reviewed, on average, the liabilities comprised 92.76% of the assets. As illustrated in figure 3, the liabilities to assets therefore fell close to the maximum debt parameter. The average deviation of the ratios from GRP 4 towards maximum debt was 50.09%. The high financial leverage of the sector is thus clearly notable. This finding indicates that the capital structure of the financials sector did not resemble the golden ratio as applied in this study. The sector has nonetheless proven to be sustainable over time, suggesting that another ideal capital structure formation ratio is relevant to this sector.
The polynomial trend line of the liabilities–to–assets ratio time–series followed the series closely and diverted from the maximum debt parameter by merely 1.21% from 2003 to 2013. The maximum debt parameter was thus functioning as an attractor towards maximum debt because the trend line remained in close proximity thereof.
The distinct differences between the operating activities of a nonfinancial and financial sector explain why the latter is highly leveraged. In contrast to nonfinancial business entities, many financial entities, and specifically banks, are driven by leverage because the financial entities play a primary role in the provision of debt to clients, and largely finance the debt issued to clients by acquiring loans from other parties. For this reason, the average liabilities–to–assets ratio of banks, globally, is approximately 95:1 ([37], [2]). The average liabilities–to–assets percentage calculated for the financials sector in this study (92.76%) fell in close proximity.
Financial institutions constitute a large part of national economies, and therefore the well–being of national financial sectors is crucial to the stability of the global economy. The high sensitivity of financial entities to financial risk is a primary reason why they are decidedly regulated. Capital structures resembling the golden ratio require greater freedom to evolve, explaining why the liabilities to assets of the financials sector did not fall within area 2. It is therefore concluded that the liabilities to assets of business entities consistently arranging close to the maximum debt parameter, regardless of whether the ratios pertain to nonfinancial or financial entities, are indicative of a high sensitivity to financial risk as the freedom of such entities to adjust is limited because of financial constraints and/or stringent regulation procedures.
6.2 Sector 2: basic materials
Figure 4 indicates that the majority of the liabilities to assets of the four entities that jointly comprised 84.32% of the total asset values of the basic materials sector for 2013 fell within area 2, thereby strongly resembling the golden ratio. More specifically, fourteen of the seventeen (82.35%) ratios from 2000 to 2013 fell within area 2. The other three ratios, from 1997 to 1999, deviated from GRP 3 towards the maximum equity parameter by 22.37%, 21.78% and 24.85% respectively. Therefore, the basic materials sector indicated a lower sensitivity to financial risk than the financials sector.
Figure 4. Basic materials sector: liabilities–to–assets ratio analysis from 1997 to 2013
The polynomial trend line curved towards the maximum debt parameter, supporting the assumption that the parameter functions as an attractor towards maximum debt.
6.3 Sector 3: consumer goods
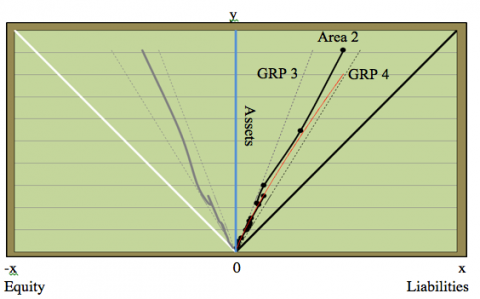
Figure 5 indicates that all the liabilities to assets of the three entities that jointly comprised 80.63% of the total asset values of the consumer goods sector for 2013 fell within area 2.
Figure 5. Consumer goods sector: liabilities–to–assets ratio analysis from 2008 to 2013
Similar to the basic materials sector, the capital structure of the consumer goods sector resembled the golden ratio, indicating a lower sensitivity to financial risk than the financials sector. The polynomial trend line did not curve towards the maximum debt parameter, but fell within the range where the liabilities of the sector were greater than its equity, indicating an attraction towards the maximum debt parameter.
The basic materials and consumer goods sectors displayed capital structures resembling the golden ratio. These sectors thus indicated a lower sensitivity to financial risk than the financials sector because the financials sector was too highly leveraged. The polynomial trend lines of all three the sectors indicated an attraction towards maximum debt, thereby supporting the premise that corporate capital structures are attracted by insolvency.
In overview, it is concluded that through the constructal law, the golden ratio and the second law, a transdisciplinary guideline can be developed by which to disclose and analyse the capital structure formations of business entities and sectors. Further research in this field is highly recommended in order to ultimately enhance the scientific standing and relevance of financial reporting theory and risk analysis.
1. Bejan, A., Zane, J.P., Design in Nature: How the Constructal Law Governs the Evolution in Biology, Physics, Technology, and Social Organization, Doubleday, New York, 2012.
2. Hemenway, P., The Secret Code: The Mysterious Formula That Rules Art, Nature, and Science, Evergreen, Köln, 2008.
3. Lederman, L.M., Hill, C.T., Symmetry and the Beautiful Universe, Prometheus Books, New York, 2008.
4. Sornette, D., Ivliev, S., Woodward, H., eds., Market risk and Financial Markets Modeling, Springer, Heidelberg, 2012. DOI: 10.1007/978-3-642-27931-7.
5. Higgins, R.C., Analysis for Financial Management, 6th ed. Irwin McGraw–Hill, New York, 2001.
6. Sardar, Z., Abrams, I., Introducing chaos, Icon Books, Royston, 2004.
7. Mitchell, M., Complexity a Guided Tour, Oxford University Press, Oxford, 2009.
8. Rifkin, J., Entropy: a New World View, The Viking Press, New York, 1980.
9. Nicolis, G., Prigogine, I., Self–organization in Nonequilibrium Systems: From Dissipative Structures to Order through Fluctuations, John Wiley & Sons, New York, 1977.
10. Posamentier, A.S., Lehmann, I., The (fabulous) Fibonacci Numbers, Prometheus Books, New York, 2007.
11. Sornette, D., Why Stock Markets Crash: Critical Events in Complex Financial Systems, Princeton University Press, Princeton, 2003.
12. Prechter, R.R., Jr., The Wave Principle of Human Social Behavior and the New Science of Socionomics, New Classics Library, Georgia, 2002.
13. Penrose, R., The Road To Reality: A Complete Guide to the Laws of the Universe, Alfred A. Knopf, New York, 2005.
14. Jantsch, E., The Self–Organising Universe: Scientific and Human Implications of the Emerging Paradigm of Evolution, Pergamon Press, Oxford, 1980.
15. Lockwood, M., The Labyrinth of Time: Introducing the Universe, Oxford University Press, Oxford, 2007.
16. Georgescu–Roegen, N., The Entropy Law and the Economic Process, Harvard University Press, Cambridge, Massachusetts, 1971. DOI: 10.4159/harvard.9780674281653.
17. Wheatley, M.J., Leadership and the New Science: Discovering Order in a Chaotic World, 2nd ed. Berrett–Koehler Publishers, San Francisco, 1999.
18. McCauley, J.L., Dynamics of Markets: Econophysics and Finance, Cambridge University Press, Cambridge, 2004. DOI: 10.1017/CBO9780511606588.
19. Prigogine, I., Stengers, I., Order out of Chaos: Man’s New Dialogue with Nature, Bantam Books, Toronto, 1984.
20. IFRS Foundation, A Guide through IFRS, Part A1, London IFRS Foundation Publications Department, London, 2014.
21. Fosu, S., “Capital structure, product market competition and firm performance: evidence from South Africa,” The Quarterly Review of Economics and Finance, 53, 140-151, 2013. DOI: 10.1016/j.qref.2013.02.004.
22. Park, K., Jang, S., “Capital structure, free cash flow, diversification and firm performance: a holistic analysis,” International Journal of Hospitality Management, 33, 51-63, 2013. DOI: 10.1016/j.ijhm.2013.01.007.
23. Warren, B.O., Financial analysis, Renall Publishers, Pretoria, 1991.
24. Modigliani, F., Miller, M.H., “The cost of capital, corporation finance and the theory of investment,” The American Economic Review, 48(3), 261-297, 1958.
25. Myers, S.C., “Capital structure,” Journal of Economic Perspectives, 15 (2), 81-102, 2001. DOI: 10.1257/jep.15.2.81.
26. Jackson, T., Physics: An Illustrated History of the Foundations of Science, Shelton Harbor Press, New York, 2013.
27. Modigliani, F., Miller, M.H., “Corporate income taxes and the cost of capital: a correction,” The American Economic Review, 53 (3), 433-443, 1963.
28. Tudose, M.B., “Capital structure and firm performance,” Economy Transdisciplinarity Cognition, 15 (2) 76-82, 2012.
29. Jensen, M.C., Meckling, W.H., “Theory of the firm: managerial behavior, agency costs and ownership structure,” Journal of Financial Management, 3 (4), 305-360, 1976. DOI: 10.1016/0304-405x(76)90026-x.
30. Jensen, M.C., “Agency costs of free cash flow, corporate finance, and takeovers,” American Economic Review, 76 (2), 323-329, 1986.
31. Shyam–Sunder, L., “The stock price effect of risky versus safe debt,” Journal of Financial and Quantitative Analysis, 26 (4), 549-558, 1991. DOI: 10.2307/2331411.
32. Myers, S., Maljuf, N., “Corporate financing and investment decisions when firms have information that investors do not have,” Journal of Financial Economics, 13, 157-187, 1984. DOI: 10.1016/0304-405X(84)90023-0.
33. Taleb, N.N., Antifragile: How to Live in a World We Don’t Understand, Penguin Group, London, 2012.
34. Johannesburg Stock Exchange., Capital, Main Board, available from: <http://www.jse.co.za>, accessed 6 March 2015.
35. InetBFA., available from: <http://research.mcgregorbfa.com/Default.aspx>, accessed December 2014 to March 2015.
36. Dewar, R., “Information theory explanation of the fluctuation theorem, maximum entropy production and self–organized criticality in non–equilibrium stationary states,” Journal of Physics A: Mathematical and General, 36 (3), 631-641, 2003. DOI: 10.1088/0305-4470/36/3/303.
37. Ingves, S., Banking on leverage, Basel Committee on Banking Supervision available from: <http://www.bis.org/speeches/sp140226.pdf>, accessed 6 March 2015.