OPEN ACCESS
To explore the working mechanisms of a small diameter vortex tube and to improve its refrigeration performance, this study establishes a three dimensional numerical simulation model by using the standard k-ε turbulence model of its inside flow field. Analysis of the results of numerical calculation and combining with the characteristics of the flow of the working medium, the thermodynamic process of the working medium in the diameter vortex tube has been given. At the same time, this simulation method is proved feasible by comparing the simulation results with the experiment. Then the relationships between the portion of the structural parameters and the refrigeration performance of the vortex tube are analyzed and discussed.
Vortex tube, Numerical simulation, Refrigeration, Thermodynamic process.
A vortex tube is a separating unit that makes fluid flow in a particular way and uses the working fluid self-acting function. It can separate a strand of compressed air into two strands of both cold and hot airflows. A vortex tube is identified as a practical miniature refrigeration unit and has been widely applied in some special situations because of its stability, the simple delicate structure as well as having the advantage of being safe and environmentally friendly [1]. With advances in thechnology of related disciplines, especially in recent years, and the increasing demand for micro green refrigeration devices, the research on the small diameter vortex tube (diameter less than 15mm) has attracted much attention.
Because of the complexity of the flow field in the vortex tube, it is difficult to actually measure while not interfering with the flow field by using existing measuring technology. In early more theoretical and experimental research on the vortex tube on the whole [2], and Wang Pengtao gave the macroscopic thermodynamic process of the vortex tube through theoretical analysis of its thermodynamic phenomena [3, 4]. Xu Minyu presented the corresponding theoretical assumptions through an experimental study on the characteristics of the vortex tube refrigeration [5]. In recent years, a number of scholars obtained the changes of the parameters of the working medium into the vortex tube by numerical simulation. Zhou Shaowei described the flow and heat transfer process of the vortex tube working medium using numerical simulation [6], Khazaei and Rafiee studied the effects on the performance of the vortex tube under different structural and working parameters respectively based on the 2d and 3d numerical simulation model [7, 8]. These related research analyzed the working substance and energy separation of the vortex tube on the whole, but no in-depth research has been conducted for the thermodynamic mechanism of the vortex tube working medium change. Further study of its internal working mechanism can help to optimize the structure and improve the refrigeration performance.
With the small diameter vortex tube as the research object, this paper establishes the corresponding calculation mode of the flow field, obtains the change in the various parameters of the working medium by the numerical simulation, analyzes the internal working medium flow process and separation process and gives the thermodynamics explanation of the working mechanism in the small diameter vortex tube. At the same time the experimental study has demonstrated the effectiveness of using numerical simulation, then the influence of a portion of the structure parameters of the vortex tube on refrigeration performance are analyzed and discussed.
2.1 Basic structure of vortex tube
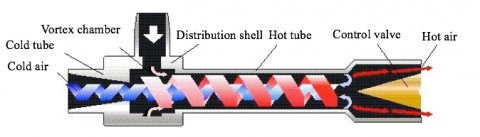
A vortex tube is generally composed of the distribution shell, vortex chamber, cold tube, hot tube and control valve. Figure 1 shows the general working process of the working medium in the vortex tube. The compressed air through the distribution shell. Then the vortex chamber will produce high tangential velocity and turn the high-speed swirl. At the same time, because the cold tube diameter is smaller, the air flow is blocked and the air flows axially to the end of the hot tube with the rotation. In this process the air is separated into two parts that have different temperature and mass. The outer air has a higher temperature and the air flows out from the hot tube through the control valve. The center air through the cold tube outflow has a low temperature and refluence occurs. By adjusting the control valve opening, the mass ratio of the cold and hot air can be controlled, so as to adjust the cold and hot air temperature.
Figure 1. Basic structure of vortex tube
2.2 Calculation model
The flow field calculation model is shown in Figure 2, the main structural parameters are as follows: vortex chamber diameter Dv=13mm, high H = 1.5 mm, six nozzles are on the vortex chamber tangentially equispaced, outer border radius Rv = 10 mm, throat width B = 1.2 mm, cold tube length Lc = 14.5 mm, cold tube taper θc = 20°, cold hole diameter dc = 3.8 mm, hot tube length Lh = 94 mm, cone of hot tube taper θz = 3°, straight hot tube diameter Dh = 10mm, control valve taper θ= 38.6°. In the model established in the cylindrical coordinate system, the center of the surface in which the hot tube combines with vortex chamber is the origin. The axis of the vortex tube is the z axis where the positive direction points to the cold air outlet.
Figure 2. Model of the flow field in the vortex tube
2.3 Turbulence model and boundary conditions
The turbulence model has a large influence on the results of numerical calculation, and the related research shows that the standard k-ε turbulence model can better reflect the change in the temperature of the vortex tube’s internal flow field [9-10]. On the basis of the Reynolds averaged N-S (RANS) equations [11] the standard k-ε turbulence model obtains the Reynolds stress by equation (1) and uses the turbulent kinetic energy equation (2) and turbulent dissipation rate equation (3).
$-\rho \overline{u_{i}^{\prime} u_{j}^{\prime}}=\mu_{t}\left(\frac{\partial u_{i}}{\partial x_{j}}+\frac{\partial u_{j}}{\partial x_{i}}\right)-\frac{2}{3}\left(\rho k+\mu_{t} \frac{\partial u_{i}}{\partial x_{i}}\right) \delta_{i j}$(1)
$\frac{\partial(\rho k)}{\partial t}+\frac{\partial\left(\rho k u_{i}\right)}{\partial x_{i}}=\frac{\partial}{\partial x_{j}}\left[\left(\mu+\frac{\mu_{t}}{\sigma_{k}}\right) \frac{\partial k}{\partial x_{j}}\right]+G_{k}+G_{b}-\rho \varepsilon-Y_{M}+S_{k}$(2)
$\frac{\partial(\rho \varepsilon)}{\partial t}+\frac{\partial\left(\rho \varepsilon u_{i}\right)}{\partial x_{i}}=\frac{\partial}{\partial x_{j}}\left[\left(\mu+\frac{\mu_{t}}{\sigma_{\varepsilon}}\right) \frac{\partial \varepsilon}{\partial x_{j}}\right]+C_{1 \varepsilon} \frac{\varepsilon}{k}\left(G_{k}+C_{3 \varepsilon} G_{b}\right)-C_{2 \varepsilon} \rho \frac{\varepsilon^{2}}{k}+S_{\varepsilon}$(3)
where Gk is turbulent kinetic energy caused by average velocity gradient, Gb is turbulent kinetic energy caused by buoyancy effect, YM is compressible turbulent flow ripple effects on the total dissipation rate, Prt is turbulent planck number, defined as 0.85; μt is turbulence viscosity coefficient.
The working medium carried out through the numerical value simulation is the ideal gas, and the wall is processed with non-equilibrium wall function and no slip wall boundary. The inlet boundary conditions is pressure inlet conditions of pi=0.5MPa (total pressure), Ti =300 K (total temperature). The cold and hot outlet also uses pressure conditions of pc=0.13MPa (total pressure), then adjusting the hot outlet pressure can change the mass rate of cold air with inlet air.
2.4 Mesh
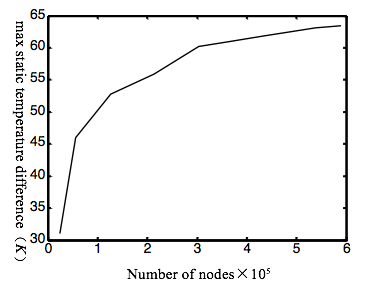
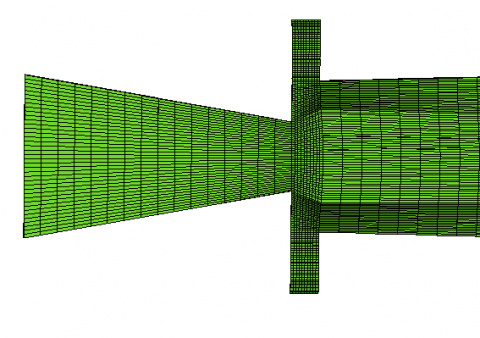
In order to improve the efficiency and precision of the numerical calculation, the method with unstructured meshes are employed in the calculation. The relation of the number of nodes and the maximum static temperature difference which keep the mass rate of cold air with inlet air is 0.35, as shown in Figure 3. The temperature difference tends to be stable in a situation where the number of nodes exceed 300000, and this paper calculates the grid node number of 303832. According to the mesh model, the renderings are shown in Figure 4.
Figure 3. Graph of the number of grid nodes and the maximum static temperature difference
(a) Overall rendering
(b) Front axial cross section
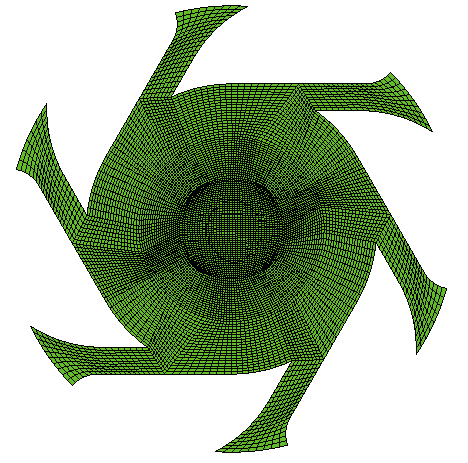
(c) Vortex chamber cross section
Figure 4. Mesh of the flow field
Numerical calculation results show that the gas moving through the nozzle and entrance of the vortex chamber turns into a strong cyclone with the tangential movement. Then, except for a decreased amount of gas exhausted through the cold tube directly, most of the gas axially flows to the end of the hot tube with the rotation, and in this process the working medium divides into two parts; in one part of the working medium the air exits directly through the hot end valve, and in the other part of the working medium refluence occurs and air outflows through the cold hole.
3.1 Vortex chamber
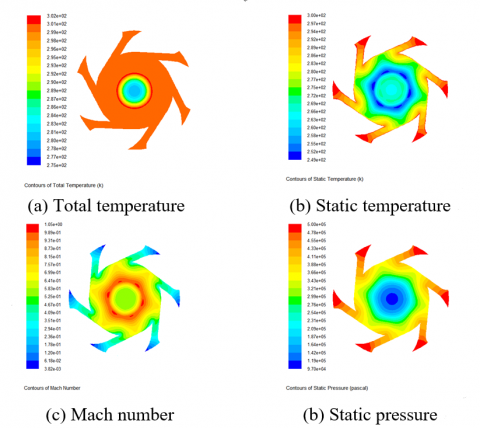
In the zone of the vortex chamber, the pressure energy is converted into kinetic energy, which lowers the static temperature of the gas. In this process the gas from the nozzle entrance has low speed, normal temperature and high pressure, then turns into high speed, low temperature and pressure gas, as shown in Figure 5. This transformation plays a key role in the formation of the flow separation phenomenon in the vortex tube, providing the initial higher kinetic energy and low temperature for the subsequent energy separation process. The calculation results show that before the gas enters the hot tube the main characteristic of this process is constant enthalpy, and there is no change in the total temperature of the gas, as shown in Figure 5 (a). This process is not an isentropic but rather adiabatic isenthalpic because of the irreversible factors such as friction, which causes the entropy to increase.
Figure 5. Simulation results of vortex chamber section
3.2 Hot tube
In the hot tube the gas is divided into the outer layer and inner layer flowing in opposite directions with zero axial velocity as the interface, which is the interface of the hot gas and the cold gas. Figure 6 shows the interface axial section. In the red area the gas has axial negative-velocities (pointing to the hot tube end). It is worth noting that this interface also exists in the vortex chamber, so the appropriate cold chamber diameter and cold hole diameter sizes have the potential to reduce or avoid gas directly educing through the cold hole.
Figure 6. The flow boundary line of cold and hot on the vortex tube axial section
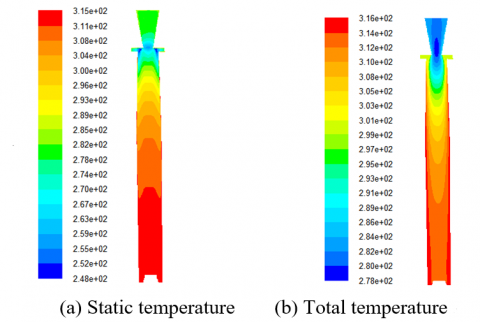
In the same axial position the static temperature of the outer layer is lower than that of the inner layer, as shown in Figure 7 (a), so the heat conduction is in a radial direction from inside to outside. The minimum total and static temperature appear in the cold hole because of the nozzle-like structure of the cold hole throat. In addition, the hot gas with heat continues to flow out of the control valve, reducing the total energy of the system. Thus, heat is constantly pulled away from the system, so the cold gas is less pulled away, and the cold gas temperature will be lower.
Figure 7. Contours of temperature on vortex tube axial cross section
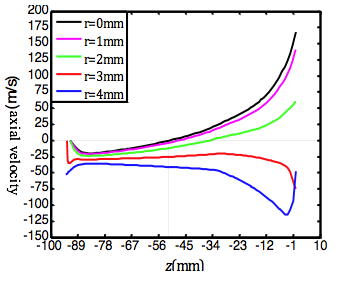
Figure 8. The graph of the axial velocity on the axial cross section with different r
The changes are analyzed axially in the cylinder of the hot tube, of which r=0, r=1mm, r=2mm, r=3mm, r=4mm. The axial velocity changes are shown in Figure 8. The inner reflux cutoff is at z=-52mm. In the area of z<-52mm, the axial velocity direction points in the direction of the hot tube end and changes appear at the hot tube because of control valve block. In a situation in which r>4mm, the gas accelerate moves out. In the area of r=3mm, axial velocity is stable and approaches zero axial velocity interface. Therefore the cylinder of r=3mm can be as zero axial velocity interface to a limited extent. In the area of r=0, r=1mm and r=2mm, the gas with positive axial velocity will turn into low temperature gas, and the gas with negative axial velocity will turn into higher temperature gas, so the gas in the area of r=4mm will be higher temperature gas and reflux will not appear.
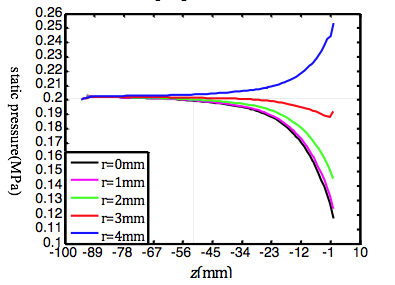
Figure 9. Graph of static pressure on the axial
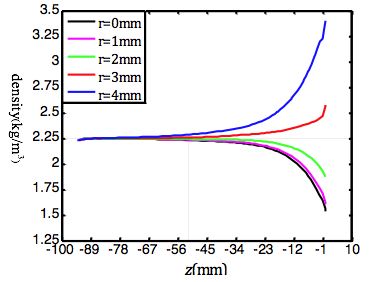
Figure 10. Graph of the density on the axial
The axial changes in static pressure and density with different radial positions in the hot tube are shown in Figures 9 and 10. The static pressure and density change in reflux tends to be weak with the same trend in the refluent process. This area has undergone the polytropic process of cooling, reducing pressure and expansion. In the area producing hot gas, the static pressure and density have the same change trend. The maximum decrease of static pressure is 0.06 MPa, but the density change is more obvious. The maximum decrease is close to 1.25 kg/m3. Figure 7 (b) clearly shows the area with significant changes in static pressure and density corresponding to the area that has significant changes of temperature. So, the density change is dominant in area producing hot gas, similar to a constant pressure expansion process. Therefore the hot side tube with taper has better conditions for gas expansion, and thus improves the efficiency of the endothermic process, which helps to reduce the length-diameter ratio of the vortex tube. It is worth noting that in the area of z<-52mm, the static pressure and density will flatten out and the expansion endothermic process almost completed, so the axial velocity must be accelerated as soon as possible to help the front expansion endothermic process be fully developed, and to increase the efficiency of the vortex tube. The related research of literature [12] verifies the correctness of this approach.
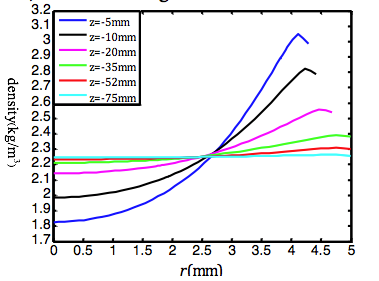
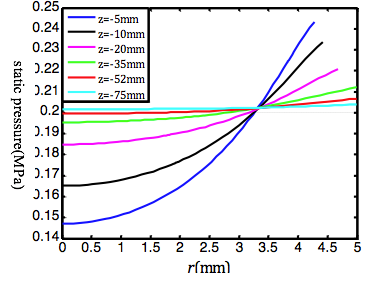
The radial changes in density and static pressure with different axial positions in the hot tube are shown in Figures 11 and 12. Decompressional expansion becomes more intense as the outer gas flows toward the center, and these changes are more intense when the axial position is more close to the cold hole.
Figure 11. Graph of density on the radial
Figure 12. Graph of static pressure on the radial
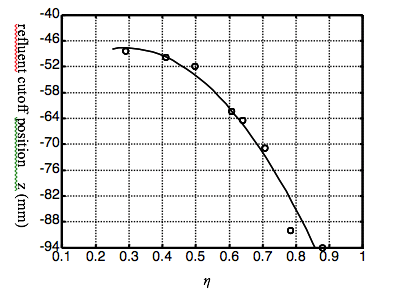
The rate η is an important operation parameter for adjusting the cooling or heating temperature; the smaller the η the lower the refrigeration temperature [13], which is defined as the mass rate of cold gas with inlet gas. According to the results of numerical calculation, the relationship of η and cutoff axial position of the inner reflux is shown in figure 13. The higher the η the closer the cutoff position is to the end of the hot tube. Refluent phenomenon will appear in all of the hot tube with η> 0.7.
Figure 13. The graph of the backflow cutoff position under the different cold flow rates
The cutoff position moves toward the end of the hot tube as the η increases, which makes the refluent process extended on the axial and average pressure is reduced in the decompression expansion process as the gas flows to the inner section. On the other hand, an extended refluent process causes the average total temperature of reflux to rise to a high level. So the smaller η, the lower the refrigeration temperature is.
3.3 Cold tube
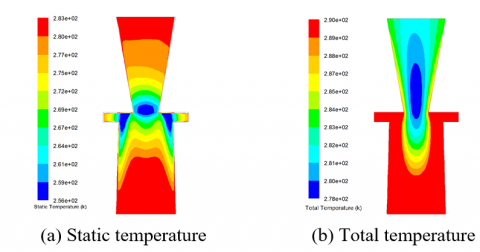
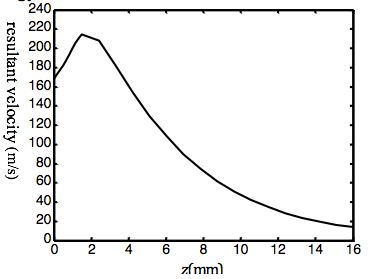
On the cold tube axial section, total and static temperature are shown in Figure 14. When the gas has just exited the cold hole, the static and total temperature hava a minimum value. Then the total temperature has a slight increase with the extrusive process, but the static temperature increases notably because of the decrease in resultant velocity, as shown in Figure 15.
Figure 14. Nephograms of the temperature distribution on the cold tube axial section
Figure 15. Graph of resultant velocity on the cold tube axis
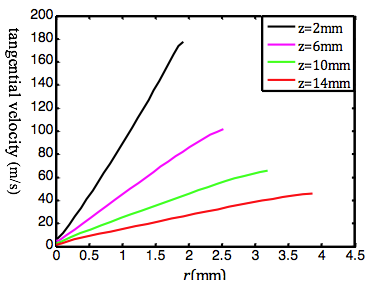
As shown in Figure 16, the characteristics of tangential velocity cause the rotation of the rigid body, and the rotation angular velocity is weakening as it approaches the outlet, indicating a further loss of kinetic energy.
Figure 16. Graph of tangential velocity with different cold tube cross-sections
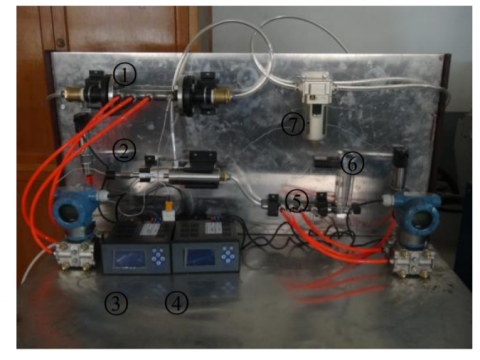
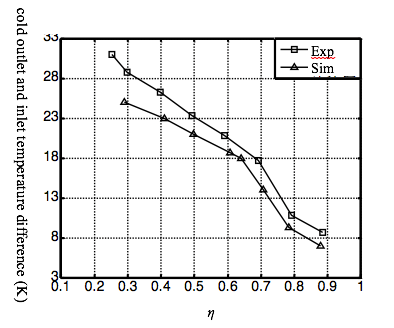
In order to verify the validity of the numerical simulation method used in the above, an experiment involving the vortex tube refrigeration temperature under various η, is carried out to prove the feasibility and accuracy of the refrigeration performance prediction of the small diameter vortex. In the experimental apparatus used as shown in Figure 17, the venturi meter and computing devices are used to measure the inlet and the cold outlet flow and to correct them under the standard condition. A gas rotameter will be used in case η is small. While setting up η, the cold outlet temperature and inlet temperature are measured by thermocouple. The relation of the cold outlet and inlet temperature differences with different η is obtained through using an experiment with the same boundary conditions of numerical simulation, and is compared with the results of numerical simulation, as shown in Figure 18. Comparison results show that although there is a certain quantitative error between the results of the numerical calculation and the experimental, the results of the numerical calculation can qualitatively reveal the phenomenon of separation and refrigeration in the small diameter vortex tube. In general, the numerical simulation method for the research on the small diameter vortex tube flow field is feasible in this paper.
1 The venturi meter of inlet; 2 Vortex tube; 3 Computing devices of inlet; 4 Computing devices of cold outlet; 5 Venturi meter of cold outlet; 6 Gas rotameter; 7 Air filter
Figure 17. Test bench of the experiment
Figure 18. Temperature differences between the cold outlet and the inlet under different η
The error analysis is as follows:
(1) The structural size of the calculation model has a certain difference with the actual experiment because of a simplified processing;
(2) In the numerical simulation, some calculation parameters are defined as a constant, not completely suitable for the actual situation of complex flow field in the vortex tube;
(3) There is a certain error between the boundary conditions of the numerical calculation and the experiment because of the uncertainty and the flow field disturbances in the experiment;
(4) It is difficult for a single vortex model to meet the requirements of the entire area of the flow field because of the complexity and diversity of the flow field in a small diameter vortex tube.
5.1 The influence of vortex chamber diameter on the refrigeration performance
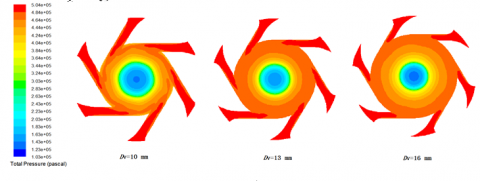
Maintaing the η within a range of 0.33 ~ 0.41 and taking the vortex chamber diameter Dv as 10mm, 13mm and 16mm with other conditions remaining unchanged, the Mach number and the distribution of total pressure on the cross section of the vortex chamber are shown in Figures 19 and 20.
The diameters of the vortex chambers directly affect its generated high-speed rotational flow. The velocity and total pressure is not only uneven but also have loss in the outer region with Dv=10mm, which reduces actual adiabatic efficiency. Taking Dv=13mm, the distribution of velocity is stable and likely ring, and total pressure is stabile and has a smaller loss in the outer area. Although the variance of the velocity with Dv=16mm seems to be less than the variance of the velocity with Dv=13mm, total pressure loss is larger in the outer area because of increasing radial vortex chamber.
Figure 19. Mach number nephogram on the vortex chamber cross-section under different diameters
Figure 20. Total pressure nephogram on the vortex chamber cross-section under different diameters
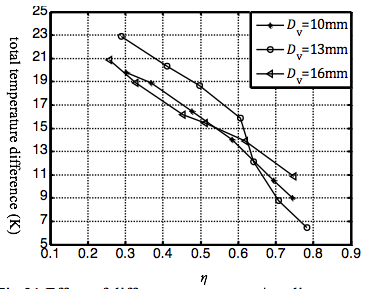
Figure 21. Effect of different vortex chamber diameters on total temperature differences between cold outlet and inlet
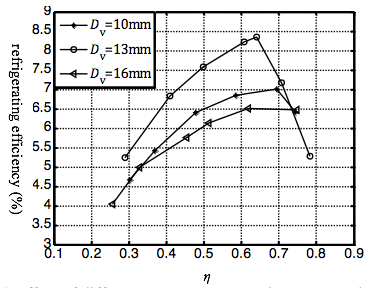
Figure 22. Effect of different vortex chamber diameters on the refrigerating efficiency
The changes in total temperature difference between cold outlet and inlet with different η under different vortex chamber diameters are shown in Figure 21. In the case of η<0.6, the temperature drop effect when the vortex chamber diameter is 13 mm is obvious in the other two groups, where the average difference is 4 K. When η > 0.6 and the vortex chamber diameter is 16mm, it can obtain a better total temperature difference than the other two groups with increasing η. One of the reasons is that in the high η, increasing the vortex chamber diameter can reduce reflux disturbance in the interior flow field, and thus improve the stability of the inner gas flow.
Refrigeration efficiency under different swirl chamber diameters is shown in Figure 22, the refrigeration efficiency when the vortex chamber diameter is 13mm is superior to the other two groups; η = 0.65 up to the maximum value, an improvement of1.8%.
5.2 The influence of the nozzle shape on the refrigeration performance
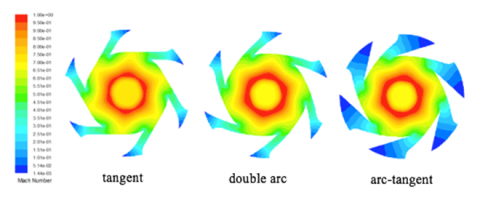
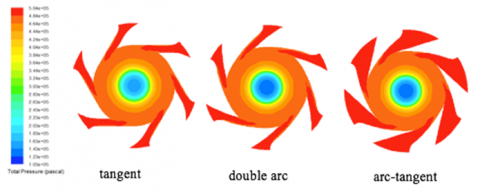
Keeping the η at 0.3 and taking the nozzle shape for tangent, double arc and arc-tangent with other conditions remaining unchanged, the Mach number and the distribution of total pressure on the cross section of the vortex chamber are shown in Figures 23 and 24. This shows that the Mach number has improved, and a high Mach number area becomes significantly larger with the nozzle shape of double arcs and arc-tangent. At the same time, it can be found that the pressure gradient direction changed obviously at the throat, with more joint movement in the direction of a cyclone. But there is an obvious loss of total pressure compared to the other two groups for the area near the outer arc with a double arc.
Figure 23. Mach number nephogram on the vortex chamber cross-section under the different nozzle shapes
Figure 24. Total pressure nephogram on the vortex chamber cross-section under the different nozzle shapes
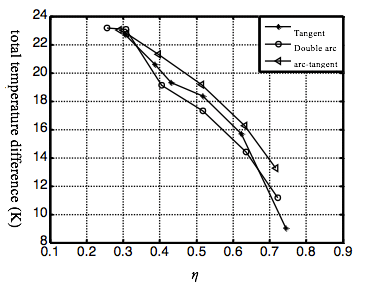
Figure 25. Effect of different nozzle shapes on total temperature difference between cold outlet and inlet
Figure 26. Effect of different nozzle shapes on refrigerating efficiency
As shown in Figures 25 and 26, the total temperature difference and refrigerating efficiency respectively with different η is given using the above three kinds of nozzle shapes. When η is small (0.3), the difference in temperature difference and refrigeration efficiency obtained under three kinds of nozzle shapes is smaller. When η > 0.4, the difference tends to be stable, and the arc-tangent is best, which has a good linear relationship of refrigerating performance with η, and the better type of tangent is double arc.
5.3 The influence of the cold hole diameter on the refrigeration performance
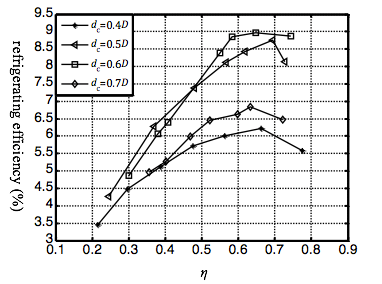
The cold hole plays a signicant role in pressure distribution A small hole diameter will cause more losses of kinetic energy and more resistance in the process of cold outflow So, under the same η, a larger hole can obtain a greater pressure difference between the cold reflux and hot gas, which is more conducive to the increase of the temperature difference. However, too large a cold hole can lead to anthe occurrence of a short circuit flow and an increase in the short circuit flow, which greatly reduces the refrigerating efficiency.
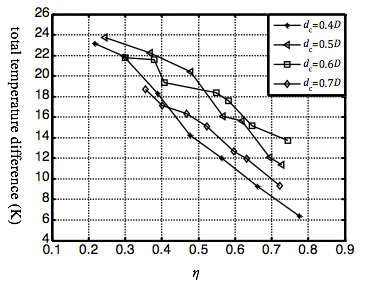
Figure 27. Effect of cold hole diameter on total temperature difference between cold outlet and inlet
Figure 28. Effect of cold hole diameter on refrigerating efficiency
Figures 27 and 28 illustrate the relation of the total temperature difference and refrigerating efficiency with the η. Based on the vortex tube model of the previous section and using the arc-tangent nozzle while only changing the cold hole diameter, cold hole diameter values were 0.4D、0.5D、0.6D and 0.7D. As a whole, 0.5D and 0.6D surpass 0.4D and 0.7D on total temperature difference and refrigerating efficiency significantly, and the maximum increase is 6 K and 3%. In order to obtain a better total temperature difference and refrigerating efficiency, when η < 0.5, the cold hole diameter can be defined as 0.5D, and the cold hole diameter taking 0.6 D is more appropriate with η> 0.5.
(1) In the vortex chamber the gas turns into a rotational flow which has high kinetic energy and low static temperature, through a adiabatic constant enthalpy process, and a higher tangential velocity is beneficial for intense separation of the substance and energy.
(2) The main reasons for the total temperature difference is the special flow and pressure field distribution in the hot tube. An almost smaller constant static pressure heating process is carried out in the area with no reflux, and there is radial heat transfer and the radial and tangential exchange of energy and work.
(3) The cold gas is generated from the refluent of the hot tube. As a polytropic process, the gas undergoes a decompressional expansion process and achieves a minimum static temperature at the cold hole. Reducing the energy loss of the cold gas in the cold tube is beneficial to prevent increasing static temperature and improves the capability of refrigeration.
(4) In order to obtain a better total temperature difference and refrigerating efficiency, Dv/D and nozzle shape can be defined as 1.5~1.6 and arc-tangent respectively. When η < 0.5, the cold hole diameter is 0.5D, and the cold hole diameter of 0.6D is more appropriate when η> 0.5.
This study was supported by the Natural Science Foundation of China (51309147 and 51249001) and Project of Shandong Province Higher Educational Science and Technology Program (J11LD22).
[1] Rafiee, S., Sadeghiazad, M., “Heat and mass transfer between cold and hot vortex cores inside ranque-hilsch vortex tube-optimization of hot tube length.” International Journal of Heat & Technology, vol. 34, no. 1, pp. 31-38, 2016. DOI: 10.18280/ijht.340105.
[2] Cao Y., Wu J.F., Luo E.C., et al, “Evolution and evaluation of research in vortex,” Cryogenics, vol. 6, pp. 1-5, 2001. (in Chinese) DOI: 10.3969/j.issn.1000-6516.2001.06.001.
[3] Wang P.T., Jiang R.Q., Song F.Y., et al, “Exergy analysis on the performance of vortex tube,” Cryogenics & Superconductivity, vol. 34, no. 4, pp. 263-267, 2006. (in Chinese) DOI: 10.3969/j.issn.1001-7100.2006.04.008.
[4] Wang P.T., Jiang R.Q., Song F.Y., et al, “The thermodynamics model of energy separation process in vortex tube,” Cryogenics & Superconductivity, vol. 34, no. 5, pp. 341-345, 2006. (in Chinese) DOI: 10.3969/j.issn.1001-7100.2006.05.007.
[5] Xu M.Y., Zhang J.S., Lei L., et al, “Research on Experiment of Vortex Tube,” Fluid Machinery, vol. 39, no. 5, pp. 78-80, 2011. (in Chinese) DOI: 10.3969/j.issn.1005-0329.2011.05.018.
[6] Zhou S.W., Jiang R.Q., Song F.Y., et al, “Numerical simulation of flow field and heat transfer within a vortex tube,” Journal of Chemical Industry and Engineering, vol. 57, no. 7, pp. 1548-1552, 2006. (in Chinese) DOI: 10.3321/j.issn:0438-1157.2006.07.009.
[7] Khazaei H., Teymourtash A.R., Malek-Jafarian M., “Effects of gas properties and geometrical parameters on performance of a vortex tube,” Scientia Iranica, vol. 19, no. 3, pp. 454-462, 2012. DOI: 10.1016/j.scient.2012.03.003.
[8] Rafiee, S. E., & Rahimi, M., “Experimental study and three-dimensional (3d) computational fluid dynamics (CFD) analysis on the effect of the convergence ratio, pressure inlet and number of nozzle intake on vortex tube performance–validation and cfd optimization,” Energy, vol. 63, no. 3, pp. 195-204, 2013. DOI: 10.1016/j.energy.2013.09.060.
[9] Sinhamahapatra K.P., Dutta T., Bandyopdhyay S.S., “Comparison of different turbulence models in predicting the temperature separation in a Ranque-Hilsch vortex tube,” International Journal of Refrigeration, vol. 33, no. 4, pp. 783-792, 2010. DOI: 10.1016/j.ijrefrig.2009.12.014.
[10] Bramo A.R., Pourmahmoud N., “Computational fluid dynamics simulation of length to diameter ratio effects on the energy separation in a vortex tube,” Thermal Science, vol. 15, no. 3, pp. 833-848, 2011. DOI: 10.2298/TSCI101004008B.
[11] Bounaouara H., Ettouati H., Ben Ticha H., et al, “Numerical simulation of gas-particles two phase flow in pipe of complex geometry: pneumatic conveying of olive cake particles toward a dust burner,” International Journal of Heat and Technology, vol. 33, no. 1, pp. 99-106, 2015. DOI: 10.18280/ijht.330114.
[12] He S., Guo J., Wu Y.T., et al, “Effect of the rectification on the energy separation performance of the vortex tube,” Journal of Refrigeration, vol. 27, no. 1, pp. 38-41, 2006. (in Chinese) DOI: 10.3969/j.issn.0253-4339.2006.01.007.
[13] Zhou S.W., Jiang R.Q., Song F.Y., et al, “Of inlet pressure and cold air fraction on the refrigerating performance of a vortex tube,” Journal of Basic Science and Engineering, vol. 14, no. 4, pp. 543-549, 2007. (in Chinese) DOI: 10.3969/j.issn.1005-0930.2006.04.012.