OPEN ACCESS
The data processing centers (CED) are defined today among the areas with the greatest demand for energy for specific use, and for the intrinsic operation of the technological equipment of processing and the data transmission. As a result of the high diffusion of today’s telecommunications systems, the CEDs are increasingly widely disseminated and characterized by logics of operation, such as to ensure a high level of reliability in terms of continuity of service. Objective of the proposed study is to evaluate the reduction of demand energy by cooling, through implementation of air conditioning technologies based on air-conditioning systems of free-cooling type. The study compares different operating scenarios in relation to hypothetical operating conditions, in different regions of Italy characterized by different environmental thermo-hygrometric conditions, highlighting the limiting factors in terms of energy demand.
Data Processing Centres, CED, Energy Emission Analysis, Air-conditioning systems, free-cooling.
The growth of energy consumption by servers and “data centers” in the world is increasing. It is estimated by now that, this sector, represents 1% of all energy request; this causes a justified alarm about its availability and for future use.
As an example, in the US, it is estimated that in 2006 this sector accounted for 61 billion kWh, or 1.5% of the electricity that was used in the entire country.
It is estimated that the consumption of the “data centers”, will increase by 15% per year. About the 50% of this request, is due to cooling systems (air conditioning of server rooms and data centers) and because of energy electricity losses related to the distribution and transformation [1, 10].
In the “Data Centers” there are three major components that contribute to the increased use of energy:
Firstly, IT equipment (servers, computers, etc.), Secondary, Cooling unit, and electrical distribution systems (transformers, lines, and thirdly, the systems conversion AC/DC power).
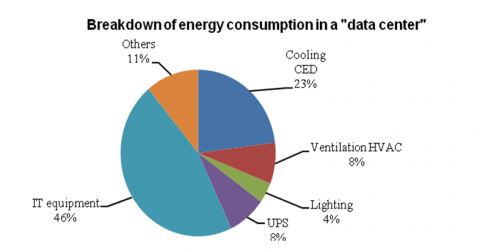
In a study, performed by the LNNL, (Lawrence Barkley National Laboratory) examining 12 “Data Centers”, it was established that the energy consumption of cooling equipment, represents an average of 23% of total demand, and that the system of ventilation represents 8% (see Fig.1).
The cooling systems use 31% of total “data center” energy consumption. This value is an average value between 20% of the plants at high efficiency, and 54% of less efficient plants.
The other forms of individual energy requirements, are given by the UPS that use 8%, and by lighting that represent 4%.
The hourly load profile gradually increases from 5:00 am, to 11:00 am, then remain constant for some time, then decrease at 17:00.
However, the requirement of energy by the servers remain relatively high even when the load decreases.
In fact, it is estimated that a “data center”, in running at 20% load, can use 80% of the energy that it would use if it worked at full load.
Figure 1. Breakdown of energy consumption in a “data center”
To assess the energy efficiency of a data center is a complex operation.
Internationally, in 2010 the four actors who deal with energy efficiency in the “data centers”, namely EPA (Environment Protection Agency) with the Energy Star program, the European Union with its code of conduct, and the Japanese agency for the promotion of Green iT and Green Grid, came together to agree on a common policy.
The priority has been to identify the common index to define the energy efficiency, and evaluating the useful work output of the CED in relation to the energy consumed [11, 12]. The choice has been on the index PUE (Power Usage Effectiveness), which assesses the efficiency of the CED by comparing the electric power absorbed by various equipment, and its inverse DCIE (Data Center Infrastructure Efficiency).
The PUE is defined as follows:
PUE = Total power/Power IT
Power IT: means the sum of the power absorbed by IT Equipment (servers, storage devices and network, PCs, monitors printers, etc);
Power Total: means the total power introduced, including auxiliary systems, power, cooling and IT equipment.
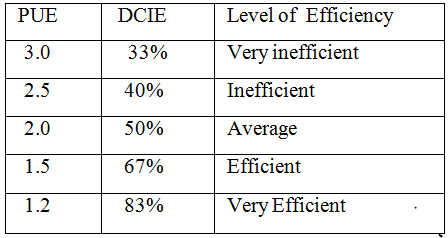
In Table 1 shows the values of the different categories of PUE. For example, a PUE equal to 3 indicates that the power required by IT tools is approximately a third of that input.
The ideal value of PUE is evidently equal to 1, which would correspond to an “energy efficiency of 100%.
A good energy efficiency you would get, roughly in with values of PUE including by 1.2 to 1.5, the value currently achieved by “server farm” like that of Google is (PUE = 1.2).
Its reciprocal “data center infrastructure efficiency” (DCIE) is:
DCIE = 1/PUE = (Power IT/Total Power) x 100%
Table 1. Values of the PUE and DCIE
To evaluate, the energy efficiency calculations of the CED, is fundamental to define which energies constitute the load IT, and the energy it is related to the physical infrastructure. As was mentioned earlier, the servers, and the storage devices are valued within the IT load while the UPS and the cooling units for the air treatment such as physical infrastructure (Fig.2).
In 2008, and then with an integrative review in 2011, the ASHRAE has defined four different environmental classes (A1, A2, A3, A4), in relation to the range of values by temperature and humidity, inside the data centers (see Table 2).
The Class A1 is characterized by more stringent environmental controls while the A4 class is characterized by a more careful monitoring of environmental meteorological.
Table 2. The ASHRAE definitions of environmental classes in function of the temperature and humidity value
Fig.2 shows the graph ASHRAE that uses the data of the previous table.
Figure 2. ASHRAE classes of data
The ASHRAE 2011, for the A1 and A2 classes preserves the definitions from 2008.
Were instead it added the classes A3 and A4 that less enable the use, of refrigeration equipment “free-cooled”.
As shown in Table 1, the recommended operating range is the same for all classes.
The traditional free-cooling is accomplished by withdrawing the air completely from the outside when this is energetically cheaper respect compare to the treating the air mixed.
First you need to understand, when the free-cooling is actually cheaper.
The following considerations apply: to control the conditions of an environment it is necessary to exchange both sensible heat (to regulate temperature) which latent heat (to adjust the specific and relative humidity).
The relative humidity control is only essential
to prevent the value exceeding a maximum level, above which there would no longer be the conditions for environmental health.
Without these two right premises, it can be said that, in general, a “free-cooling” system is energetically efficient when the outside air has an enthalpy lower than that of indoor air.
This is true as long as there is no need to exchange both sensible heat which latent heat; when instead there is only sensible heat exchange. As a further constraint, the outside air temperature it must be lower than the ambient air temperature.
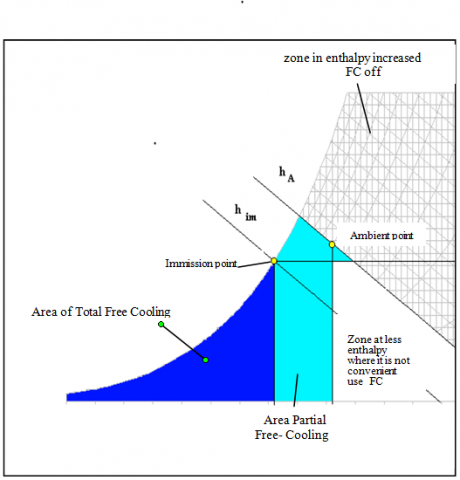
These concepts are perfectly summarized in Fig.3 in which are shown on the diagram ASHRAE. The areas for the convenience of the use of free-cooling.
Figure 3. Diagram ASHRAE with areas of convenience for the use of free-cooling
As can be seen, if the outside air have a temperature and a enthalpy lower than those of the theoretical release point, the entire cooling load is guaranteed in a free way with the immission of external air, according to the logic the adjustment described below.
This has what is commonly called Free-Cooling Total (blue area).
When the outside air have has the value of the enthalpy lower to that of air input, but with a higher temperature, it enters the area of the partial free-cooling (blue area).
The outside air, by itself is unable to dispose of the totality of the sensible load, but only a fraction of this, because its temperature is greater than that necessary to maintain desired conditions of the environment.
Therefore, it is necessary that the remaining part of the sensible load is supplied from the cold battery, fed by chilled water produced by a refrigeration unit, as described below by adjustment logics.
However, there is an energy saving inversely proportional to the difference between outside air temperature and input air temperature theoretical.
The area of the partial “free-cooling” comprises all points which have values of enthalpy and temperature lower than the ambient air.
The two conditions must always verify together.
The outside air may indeed have lower enthalpy to the ambient air, but a higher temperature.
This is because the outdoor air specific humidity value is low, and is always lower than the specific humidity value of the input point.
In these conditions the latent heat exchange is not decisive, since the relative humidity is already below the maximum allowed value.
In contrast, the sensitive power demand to the cold battery to decrease the temperature from the outside air value to that of the injection will always be greater than that required to treat the mixture of air.
In this case there is always a value lower than the outside air temperature, whatever the percentage of recirculated air.
If the outside air is located in a point with temperature and enthalpy inferior to those of the environment.
But with higher humidity specific, the free-cooling is always convenient, although the battery is also requires latent heat exchange, as well as the heat sensible, to bring the outside air at the input conditions.
The present activity is it intended for the elaboration data processing in the field of computer telecommunications which are located in central Italy.
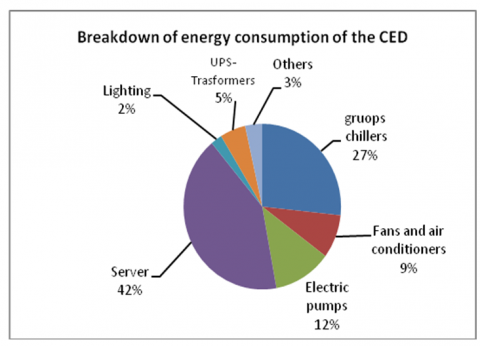
The only energy source which has served the structure is represented by electrical energy with a demand of 10,050 MW total electricity (see Fig.4).
The increased energy demand is attributable to IT users and Server (4200 MWh) with a 42% incidence on the total value.
The internal temperature is maintained at a value of not more than 26 ° C, and the relative humidity can range from 80% to 20%.
Within the ranges ranges of the parameters of thermo-hygrometrics operative, the CED is configured of class A1 according to the ASHRAE parameters.
The plant consists of conditioning machines of the type “closet” hydronic, they are fed by a series of refrigeration units to electric compression of steam.
The heat transfer fluid is transported via dedicated circuits, in the refrigeration machinery up to the terminals inside.
The air conditioning system, is not equipped with air conditioning systems of “free-cooling” type.
There are not air handling unit for the first input of the air inside.
The CED operates continuously, without interruption, for the full year. Value of PUE, in terms of annual overall energy performance, is of 2.39.
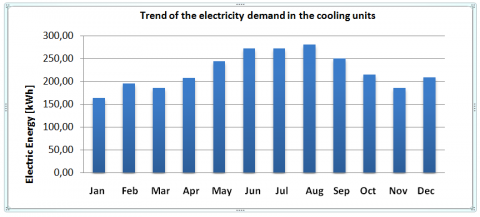
Fig.5 shows the graph of the electricity energy requirement of the chillers groups. Fig.6 shows the trend of the electrical power required in the cooling units.
The total annually energy demand is 5,742 MWhe; the minimum power required value for the refrigeration is 470 kWe in the January.
Figure 4. Breakdown of energy consumption of the CED
The maximum load of electrical power is required in August, with a value of 809 kWe.
It’s shown as the pattern of the electric power demand for the refrigeration equipment is sensitive at increase the condensation outdoor air temperature, due to the reduction of the energy performance (EER) of the refrigerating machine.
A further contribution, which entails an increase in energy demand is due to the greater thermal load as a result of solar radiation and to the greater thermal transmission through the building envelope.
This contribution, at following the thermo-physical characteristics of the building, is less important respect the reduction of the refrigerating machine performance, discussed in the previous point.
Figure 5. Trend of the electricity demand in the cooling units
Figure 6. Trend of the electrical power required in the cooling units
The proposed intervention is related to the implementation of a “free-cooling” system, consisting of an air handling unit with activation only when the outside air temperature value is lower than 16 ° C.
This temperature represent, for the entire year of operation, the minimum condition for the maintenance of the internal operating temperature.
The electric power of the fans (outlet fan and extraction) is 8 kWe.
It was assumed, without prejudice to the maintenance of the electricity demand of the servers and IT equipment, to evaluate the intervention, as well as in central Italy, also in the north and the south of Italy, in order to understand which is the contribution in terms of the energy saving of different environmental conditions.
Fig.7 shows the demand for electrical energy following the intervention of creation of a “free-cooling” system.
The chart compares, for the different cities under review, the trend of the demand for energy of the status quo, with the demands of the new situation after the introduction of “free-cooling” system.
The energy-saving value for the air conditioning is greater if it is realized in the city of Milan, as a result of environmental conditions characterized by cold temperatures ( energy savings for air conditioning: 50%)
Less saving is realized instead if it was performed in Catania (energy savings for air conditioning: 21%).
In the case it is realized in Rome, the operation allow an energy saving of 36%.
The values of energy required, after the new scenarios include the contribution of energy requirement for the air treatment, request by electric motor of the fans inlet and air extraction of the “free-cooling” system.
The proposed intervention has important repercussions on the energy efficiency as it allows to reduce the value of the PUE by 2.39 by passing from value (state of affairs), 2.04 (Milan), 2.14 (Roma) and 2.24 (Catania).
Figure 7. Electricity following the intervention of the “free-cooling” system
The study has highlighted as in the case of the air conditioning of data centers environments, the analyzed geographical areas, the free-cooling can always be convenient in each case, in spite this results in an increase of energy for the electric motors of fans.
It is noted as in the case of the winter months, for the scenario concerning the city of Milan, is possible to cancel totally the demand of cooling energy of the refrigerator group.
Therefore it is found as the greater the latitude and as greater is the energy savings achievable due to the lower levels of the outdoor air temperature.
The reduction of the energy demand for the air conditioning, leads in a reduction of the PUE, and then an overall energy efficiency improvement of the CED and air pollution [13, 22].
Particular attention should be paid to air filtration because the high volumes of air introduced into the environment, could result in a damage of the deposits of dust on the electronic equipment. In the case of existing data centers, exist the essential requirement of continuity of the same operating system.
Sometimes could result, that the realization of the installation works of the free-cooling system, can create some problems regarding the continuity and the operation of the system. This issue, in phase of technical feasibility, should be evaluated.
[1] “Impianti di condizionamento per server e data center”, A. Briganti-Tecniche Nuove, 2009.
[2] Definizione di algoritmi e indicatori per l’efficientamento dei centri di elaborazione dati (CED), Marta Chinnici, Andrea Quintiliani, ENEA Report RdS/2011/32.
[3] Marina Vio: “Il free-cooling diretto”,– Condizionamento dell’aria, Aprile 2003 Marta Chinnici, Andrea Quintiliani, ENEA Report RdS/2011/32.
[4] Decreto legislativo 3 marzo 2011, no. 28, Attuazione della direttiva 2009/28/CE sulla promozione dell’uso dell’energia da fonti rinnovabili, recante modifica e successiva abrogazione delle direttive 2001/77/CE e 2003/30/CE (GU n.71 del 28-3-2011).
[5] Decreto legislativo 4 luglio 2014, no. 102, Attuazione della direttiva 2012/27/UE sull’efficienza energetica, che modifica le direttive 2009/125/CE e 2010/30/UE e le direttive 2004/8/CE 2006/32/CE (GU n.165, 18-7-2014).
[6] AA.VV, ENEA-Regione Lombardia “Elementi di linee guida per la promozione dei sistemi di teleriscaldamento”, marzo 2001.
[7] AA.VV: United Nations Environment Programme 2006, Energy Efficiency Guide for Industry in Asia, “Thermal Energy Equipment: Waste Heat Recovery”.
[8] “Commission Staff Working Document, Guidance note on Directive 2012/27/EU on energy efficiency, amending Directives 2009/125/EC and 2010/30/EC, and repealing Directives 2004/8/EC and 2006/32/EC”, - Commission Guidance, SWD (2013) 449, nov. 2013.
[9] M6 - Energy Distribution: “District Heating and Cooling, Intelligent Energy Europe”, UP-RES (Urban Planners with Renewable Energy Skills) Project, slides del modulo.
[10] Energy Charter Secretariat, “Cogeneration and district heating best practices for municipalities”, Energy Efficiency and Related Environmental Aspects (PEEREA), 2006.
[11] AA.VV., GSE “I Certificati Bianchi, stato dell’arte”, Convegno Federesco, Roma, 6/2014.
[12] Renato Lazzarin and Marco Noro, Riscaldamento locale o teleriscaldamento, Confronto energetico, ambientale ed economico,” Atti Convegno AICARR, Jun. 2003
[13] G. Cannistraro, M. Cannistraro and R. Restivo, “Some observations on the radiative exchanges influence on Thermal comfort in rectangular open-space environments,” International Journal of Heat & Technology, vol. 33, pp. 79-84, 2015. DOI: 10.18280/ijht.330213.
[14] G. Cannistraro, M. Cannistraro and R. Restivo, “The local media radiant temperature for the calculation of comfort in areas characterized by radiant surfaces,” International Journal of Heat & Technology, pp. 115-122, 2015. DOI: 10.18280/ijht.330116.
[15] M. Cannistraro, G. Cannistraro A. Piccolo and R. Restivo, “Potential and limits of oxidative photocatalyses and possible applications in the field of cultural heritage,” Advanced Materials Research, vol. 787, pp. 111-117, 2013.
[16] G. Cannistraro, M. Cannistraro, A. Cannistraro, A. Galvagno and G. Trovato, “Evaluation of the convenience of a citizen service district heating for residential use. A new scenario introduced by high efficiency energy system,” International Journal of Heat & Technology, vol. 33, no. 4, pp.167, 172, 2015. DOI: 10.18280/ijht.330421.
[17] G. Cannistraro, M. Cannistraro and R. Restivo, “Messina’s historical buildings after the earthquake of 1908: energy and environmental analysis through a global screening methodology,” International Journal of Heat & Technology, vol. 31, no. 2, pp. 155, 158, 2013. DOI: 10.18280/ijht.310221.
[18] G. Cannistraro, M. Cannistraro, A. Galvagno and G. Trovato, “Preliminary design study of a CHP plant in service for a hotel accommodation,” in WSEAS, Venice 29-31, January. 2016
[19] G. Cannistraro and M. Cannistraro, “Hypothermia risk, monitoring and environment control in operating rooms,” International Journal of Heat & Technology, vol. 34, no. 2, pp. 165, 171. June 2016. DOI: 10.18280/ijht.340202.
[20] G. Cannistraro, A. Cannistraro M. Cannistraro, A. Galvagno and G. Trovato, “Analysis of the air pollution in the urban center of four sicilian cities,” Special Issue Congress AIGE-IIETA 2016, Naples 9-11 June 2016, to be published.
[21] G. Cannistraro, M. Cannistraro, A. Galvagno and G. Trovato, “Evaluation Technical and economic the integrations of co-trigeneration systems in the dairy industry,” Special Issue Congress AIGE-IIETA 2016, Naples 9-11 June 2016, to be published.
[22] G. Cannistraro, M. Cannistraro and A. Cannistraro, “Evaluation of the sound emissions and climate acoustic in proximity of one railway station,” Special Issue Congress AIGE-IIETA 2016, Naples 9-11 June 2016, to be published.