OPEN ACCESS
This paper presents an experimental comparative study on the thermal performance and heat exchange of two single pass solar air heaters models (SAHs); we have proceeded to reversing the flow direction in the solar air heater. Initially, to determine the best performing model and to improve the efficiency factor of the SAH. Secondly, to evaluate the convective heat transfer coefficient of both models, named: N-1 and N-2. The indices (1) and (2) indicate, respectively, that the air was blown up or blown down in the channel duct of the SAH. Therefore, we have compared between the efficiencies, the convective heat transfer coefficient, Nusselt number curves and the distribution of air temperatures in the channel ducts of both solar air heaters. Both collectors were designed, constructed and tested in the University of Biskra (Algeria) in a sta nd facing south at an inclination angle equal to the local latitude. The results show that N-2 model (air blown down) is more efficient than N-1 model (air blown up), and the improvements in the heat exchange due to this technological solution are about 10-20%.
Solar air heaters, Thermal efficiency, Convective heat transfer coefficient, Nusselt.
There are basically two types of solar collectors: non-concentrating or stationary and concentrating. A non-concentrating collector has the same area for intercepting and for absorbing solar radiation, whereas a sun-tracking concentrating solar collector usually has concave reflecting surfaces to intercept and focus the sun’s beam radiation [1].
Solar air heating is a solar thermal technology in which the energy is captured from the sun by an absorbing medium and used to heat air. Among stationary solar heaters, air flat-plate collectors, SAHs, have been widely used for energy conservation and management in an increasing number of installations. They are quite attractive for low-temperature solar energy technology which requires air temperatures below 100°C. In fact, solar air heaters are extensively used over years, because they are relatively simple with a minimal use of materials, and have low capital costs [2, 3].
Solar air heating is a renewable energy heating technology used to heat or condition air for buildings or process heat applications. Heat transfer augmentation techniques have been extensively developed to improve the thermal performance of heat exchanger systems with a view to reducing the size and cost of the systems, the technique has been widely applied in many engineering applications [4]. These techniques was studied for the evaluation of the convective heat coefficient along the air channel duct with different forms of plate fins inserted in the flow channel duct of the SAHs, allowing a complete representation of the temperatures profile of the absorber [5, 6].
Although numerous studies on the SAHs efficiency improvement have been reported by experimental and numerical work for heat transfer mechanism inside [4, 7-10].
Many techniques are presented the heat loss coefficient for many applications such as heating, drying and air conditioning by using solar energy [11-14].
In our laboratories, several theoretical and experimental investigations were carried out on the enhancement of thermal performances of SAHs designed for drying, heating and cooling applications [15-22]. In all these studies, the authors were used different form of obstacles mounted under the absorber plate on the air channel duct.
In the present paper, we have conducted a comparative study between two models of SAHs, differenced by their air flow directions, by comparing between their efficiencies, the curves of the convective heat transfer coefficient and Nusselt number of both solar air heaters.
2.1 Experimental setup
Both solar air heaters are tested in the University of Biskra under similar environmental conditions in the spring of 2012. Biskra is located in the East of Algeria with latitude of 34°48' N, longitude of 5°44’E and Altitude of 85m. The collectors are placed on a stand facing south at an inclination angle equal to the local latitude.
The air outlet and inlet cross-sections are equipped by divergent channel duct, the test facility permit to vary the mass flow rate of the air. In summary, the above experimental setup was instrumented for the measurement of the solar radiation intensity, wind velocity, pressure drop, temperature of the atmosphere air, inlet and outlet air temperatures, surface temperature of the absorber plate and the temperature at different points in the air flow channel.
To carry out these experiments, K-type thermocouples with an accuracy 0.1 °C, Kimo type anemometer with hot wire (VT300) with an accuracy ±3% of reading and ±0.1 m/s for velocity, pressure transducer (Kimo CP301) with an accuracy ±1Pa and 0.5% of reading, Kipp and Zonen pyranometer CM 11 with 1% accuracy, are used.
The materials used in the fabrication of both SAHs components are the same. The absorbers are made of galvanized steel with non-selective black coating. The heated air flows between the inner surface of the absorber plate and the back plate. The rear insulation is made of polystyrene sheet (30mm of thickness), which is sandwiched between two plywood sheets of 5 mm each.
Both collectors components have the same size: thickness of the single cover glass (5mm), height of the air gap between the cover and the absorber plat (25mm), height of the air duct (25mm), dimensions of the absorber (1.96m×0.9m with the thickness of 0.4mm) and thickness of the rear insulation (40 mm).
In figure 1, we present a schematic view of both studied SAHs models; I) N-1model is a simple pass SAH without obstacles, the air flow is blown up from the lower entrance to the upper exhaust and II) N-2 model is a simple pass SAH without obstacles, and the air flow is blown down from the upper entrance to the lower exhaust.
Figure 1. Experimental devices
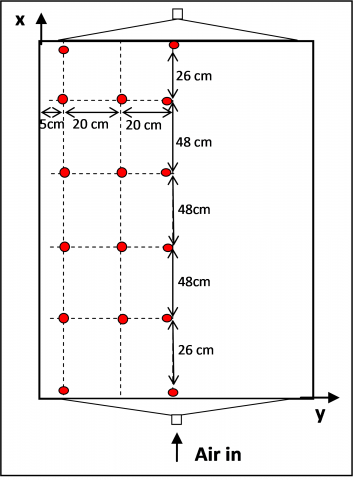
Figure 2. Points of measurement of the temperatures in the air flow channel duct
The air temperatures readings are based on a simple mesh, each temperature value is measured at half height point (z=e/2), five (05) intervals following the flow direction axis (x) (small mesh sections at the entrance and exit, and wide sections in the middle of the collector) and three intervals on the half-width of air channel duct perpendicular to the flow direction (y) (by considering that the air temperature is symmetric). The temperature values are recorded according to the points shown in the following illustration (Fig. 2).
2.2. Experimental analysis
The useful energy gain had been established as below [2]:
$Q_{u}=\dot{m} \cdot c p\left(T_{f, \text {out}}-T_{f, \text {in}}\right)$ (1)
$Q_{u}=\left(\tau_{v} \alpha_{a b s}\right) A_{c} I_{G}-U_{L} A_{c}\left(T_{n}-T_{a}\right)$ (2)
The instantaneous collector efficiency relates the useful energy to the total radiation incident on the collector surface by Eq. (3).
$\eta=\frac{Q_{u}}{A_{c} I_{G}}=\frac{\dot{m} c p\left(T_{f, o u t}-T_{f, i n}\right)}{A_{c} I_{G}}$ (3)
We describe the heat transfer between the fluid and the absorber by a local heat coefficient hx, the heat flux by convection from the absorber-plate to this fluid element is given as [2, 5]:
$Q u=H_{f} \cdot A_{c}\left(T_{n}-T_{f}\right)=\dot{m} \cdot C p \cdot\left(T_{f, o u t}-T_{f, i n}\right)$ (4)
and the local heat flux by:
$Q u(x)=h(x) \cdot\left(T_{n}(x)-T_{f}(x)\right)$ (5)
whence, the average heat coefficient can be given by:
$H_{f}=\frac{\dot{m} \cdot C p \cdot\left(T_{f, o u t}-T_{f, i n}\right)}{A_{c} \cdot\left(T_{n}-T_{f}\right)}$ (6)
where Tn is the superficial absorber temperature in x-point, taken as an average along the absorber width l.
That is to say:
$d q=Q u(x) / d x d t$ (7)
The coefficient (h) depends on the nature of the fluid flow and the quality of contact between the absorber-plate and the air. It also depends on the mean temperature of fluid (Tf ) and on the absorber-plate temperature, thus giving:
$\frac{d T_{f}}{d t}+U \frac{d T_{f}}{d x}=\frac{h_{x} \cdot\left(T_{n}(x)-T_{f}(x)\right)}{e . \rho \cdot C p}$ (8)
In the steady state regime when the collector reaches its thermal balance, we can write:
$\frac{d T_{f}}{d t}=0$ (9)
Consequently, the local heat transfer coefficients are evaluated at a given position by the relationship:
$h(x)=\frac{e . U \cdot \rho \cdot C p \cdot \frac{d T_{f}(x)}{d x}}{T_{n}(x)-T_{f}(x)}$ (10)
The local and the average Nusselt number can be writen as:
$N u(x)=\frac{h_{x} \cdot x}{\lambda}$ (11)
$\overline{N u}=\frac{H_{f} \cdot D_{H}}{\lambda}$ (12)
3.1 Evaluation of the SAHs performances at a fixed air flow rate
Field tests of the SAHs were carried out in the spring 2012, and the typical results are shown in Figs. 3–8
Environmental conditions are presented in the form of graphs that describe the ambient temperature and the global hourly insulation of the characteristic day, which we have determined by using the collector inclination angle value (34.5◦). The recorded values of these two important parameters can be seen in Figure 3.
We also, present a comparison between the recorded results of the outlet and the absorber plate temperatures of both models (N-1 and N-2) with the air flow rate of 80m3/h.
As can be seen in Fig.3, the recorded outlet temperature values of the air are substantially higher in the case of model N-2 during all hours of testing days, while the contrary occurs for the absorbers temperature values so that, the temperature values of the absorber plate of model N-1 are higher in comparison with that of N-2 model.
Figure 3. Recorded values of solar radiation, ambient, outlet and absorber plate temperature values during a typical day of the SAHs testing (02/05/2012), Qv=80m3/h.
3.2 Thermal efficiencies at different air flow rates
The basic method of measuring collector performance is to expose operating collector to the solar radiation and measure the fluid inlet and outlet temperatures, the fluid flow rate, the solar radiation on the collector, ambient temperature, and wind speed are also recorded. ASHRAE standard requires that, for the collector efficiency test, the solar insulation must be above 630 W/m2 [24]. The variation of the efficiency (η) is studied as a function of variation in the air flow rate (Fig. 4). It should be noted that the collector efficiency increases considerably with increasing air flow rate. Furthermore, inversing the air flow direction in the SAH channel duct is a good technological solution to improve the thermal performances of SAHs, it is found that N-2 model (air blown down) is more efficient than N-1 model (air blown up), and the improvements of thermal performances are important due to the conversion of air flow direction from (blown up) to (blown down) in the channel duct of the SAH.
Figure 4. Efficiencies Vs air flow rates [m3/h]
3.3 Temperatures distribution
To get an idea of the air temperature distribution in the flow channel for different air flow rates, we installed 16 thermocouples in half-width of the air duct (by considering that the distribution is symmetric).
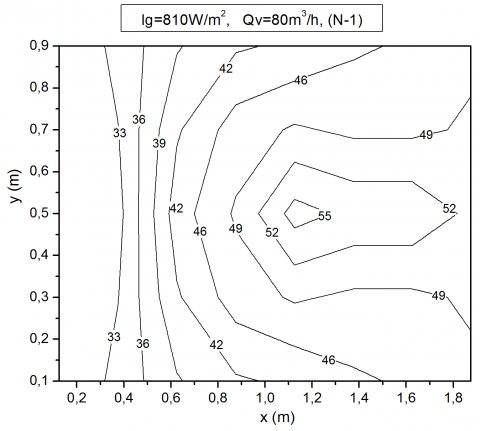
The temperature distribution is obtained by the reading in the experiment points presented in Fig. 2. The Figures 5 and 6 show the contours of the temperature distribution of the air in the channel ducts of both models N-1 and N-2, for air flow rate equal to 80m3/h and for solar intensity Ig equal to 810 W/m2.
It can be seen that the temperature distribution is not the same, neither at the entrance or the middle, nor at the outlet of the channel duct of both SAHs.
The distribution of air temperature along the solar air heater channel shows an increase tendency with the increment of x (where x is the location of thermocouples starting from the entry of test section). The maximum values of T are obtained in the middle of the collector at a distance x= 1.2-1.4m for both SAHs, a slight decrease of the temperature occurred (in the middle of the collector) beyond x=1.4m due to the exit effect.
By comparing between the temperature contours of both SAHs (Figs. 5 and 6), it is notable that the air temperature values along the channel duct of model N-2 are higher than that of model N-2.
Figure 5. Air temperature distribution in the flow channel duct of model N1
Figure 6. Air temperature distribution in the flow channel duct of model N2
3.4 Variation of the convective heat transfer coefficient
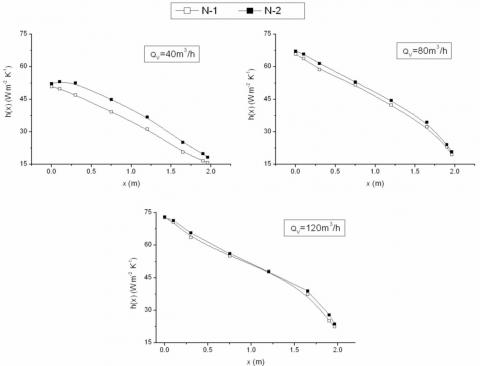
The results obtained from measurements of air temperatures along the collector length, and the calculations of the convective heat transfer factor (hf (x)) (Qv = 40m3 / h), show that this factor decreases from the entry to the output of the SAH and it reaches its maximum value at a distance x = 25cm. This leads to the following conclusion: The heat transfer between the air and the absorber is more important at the distance (x) equal to 0.25 m from the entrance of the SAH corresponding to 13% of the total length, and beyond this distance it begins to decrease.
For flow rates greater than 40m3/h (Qv=80 and 120m3/h), we see a change in the pace of the previous curves; the exchange ratio has the highest value at the entrance of the SAH, then it starts to decrease sharply. This change is probably due to changes in the flow regime (Fig. 7); with low air flows (40m3/h), the boundary layers develop over a rather important length starting from the inlet of the SAHs, and the flow is quasi-uniform across each section, in particular towards the exit of the collector. On the other hand, for the great flows (> 80 m3/hm2), the flow is turbulent upon the entry of the collector, which would increase the Nusselt number in this zone.
Figure 7. Variation of the convective heat transfer coefficient according to the SAH length for various flows
3.5 Variation of the Nusselt number
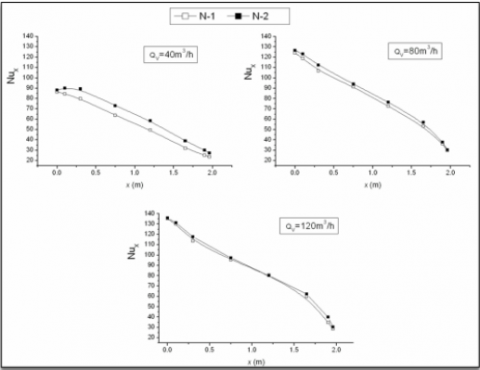
The examination of the Figure 8 curves, representing the Nusselt number values along the SAH for different air flow rates, highlights the effect of the direction of air entrance into the SAH. This is as illustrated, two types of curves, the first type corresponding to a flow rate 40 m3/h, wherein, there is a part with constant Nusselt number on almost 0.25m from the entrance of N-2 model. This may be due to the importance of the natural convection towards of the forced convection when the hot air is blown down. This part is not noticed in the representative curves of N-1 model, but a low slope is noticed in this zone.
For the air flow rates of 80 and 120m3/h, we noted the absence of this range with constant Nu. That is to say that, the Nusselt number records the maximum value from the entrance. Then, it decreases gradually to the exit of the collector. We think that this can be explained by the fact that at high values of flow, we can speak of abrupt contraction zones at the entrance, causing an increase in air velocity (Fig. 8).
We have used the correlation of Kays [5], valid for collector without fins and whose choice is justified by the fact that this correlation extends on all the fields from the Reynolds number, to calculate the Nusselt number. The results obtained are compared with the average results obtained from the experiments undertaken in the case of both SAH models.
The examination of the results, shown in Table 1, makes it possible to say that the conversion of air flow direction from (blown up) to (blown down) in the air channel duct of the SAH increases the convective heat transfer coefficient and consequently the Nusselt number. Indeed, the improvements due to this technological solution are about 10-20%. It should also be noted that the values of measurement results are higher than those calculated from Kays correlation and the empirical correlations don’t take into account the air flow direction.
Table 1. Comparison of the average Nusselt number for various air flow rate
|
Qv [m3/h] |
Re |
$\overline{N u}$ calculated (Empirical correlation) |
N-1 |
N-2 |
|
$\overline{N u}$ |
$\overline{N u}$ |
|||
|
20 |
563 |
2.50 |
4.11 |
5.06 |
|
30 |
844 |
3.46 |
5.63 |
6.81 |
|
40 |
1126 |
4.36 |
7 |
8.06 |
|
80 |
2252 |
7.59 |
10.2 |
12.8 |
|
120 |
3378 |
10.51 |
15.4 |
16.9 |
Figure 8. Variation of the Nusselt number according to the SAH length for various flows
In this study, the temperature profiles of the absorber plate and the air inside and at the exit of the flow channel duct have been determined for two SAHs configurations differenced by their air flow directions: N-1 and N-2. The indices (1) and (2) indicate, respectively, that the air was blown up or blown down in the SAH.
It arises from the recorded values that the thermal efficiency of the SAH increases with the increase in the air flow rate.
Through the experiments undertaken, it can be noted that, the convective heat transfer coefficients as well as Nusselt number are higher when the air is blown down (model N-2). This is explained by the fact that the tendency of hot air particles to move to the top creates perturbations in the flow, and therefore; acquiring the maximum of heat from the absorber plate.
In addition, we notes that the gain provided by the use of this technological solution is more important for low flow rates, and decreases with increasing thereof. Therefore, it is useless to increase the volume flow rate beyond 80m3/h.
|
Ac |
Collector surface area , (m2) |
|
Cp |
Specific heat, (kJ/kg K) |
|
Hf |
Global heat transfer coefficient, (W/K m2) |
|
h(x) |
Local heat transfer coefficient, (W/K m2) |
|
Ig |
Global solar irradiance, (W/m2 ) |
|
Lc |
Length of the SAH (m) |
|
$\dot{m}$ |
Air mass flow rate, (kg s-1) |
|
Nu |
Local Nusselt number (dimensionless) |
|
$\overline{N u}$ |
Average Nusselt number (dimensionless) |
|
Qu |
Useful energy gain, (W) |
|
T |
Temperature, (°C) |
|
Ta |
Ambient temperature, (°C) |
|
Tn |
Absorber Temperature, (°C) |
|
Tf,in |
Inlet temperature, (°C ) |
|
Tf,out |
Outlet temperature, (°C) |
|
$U_{L}$ |
Collector overall heat loss coefficient |
|
Greek symbols |
|
|
$\alpha_{a b s}$ |
Absorptance (dimensionless) |
|
$\beta$ |
Collector tilt (degrees) (dimensionless) |
|
$\tau_{v}$ |
Transparent cover transmittance |
|
$\eta$ |
Thermal efficiency (dimensionless) |
1. S. A. Kalogirou, Solar Thermal Collectors and Applications. Progress in Energy and Combustion Science, 30(3): 231-295, 2004. DOI: 10.1016/j.pecs.2004.02.001.
2. J. A. Duffie and D. Beckman, Solar Engineering of Thermal Processes, Jhon & Wiley & Sons, Inc., Hoboken, New Jersey, USA edn, 908 pp. (4), 2006.
3. Fudholi K. Sopian, M. H. Yazdi, M. H. Ruslan, M. Gabbasa, and H. A. Kazem, Performance Analysis of Solar Drying System for Red Chili, Solar Energy, 99: 47-54, 2014. DOI: 10.1016/j.solener.2013.10.019.
4. Tamna S., Skullong S., Thianpong C. and Promvonge P. (2014), Heat Transfer Behaviors in a Solar Air Heater Channel with Multiple V-Baffle Vortex Generators, Solar Energy, 110, 720-735. DOI: 10.1016/j.solener.2014.10.020.
5. N. Moummi, S. Youcef-Ali, A. Moummi and J. Y. Desmons, Energy Analysis of a Solar Air Collector with Rows of Fins. Renewable Energy, 29(13): 2053-2064, 2004. DOI: 10.1016/j.renene.2003.11.006.
6. N. Moummi, Prévisions Systématiques et Optimisation des Performances des Capteurs Solaires Plans À Air Dans Divers Sites de Climats Méditerranéens ou Sahariens et avec ou sans Altitude, Ph.D. Thesis, University of Valenciennes. France, 1994.
7. R. Karwa, S. C. Solanki and J. S. Saini, Heat Transfer Coefficient and Friction Factor Correlations for the Transitional Flow Regime in Ribroughened Rectangular Ducts. Int. J. Heat Mass Transfer, 42: 1597–1615, 1999. DOI: 10.1016/S0017-9310(98)00252-X.
8. S. Youcef-Ali, N. Moummi, J. Y. Desmons, A. Abene, H. Messaoudi, M. Le Ray, Numerical and Experimental Study of Dryer in Forced Convection. Int. J. Energy Res, 25(6):537–53, 2001. DOI: 10.1002/er.707.
9. P. Promvonge, C. Khanoknaiyakarn, S. Kwankaomeng, C. Thianpong, Thermal Behavior in Solar Air Heater Channel Fitted with Combined Rib and Delta-Winglet, Int. Commun. Heat Mass Transfer. 38: 749–756, 2011. DOI: 10.1016/j.icheatmasstransfer.2011.03.014.
10. A. S. Yadav, J. L. Bhagoria, A CFD Based Thermo- Hydraulic Performance Analysis of an Artificially Roughened Solar Air Heater Having Equilateral Triangular Sectioned Rib Roughness on the Absorber Plate, Int. J. Heat Mass Transfer, 70: 1016–1039, 2014. DOI: 10.1016/j.ijheatmasstransfer.2013.11.074.
11. Z. Chaibi, A. Gonzalez, B. Zeghmati, Modelling of the Mud Drying in a Convective Solar Drying; International Journal of Heat and Technology, 26 (1):65-73, 2008.
12. M. Coppi, A. Quintino, F. Salata, Fluid Dynamic Feasibility Study of Solar Chimney in Residentail Buildings, International Journal of Heat and Technology, 29(1): 1-6, 2011.
13. Bernardo Buonomo, Orazio Manca, Sergio Nardini, Paolo Romano, Thermal and Fluid Dynamic Analysis of Solar ChimneyBuilding Systems, International Journal of Heat and Technology, 31(2): 19-126, 2013.
14. Labed, A. Rouag, A. Benchabane, N. Moummi and M. Zerouali, Applicability of Solar Desiccant Cooling Systems in Algerian Sahara: Experimental Investigation of Flat Plate Collectors, Journal of Applied Engineering Science & Technology, 1(2): 61-69, 2015.
15. Labed, N. Moummi, K. Aoues, M. Zellouf, A. Moummi, Etude Théorique et Expérimentale des Performances d’un Capteur Solaire Plan À Air Muni d’une Nouvelle Forme de Rugosité Artificielle, Revue des Energies Renouvelables, 12: 551-561, 2009.
16. Labed, N. Moummi, A. Benchabane, K. Aoues, A. Moummi, Performance Investigation of Single- and Double-Pass Solar Air Heaters Through the Use of Various Fin Geometries, Int. J. of Sustainable Energy, 31 (6): 423-434, 2012. DOI: 10.1080/14786451.2011.590899.
17. Labed, N. Moummi, A. Benchabane, Experimental Investigation of Various Designs of Solar Flat Plate Collectors: Application for the Drying of Green Chili. J. Renewable & Sustainable Energy 4, 043116, DOI: 10.1063/1.4742337, 2012. DOI: 10.1063/1.4742337, 2012.
18. K. Aoues, N. Moummi, M. Zellouf, A. Benchabane, Thermal Performance Improvement of Solar Air Flat Plate Collector: A Theoretical Analysis and an Experimental Study in Biskra, Algeria, Ambient Energy, 2: 95–102, 2011. DOI: 10.1080/01430750.2011.584469.
19. N. Moummi, A. Moummi, K. Aoues, C. Mahboub, S. Youcef Ali, Systematic forecasts of solar collector’s performance in various sites of different climates in Algeria. International Journal of Sustainable Energy, 29: 142–150, 2010. DOI: 10.1080/14786460903556139.
20. Mahboub, N. Moummi, Calculation of the Glass Cover Temperature and the Top Heat Loss Coefficient for 60 Vee Corrugated Solar Collectors with Single Glazing, Solar Energy, 86(2): 804-808, 2012. DOI: 10.1016/j.solener.2011.11.019.
21. Labed, Etude des Échanges Convectifs en Régime Transitoire dans les Capteurs Solaire: Application au Séchage des Produits Agro-Alimentaires, Doctoral Thesis, University of Biskra. Algeria, 2012.
22. Labed, N. Moummi, K. Aoues, M. Zellouf, Etude Expérimentale des Performances Thermiques et des Pertes de Charges de Différentes Configurations de Capteurs Solaires Plans À Air, 16ème Edition des Journées Internationales de Thermique (JITH 2013), 13- 15 Novembre 2013, Marrakech, Maroc.
23. M. A. Karim, M. N. A. Hawlader, Performance Investigation of Flat Plate, V-Corrugated and Finned Air Collectors, Energy, 31: 452–470, 2006. DOI: 10.1016/j.energy.2005.03.007.
24. M. Daguenet, Les Séchoirs Solaires: Théorie et Pratique, UNESCO, 1985.