OPEN ACCESS
There are many parameters belonging to environmental or subjective kind and influencing thermohygrometric well -being conditions in both living and working places : thermo-hygrometric indexes measurable in the environment directly (Tba, Tbu, φa, va) or analytical ones (Tmr, Top) both give only a superficial and partial assessment of the environmental conditions because they do not take into account subjective evaluation parameters. The heat exchange - in case of sources of radiation marked by a surface temperature such different from the mean value of the remaining surfaces (for example a large glass surface in winter and / or summer conditions) - enhances the feeling of radiative heat exchange with the body surfaces of the exposed subject. The ISO7726 standard "Thermal Environments-Instruments and Methods for Measuring Physical Quantities" has been developed to give guidance on the correct methods to be adopted in the measurement of environmental parameters; this paper presents a study on the influence of radiative exchange on the thermo hygrometric comfort in living and working environments. Two cases will be examined: case "A" with the radiant wall only formed by single wall named "1" from the wall, and case “B” with two radiating walls named “1” and “2”.
Comfort temperature and humidity, Radiative exchanges, Open-Space Environments, ISO7726, Tmr, PMV, PPD.
The thermal comfort conditions in living and working environments can be strongly influenced by the presence of potential sources of radiation, by their relative position to the occupants and by the presence of air conditioning intake vents.
Particularly, a subject located in proximity of a radiating surface, such as a sunny glass surface, is noticeably affected by the thermal flow irradiated from this.
As a result of such exposure radiative fluxes, the average conditions of thermal comfort, during the design phase, cannot not be achieved with consequent degree of dissatisfaction by the occupant subjected to such exposure. The condition of comfort of the other occupants - located at a certain distance from the radiating surfaces - can be easily assessed at a glance by the expression of satisfaction or partial dissatisfaction.
In order to evaluate the effects of radiative exchanges on thermal comfort the present research investigated the conditions of comfort in a work open-space environment, Figure 1, marked by the presence of a continuous glass wall set on the outer side environment exposed to the west (case a) and the two neighboring external sides exposed to the west and south (case b).
The glass surface of the wall, exposed to solar radiation, in specific periods of the year appears as a radiating surface greatly influencing any other occupants comfort situated close to it.
The environmental parameter commonly used to calculate the radiative heat exchange in indoor environments is the mean radiant temperature Tmr.
It is defined as “the temperature of a hollow black sphere enclosing the subject, and exchanging with it the same thermal power exchanged by this with the real environment.
If we assume that the environment surfaces can be considered as black bodies with emissivity coefficient close to one, than the value of the mean radiant temperature Tmr can be calculated as shown in the formula below:
$T_{m r}^{4}=\frac{\sum_{j=1}^{6} T_{j}^{4} \cdot S_{j} \cdot F_{i, j}}{\sum_{j=1}^{6} F_{i, j} S_{j}}$ (1)
While in an internal point of the work environment examined (see Fig.1) the air operating temperature, Top, can be calculated as the average of air temperature ta and the mean radiant temperature Tmr with the formula 2):
$T_{o p}=\frac{\left(T_{a}+T_{m r}\right)}{2}$ (2)
Figure 1. Open workspace points i = 1, ... 16 examined in this work, case a) and b)
These factors configurations Fi,j, for subjects sitting or standing can be calculated trough the graphs of Figs 2/a, 2/b 2/c, 2/d proposed by Fanger in his study on indoor comfort [3], or with the equation 3) given by the same author [1] and adopted by ISO7726, [2].View factors (EN ISO 7726):
Fi,j = Fmax (1- e-(a/c)/τ) (1- e-(b/c)/γ) (3)
τ = A + B · a/c
γ = C + D · b/c + E · a/c
Table 1. Fmax values of the coefficients, A, B, C, D, E - EN-ISO 7726 for various configurations
|
|
Fmax |
A |
B |
C |
D |
E |
|
Person seated, Fig 2 / a Vertical surface: window wall |
0,118 |
1,216 |
0,169 |
0,717 |
0,087 |
0,052 |
|
Person seated, Fig 2 / b Horizontal surface: floor- ceiling |
0,116 |
1,396 |
0,130 |
0,951 |
0,080 |
0,055 |
|
Person standing, Fig 2 / c Vertical surface: window wall |
0,120 |
1,242 |
0,167 |
0,616 |
0,082 |
0,051 |
|
Person standing, Fig 2 / d Horizontal surface: floor- ceiling |
0,116 |
1,595 |
0,128 |
1,226 |
0,046 |
0,044 |
Fig. 2/a Fig. 2/b Fig. 2/c Fig. 2/d
Figure 2. Factors of view Fi,j for seated subjects (Figs. 2/a and 2/b) and standing (Figs. 2/c and 2/d)
In the present study a modification of the formula 1) was introduced.
The new formula is valid for the calculation of the mean radiant temperature, Tmrl, able to take into account both the distance of point from the radiating surface, than the factor of projected area between the subject and radiating surfaces fapi, reported in table 2 [12], [13].
Table 2. Factor of projected area fapi of the subject in.relation to the surfaces
|
Person position |
front/back |
right/left |
high/low |
|
standing |
0,35 |
0,23 |
0,08 |
|
sitting |
0,30 |
0,23 |
0,18 |
The formula proposed below for the calculation of the "local mean radiant temperature", Tmrl, is suggested because the view factors and projected area factors -while taking into account the distance between the generic point of the environment and the radiant walls-are not enough representative of the real local radiative exchanges.
Instead, the formula 4) takes into account the effect of radiative exchanges in presence of sources of radiation, in a most evident way.
$T_{m r l}^{4}=\frac{\sum_{j=1}^{6} T_{j}^{4} \cdot S_{j} / d_{i} \cdot F_{i, j} / f_{a p i}}{\sum_{j=1}^{6} F_{i, j} / f_{a p i} \cdot S_{j} / d_{i}}$ (4)
It features locally these effects far better as evidenced by view factors and projected area factors that tend to mediate such kind of effects in the environment.
With the values of the view factors Fi,j taken from graphs of Fig.2 or provided by equation 3), we have calculate the local mean radiant temperature, Tmrl, and operating air temperatures, Top and then the values of PMV and PPD with the formulas 4) and 2) in specific points of the environment considered and for subjects with the same posture.
The study performed was developed through the following two study cases:
-Case a) Wall "1" of the working space consists of a continuous window facing west, while the other three walls delimiting the environment does not have windows;
- Case b) in addition to the wall "1" wall "2" also presents a continuous window facing south.
In the two case studies, the method assumed an open-space environment, ventilated by air velocity va=0.15 m/sec.
The space taken in consideration is occupied by people having a thermal resistance of clothing equal to 0.75 Clo making activities of 1Met in standing position.
Assessments were carried out taking as glass walls absorption coefficients a=0.6, 0.7 and 0.8, while for the glass surface incident solar radiation the values: I=400, 500, and 600 [W/m2], so typical of the summer period in the Italian resort.
For each configuration exposed, and for the two cases examined, the values of air temperature Ta, the local mean radiant temperatures Tmrl, the predicted mean vote PMV and the percentage of dissatisfied PPD have been calculated in each i-th point of the environment.
The values of air temperature Ta, local mean radiant temperatures Tmrl, the predicted mean vote values PMV, and the percentage of dissatisfied, PPD, for the i-th environment and related to the first case examined are shown in Tables 3/a and 3/b and in Figures 3/a and 3/b.
Table 3/a. Case a) Values of air temperature Ta, local mean radiant temperature Tmrl, PMV and PPD, for subjects Standing,
M = 1,0 Met, Iclo = 0.75 clo, va = 0.15 m/s, I = 500 W/m2 and a = 0.6, 0.7 and 0.8.
|
i-th Points |
1 e 4 |
2 e 3 |
5 e 8 |
6 e 7 |
9 e 12 |
10 e 11 |
13 e 16 |
14 e 15 |
|
Ta |
26,0 |
26,0 |
26,0 |
26,0 |
26,0 |
26,0 |
26,0 |
26,0 |
|
a = 0,6 Tmrl a = 0,7 a = 0,8 |
36,2 38,6 41,1 |
36,3 38,6 41,2 |
30,2 31,3 32,4 |
30,2 31,3 32,5 |
28,6 29,3 30,0 |
28,6 29,3 30,0 |
27,7 28,2 28,7 |
27,7 28,2 28,7 |
|
a = 0,6 PMV a = 0,7 a = 0,8 |
1,83 2,20 2,62 |
1,84 2,22 2,63 |
0,92 1,08 1,25 |
0,92 1,08 1,23 |
0,68 0,78 0,89 |
0,68 0,78 0,89 |
0,56 0,62 0,70 |
0,56 0,62 0,70 |
|
a = 0,6 PPD a = 0,7 a = 0,8 |
69 85 96 |
69 86 96 |
23 29 38 |
23 30 36 |
15 18 22 |
15 18 22 |
11 13 15 |
12 13 15 |
Table 3/b. Case a) Values of air temperature Ta, local mean radiant temperature Tmrl, PMV and PPD, for subjects
|
i-th Points |
1 e 4 |
2 e 3 |
5 e 8 |
6 e 7 |
9 e 12 |
10 e 11 |
13 e 16 |
14 e 15 |
|
Ta |
26,0 |
26,0 |
26,0 |
26,0 |
26,0 |
26,0 |
26,0 |
26,0 |
|
I = 400 Tmrl I = 500 I = 600 |
33,6 36,2 39,1 |
29,1 36,3 39,1 |
29,1 30,2 31,5 |
29,1 30,2, 31,5 |
29,3 28,6 29,4 |
27,9 28,6 29,4 |
27,2 27,7 28,3 |
27,3 27,7 28,3 |
|
I = 400 PMV I = 500 I = 600 |
1,44 1,83 2,28 |
1,44 1,84 2,30 |
0,75 0,92 1,11 |
0,76 0,92 1,12 |
0,58 0,68 0,80 |
0,58 0,68 0,80 |
0,49 0,56 0,64 |
0,49 0,56 0,64 |
|
I = 400 PPD I = 500 I = 600 |
47 69 88 |
48 69 88 |
17 23 31 |
17 23 31 |
16 15 18 |
16 15 19 |
12 11 13 |
10 12 14 |
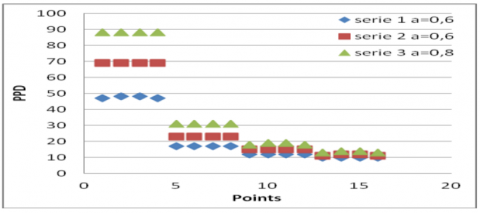
Figure 3/a. Case a) Values of the of PMV in those locations, for I=500 W/m2 and a=0.6, 0.7 and 0.8
Figure 3/b. Case a) Values of the of PPD in those locations,for I=500 W/m2 and a=0.6, 0.7 and 0.8
These refer respectively to a glass wall featured by an absorption coefficient a = 0.6 and irradiation values on vertical surface I = 400, 500 and 600 W/m2, to irradiation values I = 500 W/m², and absorption coefficients a = 0.6, 0.7 and 0.8.
As you can observe the comfort conditions within the open
space considered, are strongly influenced by radiative the exchanges “surface-subject”, which in turn are closely related with the position occupied by the subject in relation to the radiating surface.
Even the simulations dealing with case b), whose values are shown in Tables 4/a and 4/b and in figures 4/a and 4/b,-respectively obtained by an absorption coefficient a=0.6 and irradiation values on vertical surface I=400, 500 and 600 W/m2 and irradiation values I=500 W/m² and glass walls absorption coefficients a=0.6, 0.7 and 0.8- show that comfort conditions inside the environment are both affected by the radiative exchanges between surface-subject and the mutual position between the subject and the radiating surface.
Figures 5/a and 5/b show that as the distance of the point i increases from the radiating surface, comfort conditions are better in case a) -a single glass wall- than in case b).
Table 4/a. Case b) Values of air temperature Ta, local mean radiant temperature Tmrl, PMV and PPD, for subjects Standing,
M = 1.0 Met, Iclo = 0.75 clo, va = 0.15 m/s, I = 500 W/m2 and a = 0.6, 0.7 and 0.8.
|
i-th Points |
1 e 4 |
2 e 3 |
5 e 8 |
6 e 7 |
9 e 12 |
10 e 11 |
13 e 16 |
14 e 15 |
|
|
Ta |
26,0 |
26,0 |
26,0 |
26,0 |
26,0 |
26,0 |
26,0 |
26,0 |
|
|
a = 0,6 Tmrl a = 0,7 a = 0,8 |
37,5 40,1 42,9 |
37,6 40,2 43,0 |
32,0 33,5 35,2 |
32.0 33,5 33,2 |
30,6 31,7 33,0 |
30,6 31,7 33,0 |
29,6 30,5 31,6 |
29,6 30,5 31,5 |
|
|
a = 0,6 PMV a = 0,7 a = 0,8 |
2,04 2,46 2,92 |
2,04 2,46 2,92 |
1,19 1,42 1,68 |
1,19 1,42 1,36 |
0,97 1,14 1,34 |
0,97 1,14 1,33 |
0,83 0,97 1,12 |
0,82 0,96 1,11 |
|
|
a = 0,6 PPD a = 0,7 a = 0,8 |
79 92 99 |
79 93 99 |
35 47 60 |
35 46 44 |
25 33 42 |
25 32 42 |
20 25 32 |
19 24 31 |
|
Table 4/b. Case b) Values of air temperature Ta, local mean radiant temperature Tmrl, PMV and PPD, for subjects Standing
M = 1,0 Met, Iclo = 0.75 clo, va = 0.15 m/s, a = 0,6 e I = 400, 500 e 600 Watt/m2
|
Punti i |
1 e 4 |
2 e 3 |
5 e 8 |
6 e 7 |
9 e 12 |
10 e 11 |
13 e 16 |
14 e 15 |
|
Ta |
26,0 |
26,0 |
26,0 |
26,0 |
26,0 |
26,0 |
26,0 |
26,0 |
|
I = 400 Tmrl I = 500 I = 600 |
34,7 37,5 40,7 |
34,7 37,6 40,7 |
30,5 32,0 33,9 |
30,4 32,0 33,8 |
29,3 30,6 32,0 |
29,3 30,6 31,9 |
28,6 29,6 30,7 |
28,6 29,6 30,7 |
|
I = 400 PMV I = 500 I = 600 |
1,60 2,04 2,55 |
1,60 2,04 2,55 |
0,96 1,19 1,47 |
0,96 1,19 1,47 |
0,97 0,97 1,18 |
0,79 0,97 1,17 |
0,69 0,83 1,00 |
0,69 0,82 0,99 |
|
I = 400 PPD I = 500 I = 600 |
56 79 94 |
56 79 94 |
24 35 49 |
24 35 49 |
18 25 34 |
18 25 34 |
15 20 26 |
15 19 26 |
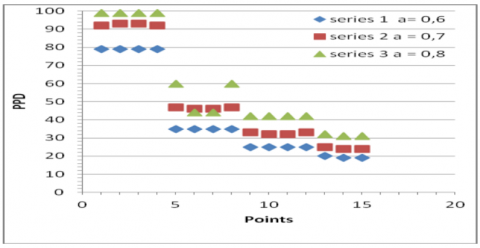
Figure 4/a. Case b) Values of the PMV in those locations, for I=500 W/m2 and a=0.6, 0.7 and 0.8
Figure 4/b. Case b) Values of the PMV in those locations,for I=500 W/m2 and a=0.6, 0.7 and 0.8
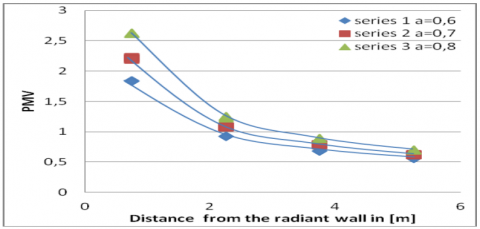
Figure 5/a. Cases a) - Values of the PMV as a function of distance, I = 500 W/m2 and a = 0.6 0.7 and 0.8
Figure 5/ b. Cases b) - Values of the PMV as a function of distance, I = 500 W/m2 and a = 0.6 0.7 and 0.8
In both cases, for all the configurations examined, the parameters of comfort PMV and PPD continue to depend on the distance of the point from the wall, varying the values of the incident radiation on the vertical glass surface of the window, I, and the absorption coefficients, a.
This confirms the role that such kind of distance takes in accurate evaluations of comfort conditions within the open-space workplace.
Even the trend of the graphs of Figures 5/a and 5/b -referring respectively to the simulations obtained by irradiation values I=500 W/m² and glass walls absorption coefficients a=0.6 0.7 and 0.8- shows that the values of the parameter PMV for both the examined cases a) and b) are strongly dependent on the distance of the point compared from radiant walls.
The graphs of figures 5/a and 5/b show that increasing the distance of the point from the radiating surface, the conditions of comfort for any occupant placed in that place gets better.
Table 5. Comparison of PMV values of tab.3/a and tab 3/b with the corresponding PMV values' achieved by the Tmr range of values calculated using the 1)
|
i-th Points |
1 e 4 |
2 e 3 |
5 e 8 |
6 e 7 |
9 e 12 |
10 e 11 |
13 e 16 |
14 e 15 |
|
a = 0,6 PMV a = 0,7 a = 0,8 |
1,83 2,20 2,62 |
1,84 2,22 2,63 |
0,92 1,08 1,25 |
0,92 1,08 1,23 |
0,68 0,78 0,89 |
0,68 0,78 0,89 |
0,56 0,62 0,70 |
0,56 0,62 0,70 |
|
a = 0,6 PMV’ a = 0,7 a = 0,8 |
1,07 1,21 1,35 |
1,07 1,21 1,35 |
1,07 1,21 1,35 |
1,07 1,21 1,35 |
1,07 1,21 1,35 |
1,07 1,21 1,35 |
1,07 1,21 1,35 |
1,07 1,21 1,35 |
|
a = 0,6 Diff % a = 0,7 a = 0,8 |
41,53 45,00 48,47 |
41,85 45,50 48,67 |
-16,30 -12,04 -8,00 |
-16,30 -12,04 -9,76 |
-57,35 -55,13 -51,69 |
-57,35 -55,13 -51,69 |
-91,07 -95,16 -92,86 |
-91,07 -95,16 -92,86 |
|
I = 400 PMV I = 500 I = 600 |
1,44 1,83 2,28 |
1,44 1,84 2,30 |
0,75 0,92 1,11 |
0,76 0,92 1,12 |
0,58 0,68 0,80 |
0,58 0,68 0,80 |
0,49 0,56 0,64 |
0,49 0,56 0,64 |
|
I = 400 PMV’ I = 500 I = 600 |
0,92 1,07 1,24 |
0,92 1,07 1,24 |
0,92 1,07 1,24 |
0,92 1,07 1,24 |
0,92 1,07 1,24 |
0,92 1,07 1,24 |
0,92 1,07 1,24 |
0,92 1,07 1,24 |
|
I = 400 Diff % I = 500 I = 600 |
36,11 41,53 45,61 |
36,11 41,85 46,09 |
-22,67 -16,30 -11,71 |
-21,05 -16,30 -10,71 |
-58,62 -57,35 -55,00 |
-58,62 -57,35 -55,00 |
-87,76 -91,07 -93,75 |
-87,76 -91,07 -93,75 |
Table 5 shows the comparison between the values of PMV reported in tables 3/a and 3/b of values of PMV' obtained from Tmr calculated using the formula 1) and the percentage error calculated with the following formula:
Diff $\%=\frac{P M V-P M V^{\prime}}{P M V} \times 100$ (5)
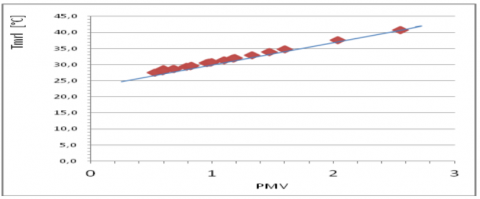
The graphs of Figures 6/a and 6/b show the correlation between the PMV, the local mean radiant temperature Tmrl and the distance to the radiating surface.
Figure 6/a. Values of the local mean radiant temperature Tmrl in relation to the distance
Figures 6/b. Values of the local mean radiant temperature Tmrl in relation to the PMV
The two graphs of Figures 6/a and 6/b can be analyzed in the following two ways:
a) starting from the graph in figure 6/a and choosing a i-th given distance point from the radiant wall you can evaluated the corresponding local mean radiant temperature, Tmrl, and in correspondence with this, you can estimate the PMV from the graph of figure 6/b.
b) for each given value of PMV, from the graph of fig. 6/b you are able to identify the corresponding value of Tmrl and, subsequently, from the graph of fig. 6/a in correspondence with this value, you can read the distance of the point verifying the two pairs of values of the PMV and Tmrl.
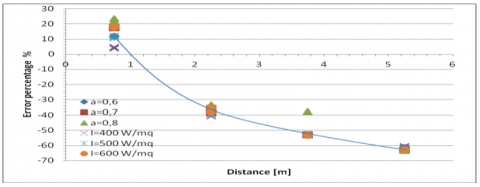
Figure 7 shows the percentage errors calculated with the 5) between PMV and PMV’ depending on the distance of the point from the radiating surface.
Figure 7. Case a) - Error percentage reported in Table 5
As described above confirms what is already well known in the literature, that the local conditions of comfort, depend on the parameters of the place where they are valued; evaluations obtained through the use of average values, will certainly not are able to provide the actual comfort conditions in the considered point and to lead to exact evaluations.
Tables 5 and 6 and the graphs of Figs 7 show that the percentage error you make in the evaluation of the predicted mean vote values, PMV', calculating the Tmrl with the formula 1) and not with the formula 4) proposed in this study, is much bigger when you get further away from the center of the room chosen as a case study [14].
This behavior is also shown by the graphs of Figs. 6/a and 6/b correlating the PMV value in i-th point to the corresponding local mean radiant temperature Tmrl, which in turn is correlated with the distance of the radiating surface point .
|
Ta |
Air temperature, °C |
|
va |
Air speed, m/s |
|
φa |
Air relative humidity, dimensionless |
|
Top |
Operating temperature, ° C |
|
Tmr |
Mean radiant temperature, °C |
|
Tmrl |
Local mean radiant temperature, ° C |
|
Tj |
Temperature of the j-th wall, ° C |
|
Sj |
j-th wall surface, m2 |
|
Fi,j |
Factor of view of a j-th subject set at the i-th location of the environment, dimensionless |
|
fapi |
Factor of projected area of the subject compared to the surfaces, dimensionless |
|
di |
distance of the point of the environment, compared ………..to the i-th wall, m |
|
PMV |
Predicted Mean Vote, dimensionless |
|
PMVm |
Average Predicted Mean Vote, dimensionless |
|
PPD |
Percentage of dissatisfied, dimensionless |
|
Iclo |
Clothing thermal resistance, clo |
|
Met |
Metabolic activity, Met |
|
a |
Glass walls absorption coefficient, dimensionless |
|
I |
Solar radiation incident on the glass surface, W/m2 |
1. Fanger P.O., (1972): “Thermal Comfort”, McGraw-Hill, New York, 1972, cap. 5-6.
2. Siegel R., Howell (1972): “Thermal Radiation Heat Transfer”, McGraw-Hill, New York, 1972.
3. Olesen B.W., (1985): “Local Thermal Discomfort”, Bruel & Kjaer Technical Review, 1, 1985.
4. Bonavita F., Brunello P., Zecchin R., (1989): “Metodo di calcolo dei fattori di forma tra Corpo umano e superfic interene di un ambiente”, Condizionamento dell’aria, 2, 1989, p.217.
5. Olesen B.W., Rosendahl J., Kalisperis I.N., Steinman M., Summers L.H., (1989): “Method for Measuring and
Evaluating the Thermal Radiation in a room”, ASHRAE Tran.95 (1) 1989, p.1028.
6. Kalisperis I.N., Steinman M., Summers L.H., (1991): “Angle Factor graphs for a person to inclinated surfaces”, ASHRAE Tran.97 (2) 1991, p.809.
7. Kalisperis I.N., Steinman M., Summers L.H., (1991): “Expanded research on human shape factors for inclinated surfaces” Energy and Buildings, 17, 1991, p.283.
8. Cannistraro G.,Franzitta G., Rizzo G., (1991): “Algorithms for the calculation of the mean projected area factors of seated and standing persons” Energy and Buildings, 17, 1991, p.221.
9. Cannistraro G.,Franzitta G.,Giaconia C.,Rizzo G., 1992): “Algorithms for the calculation of the view factors between human body and rectangular surfaces in parallelepiped environ ments”, Energy and Buildings, 19, 1992, p.51.
10. ISO 7730 (1993) “Moderate thermal environments- determination of the PMV and PPD indices and specification of the conditions for thermal comfort”, Geneva, International Standards Organization, 1993.
11. Johnson G.T., (1994): Comment on “Algorithms for the calculation of the view factors between human body and rectangular surfaces in parallelepiped environments”, Energy and Buildings, 21, 1994, p.79.
12. Corrado V., Pretti M., Sacchi A., (1995: “Routine for the calculation of angle factors between human body and car driver’s cabin”, 3rd International Conference on Vehicle Confort and Ergonomics, Bologna, marzo 1995.
13. Corrado V., Astolfi A., (1997): Sul calcolo puntuale della temperatura media radiante in ambienti di forma irregolare”, 52 Congresso nazionale A.T.I., Cernobbio, Como.
14. Cannistraro G., Cannistraro M., and Restivo R.:” The local media radiant temperature for the calculation of comfort in areas characterized by radiant surfaces”, International Journal of Heat and Technology (ISSN 0392-8764), Vol. 33, No 1, March 2015