Effendy*![]() | Christoporus | Made Antara | Muhardi | Bunga Elim Somba | Olivia Esther Caroline Rumangkang
| Christoporus | Made Antara | Muhardi | Bunga Elim Somba | Olivia Esther Caroline Rumangkang
© 2023 IIETA. This article is published by IIETA and is licensed under the CC BY 4.0 license (http://creativecommons.org/licenses/by/4.0/).
OPEN ACCESS
Rice is a strategic commodity, so the Government of Indonesia puts forward the standard of building a globally competitive rice farming model by increasing the Total Factor Productivity (TFP). However, until now, farm managers have had a relatively shallow understanding of the TFP concept. This study, focusing on lowland rice farming in Indonesia, identifies the factors that determine the development of the TFP. The main questions in this research are, what are the impacts of farming scale, technical efficiency, allocative efficiency, and the efficiency scale? Has lowland rice farming adopted technology to reduce wasting resources due to an inefficient use of inputs? This study used 329 cross-sectional pieces of data on small-scale rice farming. The research results indicate that lowland rice farming is in a decreasing return condition and that there is technical inefficiency. TFP tends to increase when the farm scale increases. Technical efficiency, allocative efficiency, and scale of efficiency are the main determining factors in developing TFP at the level of lowland rice farmers; of these, technical efficiency is the most important factor.
TFP, technical efficiency, allocative efficiency, scale efficiency
According to the results of the ASF Survey (Area Sample Framework) in Indonesia 2021, the rice harvested area reached approximately 10.41 million hectares and decreased by 245.47 thousand hectares (2.30 percent) compared to 2020 [1]. Meanwhile, rice production in 2021 is 54.42 million tons of MDR (Milled Dry Rice). If converted into rice, this 2021 rice production will reach around 31.36 million tons, which would be a decrease of 140.73 thousand tons (0.45 percent) compared to rice production in 2020. A combination of various factors led to this decline. Effendy [2], Effendy et al. [3], Effendy et al. [4], and Gebeltová [5] suggest that the most critical factors include: increased prices of fertilizers and superior seeds, availability of technology, and fewer investment opportunities for farmers. As a result, the farmers cannot provide extensive and standard supplies in the process of lowland rice farming, which has reduced farm productivity.
Productivity is defined as the ratio of output to input. Productivity is a basis of performance measurement; as such, it is often considered to be an indicator or measure of competitiveness in the long term [6]. Productivity can be calculated easily if there is only one input and one output. However, it is more complicated to calculate productivity if there are several inputs. Total factor productivity (TFP) measures farm productivity and growth with consideration of various production inputs. TFP is measured using a productivity index or indicator [7].
TFP has been widely used to measure productivity. There are two methods to measure productivity: parametric (Stochastic Frontier Analysis) and nonparametric methods (Data Envelopment Analysis) [8]. TFP measures the ability of all kinds of factors of production as an aggregate production unit to produce output [9]. TFP measures the ability farmers have to produce more output using less input. By identifying the factors that affect TFP, one can devise a reasonable basis for sustainable growth. An increase in TFP indicates a decrease in actual costs as well as an increase in competitiveness and living standards [10].
Rice is a strategic commodity; thus, it must always be available to the community. The issues of the demand, availability and production of rice continue to receive attention from various parties due to climate change, which many fear will affect Indonesia’s national rice production. In addition, the conversion of agricultural land to non-agricultural uses is still ongoing, and the price of farm inputs is increasing, which leads to small farmers having a weak capital [11].
The government puts forward standards for building a rice farming model that can achieve global competitiveness; it emphasizes that farming must provide high-quality products and services that will provide an increase in total factor productivity (TFP). However, currently, farm managers have a relatively shallow understanding of the TFP concept. Therefore, this study focuses on lowland rice farming in Indonesia, and it identifies the factors that determine the development of TFP. The main question in this research is: How is TFP impacted by farming scale, technical efficiency (TE), allocative efficiency (AE), and scale efficiency (SE)? Subsequently, has lowland rice farming developed and adopted innovations to reduce the wastage of resources due to the inefficient use of inputs? TE and TFP have been analyzed in several studies [12-19]; typically, these studies have used time series data. In contrast, this study used cross-sectional data on small-scale lowland rice farming.
2.1 Lowland rice farming data analysis
We use descriptive analysis to analyze the types and characteristics of the data. Descriptive analysis has two processes, namely, in the form of description and interpretation. Parametric and nonparametric methods are often used to measure TFP. Stochastic Frontier Analysis (SFA) is the most frequently used parametric method [20, 21]. Popular nonparametric methods include DEA (Data Envelopment Analysis) and index methods [22-24]. The index method is represented by Malmquist [24-29] and Törnqvist [30, 31]. This study uses a nonparametric approach to measure TFP. The advantage of this method is that it does not need to consider the shape of the normal distribution. However, through this method, the factors that affect TFP cannot be directly analyzed, so further regression analysis is needed. The index method is obtained by determining the ratio of total output to total input. This study uses the Tornqvist index method to measure TFP.
2.2 Variable samples and specifications
This study used a sample from the 329 farms selected by proportional sampling. These farms are broken down as follows: Ranteleda Village 56 farming, Tanah Harapan Village 44 farming, Tongoa Village 52 farming, Balinggi Village 65 farming, Astina Village 52 farming, and Nambaru Village 60 farming. Data were collected from March 2022 to May 2022 using a questionnaire. We used the Translog production frontier form because it is flexible and provides a reasonable estimate of the production process (Eq. (1)).
$\begin{gathered}\ln (Y)=\beta_0+\beta_1 \ln \left(X_1\right)+\beta_2 \ln \left(X_2\right)+ \\ \beta_3 \ln \left(X_1\right)^2+\beta_4 \ln \left(X_2\right)^2+\beta_5 \ln \left(X_1\right) \ln \left(X_2\right)+ \\ \beta_6 \ln \left(X_1\right) \ln \left(X_2\right)+\beta_7 \ln \left(X_1\right) \ln \left(X_2\right)+ \\ \beta_8 \ln \left(X_1\right) \ln \left(X_2\right)+\beta_9 \ln \left(X_1\right) \ln \left(X_2\right)+ \\ \beta_{10} \ln \left(X_1\right) \ln \left(X_2\right)+\beta_{11} \ln \left(X_1\right) \ln \left(X_2\right)+ \\ \beta_{12} \ln \left(X_1\right) \ln \left(X_2\right)+\beta_{13} \ln \left(X_1\right) \ln \left(X_2\right)+ \\ \beta_{14} \ln \left(X_1\right) \ln \left(X_2\right)+\left(V_i+U_i\right)\end{gathered}$ (1)
where:
Y = lowland rice production in the form of rice,
X1 = land,
X2 = chemical fertilizer,
X3 = seeds,
X4 = labor,
Vi = random variables,
Ui = has truncated normal distribution.
TFP can be calculated using the Törnqvist-Theil index (TTI) [9]. The TTI can determine changes in production that result from input adjustments in cases in which a function has a translog form [9]. TFP is a combination of the technical efficiency effect (TE), the allocative efficiency effect (AE), and the scale efficiency effect (SE) (Eq. (2)).
$\ln T F P=\alpha 0+\alpha 1 \ln (T E)+\alpha_2 \ln (A E)+\alpha_3 \ln (S E)+\mu_i$ (2)
3.1 Summary statistics of research variables
The summary statistics of the research variables are shown in Table 1.
Table 1. Summary of statistics of research variables
|
Variable |
Units |
Mean |
Std. Deviation |
|
Output (rice) |
kg/farm |
4643 |
1874.059 |
|
Land |
ha/farm |
1.933 |
0.613 |
|
Chemical fertilizer |
kg/farm |
664.482 |
249.395 |
|
benih |
kg/farm |
208.003 |
71.829 |
|
Labor |
man-days/farm |
207.978 |
59.522 |
|
TFP |
decimal |
1.043 |
0.201 |
|
TE |
decimal |
0.837 |
0.113 |
|
AE |
decimal |
0.837 |
0.074 |
|
EE |
decimal |
0.705 |
0.137 |
|
SE |
decimal |
0.953 |
0.102 |
Source: Own calculations
Table 1 shows that the average lowland rice field area is 1,933 ha/farm (small-scale farms are categorized as being ≤ 2 ha). In turn, the average rice production is more than 4 tons/farm. The production inputs that were used are chemical fertilizers, seeds, and labor. Most lowland rice farmers have not been efficient in managing their farms, which affects their achieved TFP.
3.2 Production function of lowland rice farming translog
In Table 2, we present the results of the translog production function of lowland rice farming (Eq. (1)) estimated using FRONTIER 4.1 [32].
Table 2. Estimation of stochastic production frontier for lowland rice farming
|
Variable |
Translog Model |
|
|
Coefficient |
Standard-error |
|
|
Production Function |
|
|
|
Constant |
7.528 |
0.014 |
|
lnX1 |
0.065** |
0.013 |
|
lnX2 |
0.109** |
0.008 |
|
lnX3 |
0.445** |
0.004 |
|
lnX4 |
0.088** |
0.005 |
|
(lnX1)2 |
0.008 |
0.007 |
|
(lnX2)2 |
-0.058** |
0.005 |
|
(lnX3)2 |
0.034** |
0.009 |
|
(lnX4)2 |
-0.025** |
0.007 |
|
lnX1*lnX2 |
-0.004 |
0.011 |
|
lnX1*lnX3 |
0.009 |
0.011 |
|
lnX1*lnX4 |
-0.026* |
0.010 |
|
lnX2*lnX3 |
-0.010 |
0.007 |
|
lnX2*lnX4 |
0.020* |
0.009 |
|
lnX3*lnX4 |
-0.016* |
0.006 |
|
sigma-squared |
0.078** |
0.008 |
|
gamma |
1.000** |
0.000 |
|
log likelihood function |
175.334 |
|
|
LR test of the one-sided error |
126.467 |
|
Source: Own calculations, * p ≤ 0.05, ** p ≤ 0.01
As expected, almost all of the parameters considered were significant at the 1% and 5% levels; moreover, ten out of 14 of them differed significantly at the 1% and 5% levels, indicating the importance of the multiple interactions and the non-linearity between variables. In addition, all four direct effects as well as three squared terms and three cross products have significant coefficients between the 1% and 5% levels. This indicates that the function of lowland rice farming is nonlinear and that there are some important interactions between variables. The main determining factors in lowland rice farming are the four research variables: land, fertilizer, seeds, and labor. Seeds are the most important input in lowland rice farming, as they have an output elasticity of 0.45 and the lowest land area (0.07). The significant negative coefficient indicates that technical efficiency declines over time [9, 32]. The total elasticity of the four inputs is 0.707, which suggests that lowland rice farming provides decreasing returns. Furthermore, the gamma value is 1.00 and it is significant at the 1% level, which indicates that there is a technical inefficiency in lowland rice farming in Central Sulawesi.
3.3 TFP development based on the farm scale
Table 3 presents the Total Factor Productivity (TFP) at the farmer level, based on the scale of lowland rice farming in Central Sulawesi.
Table 3. Development of TFP by land area
|
Lowland rice farming scale (ha) |
TFP |
|
|
Mean |
Std. Deviation |
|
|
≤ 1 |
0.945 |
0.202 |
|
>1 - ≤ 2 |
0.970 |
0.156 |
|
>2 - 3 |
1.261 |
0.096 |
Source: Own calculations
Table 3 shows that the Total Factor Productivity (TFP) tends to increase as the farm scale increases. This is related to technical efficiency in lowland rice farming (land area), as shown in Table 2, which has been analyzed using the translog stochastic frontier functional model. Small-scale agriculture is a source of inefficiency because small-scale farmers have difficulty coping with technology, and they often lack access to resources [33]. The technical efficiency of lowland rice farming at the farmer level ranges from 0.36 to 1.00; this indicates that there is technical inefficiency in the agriculture (Table 4). As such, there are still opportunities for farmers to increase lowland rice productivity in Central Sulawesi. Lowland rice farming inefficiency can be minimized by efficiently using the production inputs in Eq. (1): land, fertilizer, seeds, and labor.
Table 4. Lowland rice farming technical efficiency score
|
Technical efficiency score |
Frequency (Farm) |
Percent (%) |
|
< 0.40 |
1 |
0.30 |
|
0.40 - 0.49 |
2 |
0.61 |
|
0.50 - 0.59 |
6 |
1.82 |
|
0.60 - 0.69 |
18 |
5.47 |
|
0.70 - 0.79 |
103 |
31.32 |
|
0.80 - 0.89 |
87 |
26.44 |
|
≥ 0.90 |
112 |
34.04 |
|
Total |
329 |
100.00 |
Note: Minimum = 0.36; Mean = 0.84; Maximum = 1.00
The findings of this research are a reminder of the importance of improving the scale of farming in rural areas and ensuring its sustainability. Several countries have issued policies to promote large-scale agriculture, such as farmer cooperatives, which direct individual farmers to pool their resources and share costs and profits so that they will have greater competitiveness. Agarwal and Dorin [34], Holmström et al. [35], and Piet et al. [36] present the case in favor of group farming in countries such as Norway and Ireland in terms of the production of milk, Japan with its rice crops, a different ex-socialist country of India, Sweden with calf farming, and France with an increase in the area it uses for agricultural land.
3.4 Determinants of TFP in lowland rice farming
Table 5 presents the results of estimating the multiple regression parameters of the Cobb-Douglas model on the determinants of TFP at the level of lowland rice farmers (Eq. (2)).
Table 5. Estimation of the determinants of TFP at the level of lowland rice farmers
|
Model |
Coefficient |
Std. Error |
p |
|
Constant |
0.390 |
0.001 |
0.000 |
|
TE |
0.994** |
0.003 |
0.000 |
|
AE |
0.990** |
0.004 |
0.000 |
|
SE |
0.005 |
0.003 |
0.168 |
Source: Own calculations, ** p ≤ 0.01
Table 5 shows that the two estimated parameters, TE and AE, are significant at the 1% level. These two factors are the main determinants in developing TFP at the level of the lowland rice farmers. TE is the most important factor, as it has an output elasticity of 0.994 and it is significant at the 1% level. Notably, changes in TE and AE can be accelerated by education, access to extension, and by gaining farming experience [37, 38]. These three factors can affect the technical inefficiency of lowland rice farming that currently affects the productivity growth [37-39]. Based on the differences in TE and AE at the farm level, we can conclude that the differences in small-scale lowland rice production are characterized by the differences in chemical fertilizers, seeds, and labor use. The estimates of the TE and AE levels in small-scale lowland rice farming generally indicate that there is an opportunity to achieve frontier efficiency through more efficient use of inputs (technical efficiency) and by reallocating inputs (allocation efficiency).
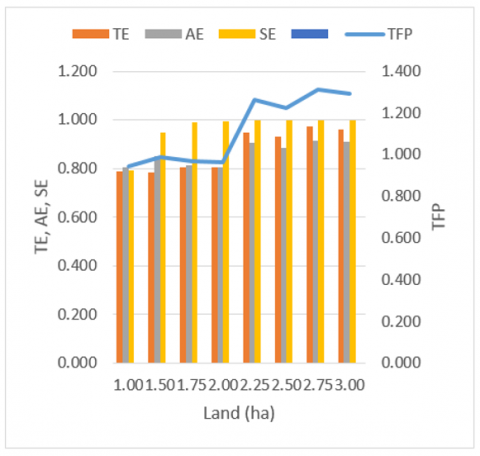
The development of TFP is presented in Figure 1.
Figure 1 shows that the Total Factor Productivity (TFP) of lowland rice farming has fluctuated and risen. This increase has been influenced by the efficiency component of farming; this indicates that the more efficient a farm is, the higher a TFP it will have. This indicates that technological progress appears to be a significant source of growth in lowland rice farming. Tables 2 and 4 indicate that technological advances are the sources of the significant increase in TFP in lowland rice farming in this region. Therefore, we can say that technological advances can reduce inefficiency and improve technical efficiency, thereby increasing the TFP. In addition, we can assume that technological advances will result in lower average costs; in turn, this will lead to higher competitiveness of lowland rice farming in Indonesia. Finally, technological advances in lowland rice farming can significantly contribute to production possibilities; subsequently, the positive impact of these accelerates over time. Therefore, we can conclude that the production and income of lowland rice can be increased by farmers making technical changes in the use of their production inputs so that there is an average cost savings of farming.
Figure 1. Development of TFP and its determinants in lowland rice farming
The results from our investigation showed that land, fertilizer, seeds, and labor are the main determining factors in the success or failure of lowland rice farming in Indonesia. Seeds are the most important input in lowland rice farming, and they lead to the lowest land area. The total elasticity of production is less than one. Thus, indicates that lowland rice farming is in the condition of a decreasing return, and that there is currently a technical inefficiency in small-scale lowland rice farming. The Total Factor Productivity (TFP) tends to increase as the farm scale increases. This relates to the technical efficiency that occurs in lowland rice farming (land area), and it also reflects that small-scale agriculture is a source of inefficiency. Small-scale farmers struggle with technology, and they often lack access to resources. This reflects the importance of pooling resources to improve the scale of farming in rural areas and ensure its sustainability. At the level of lowland rice farmers, the development of the TFP is determined by the components of farming efficiency, such as technical efficiency, allocative efficiency, and scale efficiency. That is to say, the more efficient a farm is, the higher its TFP will be. Technological advances are a strong source of increasing the TFP in lowland rice farming because technological advances can reduce farming inefficiency and increase technical efficiency. Technology can also reduce the average cost of farming, resulting in a higher competitiveness of lowland rice farming. Finally, the production and income of lowland rice can be increased by changing the technical use of production inputs in order to reduce the average cost of farming.
The authors would like to thank the reviewers who provided valuable comments and suggestions and Tadulako University and the Ministry of Education, Culture, Research, and Technology for funding this study.
[1] BPS. (2022). Luas panen dan produksi padi di Indonesia 2021 (Hasil Kegiatan Pendataan Statistik Pertanian Tanaman Pangan Terintegrasi dengan Metode Kerangka Sampel Area). Badan Pusat Statistik (BPS), p. 329. https://www.bps.go.id/publication/2022/07/12/c52d5cebe530c363d0ea4198/luas-panen-dan-produksi-padi-di-indonesia-2021.html.
[2] Effendy. (2010). Production factor efficiency and income of wetland rice farm in Masani Village Poso Pesisir Sub District Poso Regency. J. Agroland, 17(3): 233-240. http://103.245.72.23/index.php/agrolandnasional/article/view/1173/1180.
[3] Effendy, Antara, M., Muhardi, Pellokila, M.R., Mulyo, J.H. (2021). Identification of factors affecting decisions to adopt pesticides at lowland rice farms in Indonesia. International Journal of Design & Nature and Ecodynamics, 16(6): 717-723. https://doi.org/10.18280/ijdne.160614
[4] Effendy, Antara, M., Muhardi, Pellokila, P.M., Mulyo, J.H. (2022). Effect of socio-economic on farmers' decisions in using lowland rice production inputs in Indonesia. International Journal of Sustainable Development and Planning, 17(1): 235-242. https://doi.org/10.18280/ijsdp.170123
[5] Gebeltova, Z. (2012). Czech Republic's self-sufficiency in case of pork meat and its impact on trade balance development. Agris on-line Papers in Economics and Informatics, 4(665-2016-44884): 3-14. https://doi.org/10.22004/ag.econ.131358
[6] European Commission. (2009). European Competitiveness Report 2008. European Commission. https://www.google.com/url?sa=t&rct=j&q=&esrc=s&source=web&cd=&ved=2ahUKEwie9b6OqMr6AhX47zgGHZbsCWgQFnoECAwQAQ&url=https%3A%2F%2Fec.europa.eu%2Fdocsroom%2Fdocuments%2F3399%2Fattachments%2F1%2Ftranslations%2Fen%2Frenditions%2Fnative&usg=AOvVaw3IQFaNE4fkwHESk0dWzpjv.
[7] Ondrej, M.A.C.H.E.K., Jiri, H. (2012). Total factor productivity approach in competitive and regulated world. Procedia-Social and Behavioral Sciences, 57: 223-230. https://doi.org/10.1016/j.sbspro.2012.09.1178
[8] Hossain, M.K., Kamil, A.A., Baten, M.A., Mustafa, A. (2012). Stochastic frontier approach and data envelopment analysis to total factor productivity and efficiency measurement of Bangladeshi rice. PLoS One, 7(10): e46081. https://doi.org/10.1371/journal.pone.0046081
[9] Cechura, L., Kroupova, Z., Rudinskaya, T. (2015). Factors determining TFP changes in Czech agriculture. Agricultural Economics, 61(12): 543-551. https://doi.org/10.17221/14/2015-AGRICECON
[10] Suphannachart, W. (2013). Total factor productivity of main and second rice production in Thailand. Applied Economics Journal, 20(1): 1-22.
[11] Winarso, B. (2013). Kebijakan pengembangan komoditas tanaman pangan dalam mendukung program master plan percepatan dan perluasan pembangunan ekonomi Indonesia (MP3EI) studi kasus di Propinsi Gorontalo. Jurnal Penelitian Pertanian Terapan, 13(2): 85-102. https://doi.org/10.25181/jppt.v13i2.171
[12] Błażejczyk-Majka, L., Kala, R., Maciejewski, K. (2012). Productivity and efficiency of large and small field crop farms and mixed farms of the old and new EU regions. Agricultural Economics, 58(2): 61-71. https://doi.org/10.17221/48/2011-AGRICECON
[13] Malá, Z. (2011). Efficiency analysis of Czech organic agriculture. E+M Ekonomie a Management, 14: 14-28.
[14] Čechura, L. (2012). Technical efficiency and total factor productivity in Czech agriculture. Agricultural Economics, 58(4): 147-156.
[15] Curtiss, J., Jelinek, L. (2012). Cost efficiency and farm self-selection in precision farming: The case of Czech wheat production (No. 708-2016-48435). In: 131th EAAE Seminar Innovation for agricultural competitiveness and sustainability of rural areas, Prague, Czech Republic. https://doi.org/10.22004/ag.econ.135784
[16] Machek, O., Špička, J. (2013). Measuring the performance growth of the agricultural sector: A total factor productivity approach. International Journal of Economics and Statistics, 4(1): 200-208.
[17] Špička, J. (2013). The competitive environment in the dairy industry and its impact on the food industry. Agris on-line Papers in Economics and Informatics, 5(665-2016-44948): 89-102. https://doi.org/10.22004/ag.econ.152693
[18] Machek, O. (2014). The relationship between financial performance and total factor productivity: evidence from the Czech agricultural sector. International Journal of Social Sciences and Humanity Studies, 6(2): 57-67.
[19] Špička, J., Smutka, L. (2014). The technical efficiency of specialised milk farms: A regional view. The Scientific World Journal, 2014: 985149. https://doi.org/10.1155/2014/985149
[20] Sun, J., Li, W. (2003). International comparison of technological efficiency and total factor productivity growth of power sector. China Economic Problem, 6: 36-42.
[21] See, K.F., Coelli, T. (2013). Estimating and decomposing productivity growth of the electricity generation industry in Malaysia: A stochastic frontier analysis. Energy policy, 62: 207-214. https://doi.org/10.1016/j.enpol.2013.06.115
[22] Estache, A., Tovar, B., Trujillo, L. (2008). How efficient are African electricity companies? Evidence from the Southern African countries. Energy policy, 36(6): 1969-1979. https://doi.org/10.1016/j.enpol.2008.02.011
[23] Ramos-Real, F.J., Tovar, B., Iootty, M., De Almeida, E.F., Pinto Jr, H.Q. (2009). The evolution and main determinants of productivity in Brazilian electricity distribution 1998–2005: An empirical analysis. Energy Economics, 31(2): 298-305. https://doi.org/10.1016/j.eneco.2008.11.002
[24] Zhang, G., Xia, D. (2012). Study on Technical Efficiency and Total Factor Productivity of Transmission and Distribution Grid, in China: Analysis Based on Panel Data of 24 Provincial Power Companies from 2005 to 2009. Journal of Finance and Economics, 38(10): 112-122.
[25] Aghdam, R.F. (2011). Dynamics of productivity change in the Australian electricity industry: Assessing the impacts of electricity reform. Energy Policy, 39(6): 3281-3295. https://doi.org/10.1016/j.enpol.2011.03.019
[26] Yuzhi, S. (2012). Study of the input-output overall performance evaluation of electricity distribution based on DEA method. Energy Procedia, 16: 1517-1525. https://doi.org/10.1016/j.egypro.2012.01.238
[27] Wang, J., Zheng, H. (2015). Study on total factor productivity in China power industry under environmental constraints - panel data analysis based on Malmquist-Luenberger productivity index. J. Dongbei Univ Financ Econ., 102(6): 18-23.
[28] Zhao, T., Sun, T., Guo, W. (2015). Environmental efficiency and total factor productivity of thermal power enterprises. Financ Trad Res., 5: 25-31.
[29] Zhu, C. (2016). Total factor productivity and influence factors of China's Thermal power industry under environmental regulations. Review of Economy and Management, 6: 60-70.
[30] Bai, X., Mao, J. (2013). Evaluation of regulation reform effect of total factor productivity change in china's power industry. Journal of Hunan University of Science and Technology (Social Sciences Edition), 16(5): 98-101.
[31] See, K.F., Coelli, T. (2014). Total factor productivity analysis of a single vertically integrated electricity utility in Malaysia using a Törnqvist index method. Utilities Policy, 28: 62-72. https://doi.org/10.1016/j.jup.2013.11.001
[32] Coelli, T.J. (1994). Frontier Version 4.1: A Computer program for stochastic frontier production and cost function estimation. Department of Econometrics, University of New England, NSW.
[33] Lozano, S., Díaz Fernández, B.A. (2021). A DEA approach for merging dairy farms. Agricultural Economics - Czech, 67(6): 209-219.
[34] Agarwal, B., Dorin, B. (2019). Group farming in France: Why do some regions have more cooperative ventures than others? Environment and Planning A: Economy and Space, 51(3): 781-804. http://dx.doi.org/10.1177/0308518X18802311
[35] Holmström, K., Hessle, A., Andersson, H., Kumm, K.I. (2018). Merging small scattered pastures into large pasture-forest mosaics can improve profitability in Swedish suckler-based beef production. Land, 7(2): 58. https://doi.org/10.3390/land7020058
[36] Piet, L., Latruffe, L., Le Mouël, C., Desjeux, Y. (2012). How do agricultural policies influence farm size inequality? The example of France. European Review of Agricultural Economics, 39(1): 5-28. https://doi.org/10.1093/erae/jbr035
[37] Effendy, H.N., Setiawan, B., Muhaimin, A.W. (2013). Characteristics of farmers and technical efficiency in cocoa farming at Sigi Regency-Indonesia with approach stochastic frontier production function. J of Econ and Sust Develop, 4(14): 154-160.
[38] Rinaldi, J., Fariyanti, A., Jahroh, S. (2013). Fermented cocoa production efficiency on small-scale through stochastic frontier approach in Bali. Bul Ristri., 4(1): 79-88.
[39] Rodríguez, X.A., Elasraag, Y.H. (2015). Assessing the total factor productivity of cotton production in Egypt. PloS One, 10(1): e0116085. https://doi.org/10.1371/journal.pone.0116085