Dunisani T. Chabalala*![]() | Julius M. Ndambuki
| Julius M. Ndambuki![]() | Sophia S. Rwanga
| Sophia S. Rwanga![]()
© 2023 IIETA. This article is published by IIETA and is licensed under the CC BY 4.0 license (http://creativecommons.org/licenses/by/4.0/).
OPEN ACCESS
Ladysmith, a town in South Africa's KwaZulu-Natal province, has experienced flooding almost every year since 1884, resulting in temporary water shortages as well as the loss of lives, properties, and businesses. Ladysmith is a major economic, financial, and administrative hub for both the Alfred Duma municipality and the uThukela District Municipality. This study aimed to study the relationships between rainfall, wind speed, and streamflow trends in the Klip River catchment. The monthly, seasonal and annual trends were studied using the Mann-Kendall test. The study's findings revealed both decreasing and increasing trends in all streamflow, wind speed and rainfall. Streamflow and wind speed increased in most months, while rainfall had an equal combination of both increasing and decreasing trends throughout the year. The average annual streamflow decreased at a rate of -1.39 m3/s, rainfall at -3.05 mm, whereas wind speed increased by 3.68 m/s. On a seasonal scale, streamflow showed a decrease in spring and summer, whereas rainfall increased in the same seasons. In contrast, wind speed showed an increasing trend in all seasons. These results could be helpful in the planning and development of sustainable flood mitigation strategies.
streamflow, wind speed, rainfall, Mann-Kendall test, climate change, Klip River catchment, South Africa
Streams are important to both people and the environment, and their flow can be impacted by climate change factors such as rainfall and wind speed [1]. According to Camera et al. [2], climate change could have a major impact on the availability of water in the catchment area's rivers. Ramli et al. [3] stated that meteorological variables, such as rainfall, air temperature, humidity, air pressure, and wind speed, speed can be utilized to characterize climate change. Changes in rainfall, depending on its intensity, short-term or long-term rainfall can cause flooding, while long periods without rainfall can cause drought [4]. Existing literature by Pirah and Roslee [5] highlighted that climate change can increase the likelihood of floods; however, the timing of these events is uncertain and difficult to predict because of a number of variables at play. Liu et al. [6] indicated that climate change factors, such as wind speed may also influence streamflow, affecting the amounts and patterns of runoff. For instance, when the wind blows over a stream, water vapor is released into the air, converting more water particles into gaseous form, as a result, speeds up the rate of evaporation [7]. Wasko et al. [8] argued that a study of streamflow changes is essential for understanding the relationship between climate change and flooding. The Klip River is one of the major tributaries of the uThukela River and an essential water source for a large portion of Ladysmith and its surrounding area. However, policymakers, governments, and the community at large are concerned about dwindling streamflow and recurrent summer flooding [9, 10]. As a result, understanding how, where, and why streamflow changes are critical for sustainable water resource management and flood control [11]. This research aims to contribute to the existing knowledge of the rainfall, wind speed, and streamflow trends in the Klip River catchment. In addition, it addresses the question of how rainfall and wind speed affect streamflow. Over the recent past, numerous studies have been conducted to investigate the impact of climate change on streamflow in various catchments throughout the world. Back and Bretherton [12] investigated the relationships between wind speeds and precipitation in the Pacific Intertropical Convergence Zone. According to their findings, the increase in rainfall was substantially greater than the increase in evaporation produced by the increased wind speed. The study shows that there is a strong correlation between wind speed and precipitation. Abeysingha et al. [13] investigated the relationships between streamflow and rainfall at four gauging stations in the Gomti River basin of North India. The study results revealed a gradual decline in annual streamflow, which was attributed to increasing water extraction, increased temperatures, a higher population, and a significant decrease in rainfall. Bahati et al. [14] studied and analyzed the trends in rainfall and streamflow in the Mukono and Buibwe districts of Uganda's River Ssezibwa Catchment. The study results indicated that annual average rainfall decreased, whereas annual average streamflow increased. The increase in streamflow has been attributed to a change in land use/land cover. Lawin et al. [15] investigated the effects of observed changes in rainfall, temperature, and wind speed in Rwegura and Imbo catchment, Burundi. During the study period, rainfall showed a decreasing trend, whereas temperature and wind speed revealed increasing trends. Environmental deterioration caused by global climate change and population growth has been attributed to wind speed. Another similar study was conducted by Malede et al. [16], who studied the existing relationships between rainfall and streamflow trends, as well as potential drivers of streamflow variability in the Birr River catchment, Ethiopia. The study concluded that changes in streamflow without significant changes in rainfall may have been caused by other factors. Zhong et al. [17] investigated the pattern of streamflow and its attributions in China's Yellow River. During the study period, the runoff and rainfall results showed a decreasing trend. During the study period, the results of runoff and rainfall showed a declining trend. The study linked the decrease in streamflow to human activity. Zhao et al. [18] investigated the impact of climate variability and human activities on Streamflow in the Wanquan River Basin along the East Coast of Hainan Island in Southern China. Furthermore, trends of decreasing rainfall and increasing potential evapotranspiration were discovered. The study findings revealed that the annual streamflow reduces as the watershed's temperature rises. The study concluded that the relative impact of climate change was greater than that of human activities. Krishnan et al. [19] investigated the effect of climate change on evaporation rates in the Limbang River Basin of Sarawak, Malaysia. The results revealed an overall increasing trend in monthly evaporation rates. The study concluded that changes in rainfall, wind speed, and air temperature have a substantial impact on the study area's increasing rate of evaporation. Duethmann et al. [20] investigated the effect of changes in rainfall and temperature on the streamflow patterns of the Tarim River, Central Asia. The study's findings demonstrated that changes in temperature and rainfall caused an increase in streamflow. Despite numerous studies conducted on the trends in hydro-climatic variables such as rainfall, temperature, and evaporation, few studies have examined the trend in rainfall, wind speed, and their relationship with the trend in streamflow. Furthermore, this research question has not been addressed in the study area. Therefore, this study aimed at analyzing the monthly, seasonal, and annual trends of rainfall, streamflow, and wind speed, as well as the relationships between the trends of rainfall and wind speed and streamflow.
2.1 Study area
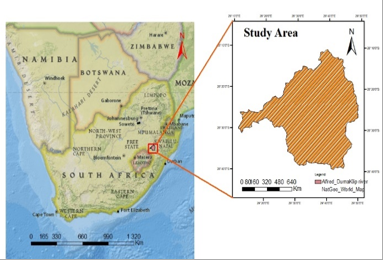
Figure 1 shows that the study area is the Klip River catchment. The catchment is one of the major sub-catchments in the uThukela Water Management Area. It is located in the Alfred Duma municipality (Figure 1), which is one of the three local municipalities under the uThukela District municipality in the KwaZulu-Natal province. Klip River originates from the Drakensberg Mountains and flows into the Windsor Dam and the larger Qedusizi Dam. After passing through both dams, the river flows through Ladysmith, which is located downstream of the catchment. Due to its location, any upstream changes coupled with climate change could exacerbate disasters such as flooding [10]. Ladysmith town serves as a major commercial, financial and administrative area for Alfred Duma municipality as well as uThukela District Municipality. The catchment has a draining area of 1670 km2, approximately 30% of the catchment is urban and 70% is rural [9, 10]. This study area was chosen due to the floods that have occurred almost every year since Ladysmith's establishment in 1884, including floods in 1994, 2011, 2012, and 2015, as well as in 2019 and 2021. As a result, people's lives were lost, basic infrastructure was damaged, people were displaced, and commercial activities in Ladysmith's Central Business District and surrounding areas were disrupted [9, 10].
The Klip River catchment experiences warm weather in the summer and cold weather in the winter. During summer, the highest temperature is about 30℃, while winter recorded the lowest temperature of 3℃ at night as reported in Chabalala et al. [21]. In comparison to South Africa's average annual rainfall of 450 mm [22], this study area receives an average of 700 mm per year. The study area receives high average monthly rainfall during the summer months (December to February), and low average monthly rainfall during the winter months (June to August). River levels usually rise significantly throughout the summer, resulting in flooding. Klip River catchment has a combination of flat and mountainous areas, and its topography ranges from 997 to 2086 meters above sea level, with the outlet point at 997 m [21].
Figure 1. Location map of the Klip River catchment [21]
2.2 Data
The daily rainfall (1985 – 2018), wind speed (1993 – 2018), and streamflow data (1986 – 2020) used in this study were collected from the Department of Water and Sanitation (DWS), and the South African Weather Services (SWS). Since the data was collected in daily values, manual analysis was performed using an Excel® worksheet to calculate the yearly and monthly averages of each station. Furthermore, missing values were diligently processed to avoid typing errors that could alter the final results. From the analysis, it was found that there were no missing data on wind speed and streamflow, while rainfall missing data was found to be less than 5%. The general characteristics of rain and river gauge stations are summarized in Table 1.
Table 1. Characteristics of hydro-climatic stations in the study area
|
Data type |
Station ID |
Lat. |
Long. |
Source |
|
Rainfall |
03004543 |
-28.575 |
29.75 |
SWS |
|
Wind speed |
03004543 |
-28.575 |
29.75 |
SWS |
|
Streamflow |
V1H038 |
-28.575 |
29.75 |
DWS |
The Mann-Kendall (MK) test was used to determine the trends in rainfall, wind speed, and streamflow at the Klip River catchment. Numerous studies have utilized the MK test to detect trends in hydrological or climatological data such as wind speed, streamflow, and temperature [23, 24]. The MK test has the advantage of being appropriate for both non-monotonic and monotonic trends, as well as being simple and robust enough to deal with values below maximum detection and missing values [10, 25]. In the MK test, both the detection test statistics “S” and normalized test (Z) statistics can be achieved [21]. In Eq. (1), the MK test begins with the estimation of the test statistic, S.
$S=\sum_{i=1}^{N-1} \sum_{j=i+1}^N \operatorname{Sgn}\left(X_j-X_i\right)$ (1)
where, N represents the number of data points and Xi is the actual time for a time series of i = 1, 2, 3… N. Assuming (Xj-Xi) =θ, the value of Sgn (θ) is calculated using Eq. (2).
$\operatorname{Sgn}\left(X_j-X_i\right)=\left\{\begin{array}{cll}1 & \text { if } & \left(X_j-X_i\right)>\theta \\ 0 & \text { if } & \left(X_j-X_i\right)=\theta \\ -1 & \text { if } & \left(X_j-X_i\right)<\theta\end{array}\right.$ (2)
If the data points are greater or equal to 10, the S statistic will follow the normal distribution. Meanwhile, the mean of E(S) = 0 and the variance are calculated using Eq. (3), taking tk as the ties of the sample time series.
$\operatorname{Var}(S)=\frac{N(N-1)(2 N+5)-\sum_{k=1}^N\quad t_k\left(t_k-1\right)\left(2 t_k+5\right)}{18}$ (3)
Here, the normalized statistics (Z) is estimated using Eq. (4), where Z falls in a normal distribution with a positive Z representing an increasing trend while a negative Z representing a decreasing trend.
$Z=\left\{\begin{array}{lll}\frac{S-1}{\sqrt{\operatorname{Var}(S)}} & \text { if } & S>0 \\ 0 & \text { if } & S=0 \\ \frac{S-1}{\sqrt{\operatorname{Var}(S)}} & \text { if } & S<0\end{array}\right.$ (4)
Sen’s slope estimator
In order to estimate the true slope, Sen used a non-parametric [16]. This method is used to detect the magnitude of the trend and is estimated using Eq. (5). The slope is the real-time slope of the curve in the figure, which can be expressed in the differential form of horizontal and vertical coordinates, which is more accurate.
$T=\frac{X_j-X_k}{j-k}$ (5)
Here, Xj and Xk represents the data values in j and k where j > k. Hence, the slope of each observation is estimated using Eq. (6). Whereas the median is calculated from N observations of the Sen’s Slope using Eq. (7).
$Q=Q_{\frac{N+1}{2}} \quad$ if $N$ is odd (6)
$Q=\left(\frac{1}{2}\right) Q\left[\frac{N}{2}\right]+Q \quad$ if $N\left[\frac{N+2}{2}\right]$ if $N$ is even (7)
Here, N which represents slope observations is shown as odd numbers, whereas the Q which represents Sen’s Estimator is calculated as Qmed $=\frac{N+1}{2}$, whereas, the Slope estimate for the even observations is calculated as Qmed $=\left[\left(\frac{N}{2}\right)+\left(\frac{N+2}{2}\right)\right] / 2$. In order to achieve the non-parametric slope test, the two-sided test is achieved at 100(1 – α) % of the confidence interval. Therefore, positive or negative Qi is achieved as an upward (increasing) or downward (decreasing) trend [21, 26].
The Mann-Kendall test was used to identify and analyse existing relationships between rainfall, wind speed, and streamflow in the Klip River catchment. Results obtained from the analysis of monthly, seasonal and annual data are summarized in Figure 2. As seen in the figure, February had the highest average monthly streamflow, followed by January and March, with values of 21.04, 18.21, and 13.94 m3/s, respectively, with corresponding rainfall values of 91.44, 126.51, and 101.39 mm and wind speeds of 1.22, 1.44, and 1.03 m/s. While June had the lowest streamflow rate of 0.94, 0.62, and 0.51 m3/s, respectively, with matching rainfall values of 27.25, 14.99, and 11.16 mm and wind speeds of 1.08, 0.99, and 1.27 m/s. Furthermore, wind speed observed the highest average wind speed of 1.79, 1.80, and 1.94 m/s in October, November and December, respectively, while the lowest average wind speed of 0.83 m/s was observed in May. From these results, it is evident that the highest rainfall happened during the summer, while the lowest rainfall occurred during the winter. As a result, summer rainfall leads to increased streamflow, whereas winter rainfall resulted in decreased streamflow. As shown in Figure 2, variations in streamflow, rainfall, and wind speed are important factors in the occurrence of floods in the study area.
Figure 2. Average monthly streamflow, rainfall and wind speed of Klip River catchment
4.1 Average annual streamflow, wind speed and rainfall analysis
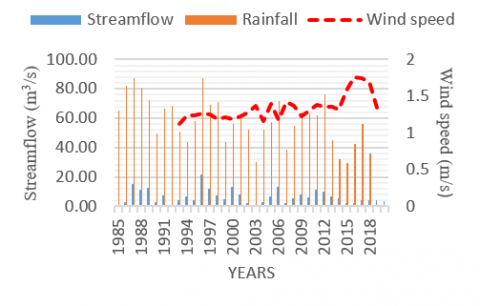
Figure 3 displays the results of an analysis of average annual streamflow, wind speed and rainfall analysis. As seen in the figure, the highest average annual streamflow of 21.72 m3/s was recorded in 1996, the second highest of 14.88 m3/s in 1987, followed by 13.46 m3/s in 2006. The lowest average annual streamflow of 2.38 m3/s was recorded in 2016, followed by 2.15 m3/s in 2007, and 1.21 m3/s in 2003. The highest average annual rainfall of 87.67 mm was recorded in 1996, followed by 87.58 mm in 1987, and 71.40 mm in 2006. The lowest average annual rainfall of 32.08, 30.25 and 29.65 mm was recorded in 2014, 2003 and 2015 respectively. The average annual wind speed in 1996 and 2006 was 1.27 and 1.18 m/s, respectively. The highest average annual wind speed was 1.76 m/s in 2016, with 42.43 mm of rainfall and a streamflow of 2.38 m3/s. In addition, the average wind speed was 1.75 m/s in 2017 and 1.69 m/s in 2018, with 55.83 mm and 35.97 mm of rainfall and a streamflow of 4.09 m3/s and 3.92 m3/s, respectively. These findings highlight that 1987, 1996, 2006, 2012, 2017 and 2018 were the wettest years, whereas 2003, 2014 and 2015 were the driest.
Figure 3. Average annual streamflow, rainfall and wind speed of Klip River catchment
4.2 Monthly streamflow, wind speed and rainfall trend analysis
Table 2. Results of the Mann-Kendall test for monthly average streamflow, rainfall and wind speed
|
Months |
Streamflow (m3/s) |
Rainfall (mm) |
Wind speed (m/s) |
|
January |
-0.43 |
0.73 |
3.45 |
|
February |
-0.60 |
-0.83 |
0.83 |
|
March |
-0.48 |
-2.76 |
1.48 |
|
April |
1.02 |
-3.53 |
1.72 |
|
May |
0.84 |
-4.09 |
1.81 |
|
June |
0.50 |
-3.16 |
2.66 |
|
July |
0.28 |
-2.38 |
-0.76 |
|
August |
-0.03 |
0.61 |
2.08 |
|
September |
-0.25 |
0.40 |
1.42 |
|
October |
-1.39 |
2.27 |
2.14 |
|
November |
-1.51 |
0.85 |
2.18 |
|
December |
-1.62 |
1.88 |
1.38 |
The results of the Mann-Kendall test for monthly streamflow, wind speed, and rainfall trends are shown in Table 2. As seen in the table, rainfall showed a decreasing trend between February and July months, with a significant decrease except for the February month recorded lowest decreasing value of -0.83 mm. During other months, rainfall showed mixed trends, with a minor increase except for October month. Streamflow had a decreasing trend between August and March; however, none were statistically significant except December, which recorded the highest decreasing value of -1.62 m3/s. The months of April, May, June, and July, observed an increasing trend of 1.02, 0.84, 0.50 and 0.28, but none were statistically significant. On the other hand, wind speed showed an increasing trend in all months, except for July month which recorded a minor decreasing trend of -0.76 m/s. In addition, a significant increasing trend of 3.45, 2.66, 2.08, 2.14, and 2.18 m/s was observed during January, June, August, October, and November, with January recording the highest increasing trend. Furthermore, wind speed revealed a combination of a decreasing and an increasing trend in monthly streamflow. For example, a decrease of -0.76 m/s wind speed in July month has resulted in 0.28 m/s, while an increasing trend of 3.45, 0.83, 1.48, 2.08, 1.42, 2.14, 2.18 and 1.38 m/s in January, February, March, August, September, October, November and December has resulted in a decreasing trend of -0.43, -0.60, -0.48, -0.03, -0.25, -1.39, -1.51 and -1.62 in the same months. This implies that changes in the amount of rain as well as changes in wind speed in the study area influence the observed streamflow.
4.3 Seasonal streamflow, wind speed and rainfall trend analysis
Table 3 displays the results of the Mann-Kendall test for seasonal average streamflow, rainfall and wind speed. South Africa has four seasons, and each season lasts for three months. The four seasons is winter (June, July, and August), spring (September, October, and November), summer (December, January, and February), and autumn (March, April, and May). As seen in the table, the Mann-Kendall test revealed a combination of both decreasing and increasing trends in average seasonal streamflow and rainfall, while average wind speed showed an increasing trend in all seasons. At a seasonal scale, streamflow decreased by -1.76 m3/s in spring and -1.19 m3/s in summer, while rainfall increased by 1.32 mm in spring and 0.92 mm in summer. In contrast, wind speed revealed an increasing trend in all seasons, with wind speed values ranging between 2.06 and 3.05 m/s. In addition, wind speed increased by 2.57 and 2.06 m/s in autumn and winter, respectively, while streamflow decreased by 0.09 m3/s in autumn and increased by 0.09 m3/s in winter. During the same seasons (autumn and winter), rainfall significantly decreased by -4.12 and -3.19 mm, respectively.
Table 3. Results of the Mann-Kendall test for seasonal average streamflow, rainfall and wind speed
|
Season |
Streamflow (m3/s) |
Rainfall (mm) |
Wind Speed (m/s) |
|
Annual |
-1.39 |
- 3.05 |
3.68 |
|
Autumn |
-0.09 |
- 4.12 |
2.57 |
|
Winter |
0.09 |
- 3.19 |
2.06 |
|
Spring |
-1.76 |
1.32 |
3.05 |
|
Summer |
-1.19 |
0.92 |
2.61 |
The study's objective was to identify and analyse existing relationships between rainfall, wind speed and streamflow trends in the Klip River catchment. The Mann-Kendall statistical test was used to investigate the relationship between monthly, seasonal and annual trends. Results of this study revealed a combination of decreasing and increasing trends in both streamflow and wind speed trend in the majority of months, while rainfall had an equal combination of both increasing and decreasing trends throughout the year. The average annual rainfall significantly decreased by -3.05 mm, streamflow had a minor decrease of -1.39 m3/s, while wind speed significantly increased by 3.68 m/s. On a monthly scale, streamflow decreased by 0.43 m3/s in January, 0.60 m3/s in February, and 0.48 m3/s in March. January rainfall slightly increased by 0.73 mm, while February and March rainfall decreased by 0.83 mm and 2.76 mm, respectively. Wind speed increased across all four seasons, with average wind speeds ranging from 2.06 to 3.05 m/s. On the basis of these results, the study can conclude that rainfall rather than wind speed has a better relationship with streamflow, meaning that each factor may influence the others. These results would be helpful to decision-makers and hydrologists in the planning and management of flooding in the study area. Finally, it is recommended that a study be conducted on the entire local hydrological responses in the Klip River catchment.
This research has been funded by the University of South Africa and Tshwane University of Technology, while South African Weather Services and Department of Water and Sanitation provided the data used in this research.
[1] Heerspink, B.P., Kendall, A.D., Coe, M.T., Hyndman, D.W. (2020). Trends in streamflow, evapotranspiration and groundwater storage across the Amazon Basin linked to changing precipitation and land cover. Journal of Hydrology: Regional Studies, 32: 100755. https://doi.org/10.1016/j.ejrh.2020.100755
[2] Camera, C., Bruggeman, A., Zittis, G., Sofokleous, I., Arnault, J. (2020). Simulation of extreme rainfall and streamflow events in small Mediterranean watersheds with a one-way-coupled atmospheric–hydrologic modelling system. Natural Hazards and Earth System Sciences, 20(10): 2791-2810. https://doi.org/10.5194/nhess-20-2791-2020
[3] Ramli, I., Basri, H., Achmad, A., Basuki, R.G.A.P., Nafis, M.A. (2022). Linear regression analysis using log transformation model for rainfall data in water resources management Krueng Pase, Aceh, Indonesia. International Journal of Design & Nature and Ecodynamics, 17(1): 79-86. https://doi.org/10.18280/ijdne.170110
[4] Terzi, Ö., Çevik, E. (2012). Rainfall estimation using artificial neural network method. SDU International Journal of Technological Science, 4(1): 10-19.
[5] Pirah, J.A., Roslee, R. (2021). Positive changes in flood mitigation through sand dredging works at Padas River and tributary based on HEC-RAS hydrological modelling. International Journal of Design & Nature and Ecodynamics, 16(4): 451-458. https://doi.org/10.18280/ijdne.160412
[6] Liu, Z., Cuo, L., Li, Q., Liu, X., Ma, X., Liang, L., Ding, J. (2020). Impacts of climate change and land use/cover change on streamflow in Beichuan River Basin in Qinghai province, China. Water, 12(4): 1198. https://doi.org/10.3390/w12041198
[7] Majhi, B., Naidu, D., Mishra, A.P., Satapathy, S.C. (2020). Improved prediction of daily pan evaporation using Deep-LSTM model. Neural Computing and Applications, 32(12): 7823-7838. https://doi.org/10.1007/s00521-019-04127-7
[8] Wasko, C., Nathan, R., Peel, M.C. (2020). Trends in global flood and streamflow timing based on local water year. Water Resources Research, 56(8): e2020WR027233. https://doi.org/10.1029/2020WR027233
[9] Bell, F.G., Mason, T.R. (1998). The problem of flooding in Ladysmith, Natal, South Africa. Geological Society, London, Engineering Geology Special Publications, 15(1): 3-10. https://doi.org/10.1144/GSL.ENG.1998.015.01.01
[10] Chabalala, D.T., Ndambuki, J.M., Salim, R.W., Rwanga, S.S. (2019). Impact of climate change on the rainfall pattern of Klip River catchment in Ladysmith, KwaZulu Natal, South Africa. In IOP Conference Series: Materials Science and Engineering, 640(1): 012088. https://doi.org/10.1088/1757-899X/640/1/012088
[11] Arrieta-Castro, M., Donado-Rodríguez, A., Acuña, G.J., Canales, F.A., Teegavarapu, R.S., Kaźmierczak, B. (2020). Analysis of streamflow variability and trends in the meta river, Colombia. Water, 12(5): 1451. https://doi.org/10.3390/w12051451
[12] Back, L.E., Bretherton, C.S. (2005). The relationship between wind speed and precipitation in the Pacific ITCZ. Journal of Climate, 18(20): 4317-4328. https://doi.org/10.1175/JCLI3519.1
[13] Abeysingha, N.S., Singh, M., Sehgal, V.K., Khanna, M., Pathak, H. (2016). Analysis of trends in streamflow and its linkages with rainfall and anthropogenic factors in Gomti River basin of North India. Theoretical and Applied Climatology, 123(3): 785-799. https://doi.org/10.1007/s00704-015-1390-5
[14] Bahati, M.E., Lawal, A.Q.T., Peter, B.A., Matovu, S. (2019). Stream flow and rainfall trend analysis of the Ssezibwa catchment. Preprints 2019, 2019090168. https://doi.org/10.20944/preprints201909.0168.v1
[15] Lawin, A.E., Manirakiza, C., Lamboni, B. (2019). Trends and changes detection in rainfall, temperature and wind speed in Burundi. Journal of Water and Climate Change, 10(4): 852-870. https://doi.org/10.2166/wcc.2018.155
[16] Malede, D.A., Agumassie, T.A., Kosgei, J.R., Linh, N.T.T., Andualem, T.G. (2022). Analysis of rainfall and streamflow trend and variability over Birr River watershed, Abbay basin, Ethiopia. Environmental Challenges, 7: 100528. https://doi.org/10.1016/j.envc.2022.100528
[17] Zhong, D., Dong, Z., Fu, G., Bian, J., Kong, F., Wang, W., Zhao, Y. (2021). Trend and change points of streamflow in the Yellow River and their attributions. Journal of Water and Climate Change, 12(1): 136-151. https://doi.org/10.2166/wcc.2020.144
[18] Zhao, Y., Zou, X., Liu, Q., Chen, Y. (2019). Impacts of climate variability and human activities on streamflow in the Wanquan River Basin along the east coast of Hainan Island, southern China. Journal of Coastal Research, 35(2): 410-419. https://doi.org/10.2112/JCOASTRES-D-18-00005.1
[19] Krishnan, N., Prasanna, M.V., Vijith, H. (2020). Trend characteristics of rainy days and evaporation at a tropical rainforest region in East Malaysia, Borneo. Earth Sciences Research Journal, 24(3): 305-315. https://doi.org/10.15446/esrj.v24n3.77670
[20] Duethmann, D., Bolch, T., Farinotti, D., Kriegel, D., Vorogushyn, S., Merz, B., Güntner, A. (2015). Attribution of streamflow trends in snow and glacier melt-dominated catchments of the Tarim River, Central Asia. Water Resources Research, 51(6): 4727-4750. https://doi.org/10.1002/2014WR016716
[21] Chabalala, D.T., Ndambuki, J.M., Salim, R.W., Rwanga, S.S. (2021). Analysis of temperature trend in the Klip River catchment, KwaZulu Natal, South Africa. International Journal on Emerging Technologies, 12(1): 148-153.
[22] du Plessis, J., Kibii, J.K. (2021). Applicability of CHIRPS-based satellite rainfall estimates for South Africa. Journal of the South African Institution of Civil Engineering, 63(3): 43-54. http://dx.doi.org/10.17159/2309-8775/2021/v63n3a4
[23] Gadedjisso-Tossou, A., Adjegan, K.I., Kablan, A.K.M. (2021). Rainfall and temperature trend analysis by Mann–Kendall test and significance for rainfed cereal yields in Northern Togo. Sci, 3(1): 17. https://doi.org/10.3390/sci3010017
[24] Sa’adi, Z., Shahid, S., Ismail, T., Chung, E.S., Wang, X.J. (2019). Trends analysis of rainfall and rainfall extremes in Sarawak, Malaysia using modified Mann–Kendall test. Meteorology and Atmospheric Physics, 131(3): 263-277. https://doi.org/10.1007/s00703-017-0564-3
[25] Mallick, J., Talukdar, S., Alsubih, M., Salam, R., Ahmed, M., Kahla, N.B., Shamimuzzaman, M. (2021). Analysing the trend of rainfall in Asir region of Saudi Arabia using the family of Mann-Kendall tests, innovative trend analysis, and detrended fluctuation analysis. Theoretical and Applied Climatology, 143(1): 823-841. https://doi.org/10.1007/s00704-020-03448-1
[26] Shao, G., Guan, Y., Zhang, D., Yu, B., Zhu, J. (2018). The impacts of climate variability and land use change on streamflow in the Hailiutu river basin. Water, 10(6): 814. https://doi.org/10.3390/w10060814