Sri Agustina | Devianti | Ramayanty Bulan* | Muhamad Muslih | Agustami Sitorus
© 2022 IIETA. This article is published by IIETA and is licensed under the CC BY 4.0 license (http://creativecommons.org/licenses/by/4.0/).
OPEN ACCESS
pH is one of the important physical parameters to characterize mango damage because it can indicate changes in the structure and chemical content of the fruit. Thus, the present work evaluated the possibility of NIRs as a rapid and non-destructive tool for measuring the pH properties of intact mango from the cultivar "Arumanis" (Mangifera indica L.) using several algorithms for pre-processing, pre-treatment, and prediction. Three different algorithm predictions, namely principal component regression (PCR), partial least squares regression (PLSR), and support vector machine regression (SVMR), were used and compared to predict the pH of mangos. A total of 16 pre-processing and pre-treatment algorithms are used to support algorithm prediction, and the results are also compared with the raw data spectra. The NIR spectral data used range from 1000 to 2500 nm. Algorithm performance will be evaluated using RMSE, error differences and concluded using RPD. The results show that the prediction of the PLSR algorithm can be performed with an RPD of 8.17, which is more significant than the PCR and SVMR algorithms, which are 1.04, and 1.90, respectively. To support this, pre-processing and pretreatment of the second derivative Savitzky–Golay is the best algorithm that can be used to predict the pH of the whole mango cultivar "Arumanis".
algorithm, agro-product, model, pH, pre-processing, pre-treatment
Mango is one of the most popular agricultural products, especially in Indonesia. The variety cultivated especially in the province of West Java, Indonesia, is the mango with the "Arumanis" variety (Mangifera indica L. var Arumanis). The quality and flavor of the mango "Arumanis" fruit are influenced by maturity and ripeness after harvest [1]. Mango is a climacteric fruit, indicated by the increase in the respiration rate during the ripening period. Generally, the "Arumanis" mango is harvested at hard green maturity.
Naked eyes usually determine the maturity level of the "Arumanis" mango based on physical characteristics such as color and shape. This method may not be accurate due to the lack of color change of this mango cultivar during the ripening process. Some of the chemical components will change during the ripening phase, especially pH [2]. It is considered that the pH at harvest time correlates with the quality and flavor of the "Arumanis" mango. For example, a change in mango texture due to increasing storage time will cause a reaction to change the carbohydrate content component into a sugar component, which in turn causes a change in pH. Determination of pH at harvest time will be significant. However, pH decisions are usually carried out destructively in the laboratory, which is not suitable for fresh handling of the "Arumanis" mango. In addition, the basic thing to avoid over and under the design of kits for detecting the physical and chemical parameters of agricultural products is to perform a series of experiments with various methods that have the potential to produce the best technique [3]. As a result, a non-destructive approach for forecasting the pH of "Arumanis" mangoes is required.
One of the most powerful non-destructive methods is spectroscopy-based technology (near-infrared and infrared). This technology-based instrument can predict certain chemical content in an agricultural product based on vibrations and overtones that occur in the molecular bonds group (O–H, C–H–O, C–O, and so on). Each spectral pattern contributes a different amount of information depending on the chemical composition, cell structure, and physical qualities of the materials. The response of the chemical bonds O–H, C–H, C–O, and N–H is captured in the near-infrared spectrum of an object. These links undergo vibrational energy shifts when scanned with near-infrared and infrared frequencies [4]. However, because near-infrared and infrared alone cannot reveal chemical information in the spectra, chemometrics is required to extract information about quality characteristics from near-infrared and infrared spectra via a process called multivariate calibration, which reveals a mathematical association between the spectra and the measured quality parameter to determine desired quality characteristics.
During the last few decades, several studies have used this spectral-based technology (near-infrared and infrared) and have succeeded in predicting the physical and chemical content of an agricultural product. To construct useful analytical information, numerous types of liquid and solid samples, including coconut milk [5], fruits [6-8], cocoa beans [9-11], coffee beans [12-14], can be analyzed non-destructive by spectral (near-infrared and infrared).
Based on the literature, this paper aims to evaluate the pH of whole mangoes using one technology based on spectroscopy (near-infrared) with optimization of several pre-processing, pre-treatment, and prediction algorithms. In addition, the results of the evaluation with these algorithms will also be compared to find the best model for estimating the pH of whole mangoes of the variety "Arumanis".
2.1 Samples preparation
A total of 79 mango fruits cultivars 'Arumanis' were purchased from local farmers in Indramayu district, West Java provinces, Indonesia. The mangoes were harvested at various harvest ages to obtain variations in pH (105, 98, 91, and 84 days after flowering). In addition, mango fruit was stored for 3, 6, and 9 days after harvesting at ambient temperature conditions. All samples were examined using normal laboratory protocols for spectral data capture and real pH measurement. The NIR spectra of the mango fruit were captured and recorded initially before the pH of each mango sample was determined destructively. Each sample is labeled with a unique number, and the spectra data are scanned to determine the true pH.
2.2 Spectra NIR data acquisition
In this experiment, NIR spectra data in reflectance were acquired using NIRFlex N-500 (fiber optic solid), integrated with the NIRCal 5.2 database. NIR spectra data of all samples were acquired and recorded on wavelength ranges from 1000 nm to 2500 nm with 0.4 nm intervals. NIR scanning set-up using an integrating sphere at 32 scans per acquisition. The operating temperature was adjusted between 25℃ and 30℃ during scanning. The spectra of each intact mango were captured at different points (bottom, middle and top) and averaged.
2.3 Measurement of pH
The reference pH of the mango was determined immediately after spectra collection. Each mango was cut along the same designated lines (bottom, middle, and top) as the NIR acquisition, and the pulp was extracted. Dilution with a ratio of 1:1 was carried out on the pulp samples obtained using distilled water.
2.4 Spectra data pre-processing and pre-treatment
Raw NIR spectra data were pre-processed and pre-treatment by several algorithms to achieve reliability. In general, there are differences in the terminology of pre-processing and pre-treatment on chemometrics. Pre-processing is the activity of transforming raw data into clean data that is ready to be analyzed, where the activities consist of removing baseline and alignment of raw data. Meanwhile, pre-treatment is an activity to transform the pre-processed data to make it suitable for an analysis whose activities include normalization, scaling, transformations, and removing any outliers in the data .
The algorithm for pre-processing and pre-treatment was conducted in the following way: (1) normalize, (2) MSC, (3) SNV, (4) 1st derivative Savitzky–Golay, (5) 2nd derivative Savitzky–Golay, (6) Smoothing Savitzky–Golay, (7) de-trending, (8) Baseline, (9) 1st derivative Savitzky–Golay + MSC, (10) 2nd derivative Savitzky–Golay + MSC, (11) 1st derivative Savitzky–Golay + 2nd derivative Savitzky–Golay, (12) normalize + 2nd derivative Savitzky–Golay, (13) Smoothing Savitzky–Golay + 2nd derivative Savitzky–Golay, (14) de-trending + 2nd derivative Savitzky–Golay, (15) Baseline + 2nd derivative Savitzky–Golay, and (16) 2nd derivative Savitzky–Golay+SNV.
2.5 Calibration and validation model
By utilizing increased spectral data, calibration models for pH prediction were developed. Three different prediction algorithms were compared, i.e., principal component regression (PCR), partial least squares regression (PLSR), and support vector machine regression (SVMR). This study tested modeling by leaving one cross-validation model with ratio data calibration to validation around 80%:10%.
The model's interpretation was determined using the coefficient correlation of calibration and validation, root means square error of calibration (RMSEC), and root means square error of prediction (RMSEP) as specified by . Additionally, the error difference between RMSEC and RMSEP and the ratio of prediction to deviation (RPD) were analyzed using the equation. Determination of the best pH prediction model for whole mangoes in this study focused on the RPD value (Table ). The Unscrambler X 10.1 program was used to conduct the chemometric analysis in this study.
Table 1. RPD evaluation
|
# |
RPD Range |
Categories |
References |
|
1 |
1.5 < RPD < 1.9 |
Possible |
[17] |
|
2 |
2.0 < RPD < 2.5 |
Sufficient |
[18] |
|
3 |
2.5 < RPD < 3.0 |
Good |
[19] |
|
4 |
RPD > 3.0 |
Excellent |
[20] |
3.1 Characteristics of NIR spectral data
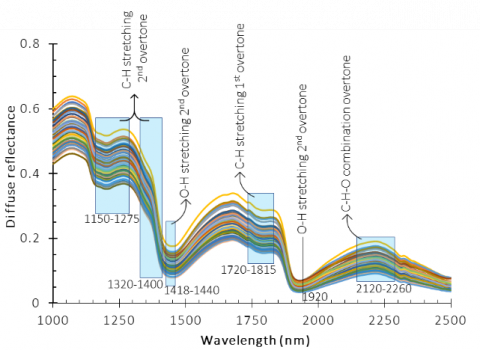
Figure 1 illustrates the near-infrared spectrum of mango samples in the form of diffuse reflectance. These spectral lines indicate the existence of organic materials because they are formed when molecular bonds (O–H, C–H–O, C–O, and so on) interact with incoming radiation. These links are susceptible to fluctuations in vibrational energy, resulting in the formation of two distinct vibration patterns, stretch vibration and bend vibration. It can be seen that the NIR spectral of mango in this study has a diffuse reflectance range of O–H molecular bonds at wavelengths of 1418-1440 nm and 1920 nm due to its tone combination and first overtone. Also, the absorption bands between 2120–2260 nm are related to C–H–O structures such as sugar and vitamin C related to the pH. Organic acids are connected with additional absorption bands at around 1400 nm, 1800 nm, and 2100 nm.
3.2 Model of pH using NIR tandem with PCR algorithm
Our present study developed pH prediction models of mango samples using several pre-treatment algorithm spectra data combined with PCR algorithm. Although the PCR algorithm is reported to perform no better than other chemometric algorithms, this algorithm is worth trying in this study. This study enhanced the spectral data using 16 pre-processing and pre-treatment algorithms and compared them with the raw data (Table 2). There are eight individual pre-processing and pre-treatment algorithms and eight combined pre-processing and pre-treatment algorithms. Additionally, we used coefficient correlation and root means square error to evaluate the performance of each method in this study. In this situation, the optimal RPD index is obtained by combining the 1st derivative Savitzky–Golay method with the PCR algorithm.
Figure 1. Typical Near-infrared spectroscopy signals of intact mango “Arumanis”
Table 2. Prediction performances by PCR algorithm
|
Pre-processing and Pre-treatment |
RMSE-C |
RMSE-CV |
Error difference |
RPD |
|
Original |
0.50 |
0.52 |
0.02 |
1.02 |
|
Normalize |
0.48 |
0.52 |
0.04 |
1.04 |
|
MSC |
0.51 |
0.53 |
0.02 |
1.01 |
|
SNV |
0.51 |
0.52 |
0.01 |
1.01 |
|
SG 1st derivative |
0.47 |
0.50 |
0.03 |
1.04 |
|
SG 2nd derivative |
0.51 |
0.53 |
0.03 |
1.01 |
|
Smoothing SGolay |
0.50 |
0.52 |
0.03 |
1.02 |
|
De-trending |
0.50 |
0.52 |
0.02 |
1.02 |
|
Baseline |
0.50 |
0.52 |
0.02 |
1.02 |
|
SG 1st derivative + MSC |
0.50 |
0.52 |
0.02 |
1.02 |
|
SG 2nd derivative + MSC |
0.49 |
0.52 |
0.03 |
1.03 |
|
SG 1st derivative + SG 2nd derivative |
0.53 |
0.55 |
0.01 |
1.00 |
|
Normalize + SG 2nd derivative |
0.48 |
0.51 |
0.03 |
1.03 |
|
Smoothing SGolay + SG 2nd derivative |
0.51 |
0.53 |
0.02 |
1.01 |
|
De-trending + SG 2nd derivative |
0.51 |
0.54 |
0.03 |
1.01 |
|
Baseline + SG 2nd derivative |
0.51 |
0.54 |
0.03 |
1.01 |
|
SG 2nd derivative + SNV |
0.50 |
0.52 |
0.03 |
1.02 |
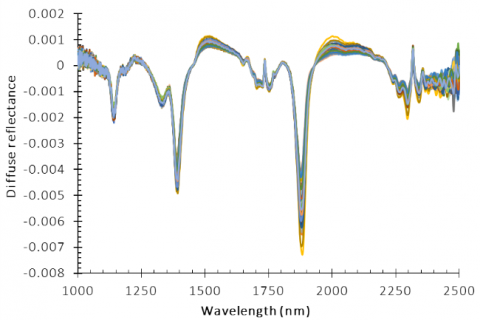
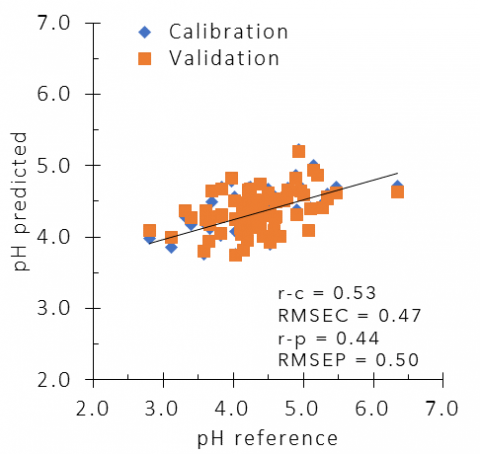
The NIR spectral processed by the pre-treatment algorithm 1st derivative Savitzky–Golay algorithm is presented in Figure 2a. It can be seen that there are peaks of diffuse reflectance in the wavelength range of 1882 nm, 1391 nm, and 1141 nm. Furthermore, using the spectra of the pre-treatment results, the PCR algorithm works to predict the pH, which is presented in Figure 2b. The correlation coefficient resulting from combining the pre-treatment 1st derivative Savitzky–Golay algorithm with the PCR algorithm for calibration and validation is 0.526 and 0.444, respectively. The RMSE generated from the combination of pre-processing and pre-treatment algorithm 1st derivative Savitzky–Golay algorithm with PCR algorithm for calibration and validation is 0.47, 0.50, respectively. RPD index for pH prediction of mangos using PCR algorithm is 1.04, which is categorized as a possible prediction model.
(a)
(2)
Figure 2. (a) Pre-treatment algorithm using SG 1st derivative (b) Reference vs. predicted pH using PCR algorithm
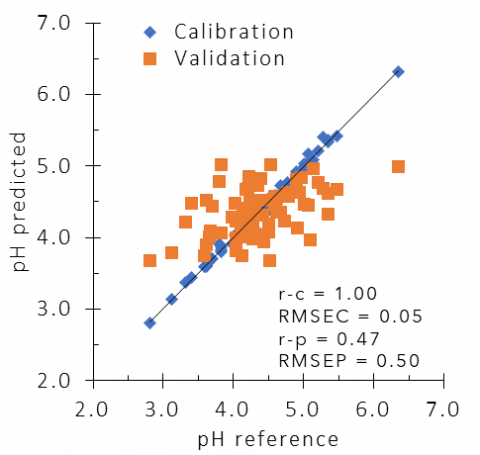
3.3 Model of pH using NIR tandem with PLSR algorithm
Generally, the PLSR method has the benefit of dealing with irrelevant and noisy variables. However, the PLSR algorithm cannot work independently without a pre-processing and pre-treatment algorithm. That's because NIR data spectroscopy has several types of interference that need to be eliminated e.g., disturbing baseline drifts. Munawar et al. [21] reported that using the PLSR algorithm can work well with the help of the SNV pre-treatment algorithm in detecting SSC, TA, and vitamin C from mango compared to other spectra pre-treatment algorithms. However, other pre-processing and pre-treatment algorithms deserve comparison in the study combined with the PLSR algorithm to predict mango fruit pH. The combination of pre-treatment 2nd derivative Savitzky–Golay algorithm with PLSR algorithm gives the best RPD index in this case (Table 3). In addition, Table 3 describes the performance results of several pre-treatment algorithms, which were further executed by the PLSR algorithm to make prediction models. Each of these algorithms has advantages and disadvantages in reducing interference from the spectral data obtained. It can be seen that it is important to trace each pre-treatment algorithm to be able to represent the NIR spectral data.
(a)
(b)
Figure 3. (a) Pre-treatment using SG 2nd derivative (b) Reference vs. predicted pH using PLSR algorithm
Table 3. Prediction performances by PLSR algorithm
|
Pre-processing and Pre-treatment |
RMSE-C |
RMSE-CV |
Error difference |
RPD |
|
Original |
0.49 |
0.52 |
0.03 |
1.02 |
|
Normalize |
0.49 |
0.53 |
0.03 |
1.02 |
|
MSC |
0.38 |
0.49 |
0.11 |
1.18 |
|
SNV |
0.37 |
0.49 |
0.12 |
1.20 |
|
SG 1st derivative |
0.13 |
0.46 |
0.33 |
2.99 |
|
SG 2nd derivative |
0.05 |
0.50 |
0.45 |
8.17 |
|
Smoothing SGolay |
0.49 |
0.53 |
0.03 |
1.02 |
|
De-trending |
0.38 |
0.48 |
0.11 |
1.19 |
|
Baseline |
0.50 |
0.52 |
0.02 |
1.02 |
|
SG 1st derivative + MSC |
0.11 |
0.46 |
0.35 |
3.64 |
|
SG 2nd derivative + MSC |
0.07 |
0.47 |
0.40 |
5.58 |
|
SG 1st derivative + SG 2nd derivative |
0.07 |
0.51 |
0.44 |
5.46 |
|
Normalize + SG 2nd derivative |
0.07 |
0.48 |
0.41 |
5.97 |
|
Smoothing SGolay + SG 2nd derivative |
0.05 |
0.49 |
0.44 |
8.17 |
|
De-trending + SG 2nd derivative |
0.51 |
0.54 |
0.03 |
1.01 |
|
Baseline + SG 2nd derivative |
0.51 |
0.54 |
0.03 |
1.01 |
|
SG 2nd derivative + SNV |
0.07 |
0.48 |
0.41 |
2.22 |
Table 4. Prediction performances by SVMR algorithm
|
Pre-processing and Pre-treatment |
RMSE-C |
RMSE-CV |
Error difference |
RPD |
|
Original |
0.50 |
0.53 |
0.03 |
1.03 |
|
Normalize |
0.46 |
0.51 |
0.05 |
1.06 |
|
MSC |
0.47 |
0.52 |
0.05 |
1.05 |
|
SNV |
0.47 |
0.52 |
0.05 |
1.05 |
|
SG 1st derivative |
0.38 |
0.50 |
0.12 |
1.27 |
|
SG 2nd derivative |
0.34 |
0.52 |
0.19 |
1.61 |
|
Smoothing SGolay |
0.50 |
0.53 |
0.03 |
1.03 |
|
De-trending |
0.45 |
0.51 |
0.06 |
1.08 |
|
Baseline |
0.47 |
0.50 |
0.03 |
1.05 |
|
SG 1st derivative + MSC |
0.36 |
0.50 |
0.14 |
1.34 |
|
SG 2nd derivative + MSC |
0.32 |
0.51 |
0.20 |
1.80 |
|
SG 1st derivative + SG 2nd derivative |
0.34 |
0.53 |
0.19 |
1.56 |
|
Normalize + SG 2nd derivative |
0.31 |
0.51 |
0.20 |
1.90 |
|
Smoothing SGolay + SG 2nd derivative |
0.34 |
0.52 |
0.19 |
1.61 |
|
De-trending + SG 2nd derivative |
0.34 |
0.52 |
0.19 |
1.61 |
|
Baseline + SG 2nd derivative |
0.34 |
0.52 |
0.19 |
1.61 |
|
SG 2nd derivative + SNV |
0.31 |
0.51 |
0.20 |
1.84 |
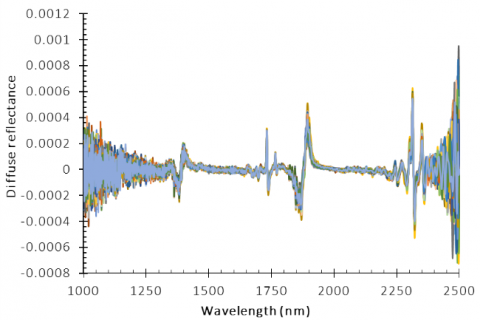
The NIR spectral processed by the pre-treatment algorithm 2nd derivative Savitzky–Golay algorithm is presented in Figure 3a (the color of each line describes all the spectral data measured using the NIR instrument). It can be seen that not always the SNV pre-treatment algorithm combined with the PLSR algorithm can provide the best predictive results for mangoes, in this case, to predict pH. It depends on the physical and chemical properties to be predicted. Furthermore, using the spectra of the pre-treatment results, the PLSR algorithm works to predict pH, which is presented in Figure 3b. The correlation coefficient resulting from combining the pre-treatment 2nd derivative Savitzky–Golay algorithm with the PLSR algorithm for calibration and validation is 0.996 and 0.475, respectively. The RMSE generated from the pre-treatment 2nd derivative Savitzky–Golay algorithm with the PLSR algorithm for calibration and validation are 0.05, 0.50, respectively. RPD index for pH prediction of mangos using PCR algorithm is 8.17, which is categorized as an excellent prediction model.
3.4 Model of pH using NIR tandem with SVMR algorithm
SVMR algorithm is a non-linear chemometric algorithm based on machine learning. In contrast to the PCR and PLSR algorithms called classical algorithms, the SVMR algorithm is a new approach in chemometric methods. The SVMR algorithm deserves to be tried in research because, according to Munawar et al. [21], SVMR will produce more accurate results in predicting the TA content in mangoes. The same pre-treatment algorithms with PCR and PLSR were also applied for comparison purposes. The combination of the pre-treatment Normalize + Savitzky–Golay algorithm 2nd derivative with the SVMR algorithm gave the best RPD index in this case (Table 4). The purpose of data pre-processing is to model the spectra so that the SVM algorithm can establish a good correlation between the spectral and the concentration data. It is proven that the combination of pre-processing Normalize + Savitzky–Golay algorithm 2nd derivative gives the best RPD on the SVMR algorithm. That's because Normalization can eliminate the effect of differences in optical path length in case of transmission measurements, and 2nd derivatives can generate relatively flat spectral so that they can produce the information needed from the functional group bonds that are the target response.
The NIR spectral processed by the pre-treatment Normalize + 2nd derivative Savitzky–Golay algorithm is presented in Figure 4a. Furthermore, using the spectra of the pre-treatment results, the PLSR algorithm works to predict pH, which is presented in Figure 4b. The correlation coefficient resulting from the pre-treatment Normalize + 2nd derivative Savitzky–Golay algorithm with the SVMR algorithm for calibration and validation is 0.922 and 0.413, respectively. The RMSE generated from the pre-treatment 2nd derivative Savitzky–Golay algorithm with the PLSR algorithm for calibration and validation are 0.31 and 0.51, respectively. RPD index for pH prediction of mangos using PCR algorithm is 1.90, which is categorized as a possible prediction model.
3.5 The best algorithm performance for pH prediction
The comparison of the best pH prediction algorithms for mangoes in this study is presented in Figure 5. Based on RMSE, in this research may claim that pH can be estimated reasonably by PCR, PLSR, and SVMR. Previously, it was known that this pH response was predicted to be predictable by NIR spectra which were followed by PCR algorithm on cherry fruit [22], PLSR algorithm on rice wine [23], and SVMR algorithm on pears [24]. However, in this present study, in this research may position the algorithm ranking based on its accuracy of prediction i.e. PLSR > SVMR > PCR. These results indicate that PCR can also predict pH using chemometric methods but is not as good as other chemometric algorithms. In addition, the SVMR algorithm mentioned is based on non-linearity, it still does not show a very significant performance with the PLSR algorithm that is more commonly used. However, these three algorithms must always be considered in future chemometric approaches.
(a)
(b)
Figure 4. (a) Pre-treatment using Normalize + SG 2nd derivative (b) Reference vs. predicted pH using SVMR algorithm
Figure 5. Overview of performance models for pH prediction using a 3-prediction algorithm
The total calibration and validation findings suggest that Near-infrared spectroscopy combined with multiple algorithm pre-processing, pre-treatment, and prediction can be successfully utilized to estimate the pH of mango. The most increased coefficient of correlation for pH prediction of 0.996 in calibration and 0.475 in validation was achieved using pre-treatment 2nd derivative Savitzky–Golay algorithm by PLSR algorithm prediction. PLSR algorithm also provided a more accurate prediction result with an RPD index was 8.17. Further work with more NIRs data spectra coming from the geographical origin and several maturities are needed to enhance the robustness of the pH prediction model.
[1] Sato, M., Ikram, M.M.M., Pranamuda, H., Agusta, W., Putri, S.P., Fukusaki, E. (2021). Characterization of five Indonesian mangoes using gas chromatography–mass spectrometry-based metabolic profiling and sensory evaluation. Journal of Bioscience and Bioengineering, 132(6): 613-620. https://doi.org/10.1016/j.jbiosc.2021.09.006
[2] Quirós-Sauceda, A.E., Sañudo-Barajas, J.A., Vélez-de la Rocha, R., Domínguez-Avila, J.A., Ayala-Zavala, J.F., Villegas-Ochoa, M.A., González-Aguilar, G.A. (2019). Effects of ripening on the in vitro antioxidant capacity and bioaccessibility of mango cv.‘Ataulfo’phenolics. Journal of Food Science and Technology, 56(4): 2073-2082. https://doi.org/10.1007/s13197-019-03685-x
[3] Sitorus, A., Bulan, R. (2020). Non-invasive moisture content measurement system based on the ESP8266 microcontroller. Bulletin of Electrical Engineering and Informatics, 9(3): 924-932. http://dx.doi.org/10.11591/eei.v9i3.2178
[4] Sharma, A., Reva, I., Fausto, R. (2009). Conformational switching induced by near-infrared laser irradiation. Journal of the American Chemical Society, 131(25): 8752-8753. https://doi.org/10.1021/ja903211f
[5] Sitorus, A., Muslih, M., Cebro, I.S., Bulan, R. (2021). Dataset of adulteration with water in coconut milk using FTIR spectroscopy. Data in Brief, 36: 107058. https://doi.org/10.1016/j.dib.2021.107058
[6] Liu, Z., Yang, S., Wang, Y., Zhang, J. (2021). Multi-platform integration based on NIR and UV–Vis spectroscopies for the geographical traceability of the fruits of Amomum tsao-ko. Spectrochimica Acta Part A: Molecular and Biomolecular Spectroscopy, 258: 119872. https://doi.org/10.1016/j.saa.2021.119872
[7] Ruggiero, L., Amalfitano, C., Di Vaio, C., Adamo, P. (2022). Use of near-infrared spectroscopy combined with chemometrics for authentication and traceability of intact lemon fruits. Food Chemistry, 375: 131822. https://doi.org/10.1016/j.foodchem.2021.131822
[8] Torres, I., Pérez-Marín, D., De la Haba, M.J., Sánchez, M.T. (2017). Developing universal models for the prediction of physical quality in citrus fruits analysed on-tree using portable NIRS sensors. Biosystems Engineering, 153: 140-148. https://doi.org/10.1016/j.biosystemseng.2016.11.007
[9] Hernández-Hernández, C., Fernández-Cabanás, V.M., Rodríguez-Gutiérrez, G., Fernández-Prior, Á., Morales-Sillero, A. (2022). Rapid screening of unground cocoa beans based on their content of bioactive compounds by NIR spectroscopy. Food Control, 131: 108347. https://doi.org/10.1016/j.foodcont.2021.108347
[10] Teye, E. (2022). Mini shortwave spectroscopic techniques and multivariate statistical analysis as a tool for testing intact cocoa beans at farmgate for quality control in Ghana. Infrared Physics & Technology, 122: 104092. https://doi.org/10.1016/j.infrared.2022.104092
[11] Hayati, R., Zulfahrizal, Z., Munawar, A.A. (2021). Robust prediction performance of inner quality attributes in intact cocoa beans using near infrared spectroscopy and multivariate analysis. Heliyon, 7(2): e06286. https://doi.org/10.1016/j.heliyon.2021.e06286
[12] Zhu, M., Long, Y., Chen, Y., Huang, Y., Tang, L., Gan, B., Yu, Q., Xie, J.H. (2021). Fast determination of lipid and protein content in green coffee beans from different origins using NIR spectroscopy and chemometrics. Journal of Food Composition and Analysis, 102(2): 104055. http://dx.doi.org/10.1016/j.jfca.2021.104055
[13] Ribeiro, J.S., Salva, T.D.J.G., Silvarolla, M.B. (2021). Prediction of a wide range of compounds concentration in raw coffee beans using NIRS, PLS and variable selection. Food Control, 125: 107967. https://doi.org/10.1016/j.foodcont.2021.107967
[14] Giraudo, A., Grassi, S., Savorani, F., Gavoci, G., Casiraghi, E., Geobaldo, F. (2019). Determination of the geographical origin of green coffee beans using NIR spectroscopy and multivariate data analysis. Food Control, 99: 137-145. https://doi.org/10.1016/j.foodcont.2018.12.033
[15] Ellis, D.I., Brewster, V.L., Dunn, W.B., Allwood, J.W., Golovanov, A.P., Goodacre, R. (2012). Fingerprinting food: current technologies for the detection of food adulteration and contamination. Chemical Society Reviews, 41(17): 5706-5727. https://doi.org/10.1039/c2cs35138b
[16] Pires, F.D.C., Pereira, R.G.F.A., Baqueta, M.R., Valderrama, P., da Rocha, R.A. (2021). Near-infrared spectroscopy and multivariate calibration as an alternative to the Agtron to predict roasting degrees in coffee beans and ground coffees. Food Chemistry, 365: 130471. https://doi.org/10.1016/j.foodchem.2021.130471
[17] Caporaso, N., Whitworth, M.B., Fisk, I.D. (2022). Prediction of coffee aroma from single roasted coffee beans by hyperspectral imaging. Food Chemistry, 371: 131159. https://doi.org/10.1016/j.foodchem.2021.131159
[18] Teye, E., Anyidoho, E., Agbemafle, R., Sam-Amoah, L.K., Elliott, C. (2020). Cocoa bean and cocoa bean products quality evaluation by NIR spectroscopy and chemometrics: A review. Infrared Physics & Technology, 104: 103127. https://doi.org/10.1016/j.infrared.2019.103127
[19] Li, X., Zhang, L., Zhang, Y., Wang, D., Wang, X., Yu, L., Zhang, W., Li, P. (2020). Review of NIR spectroscopy methods for nondestructive quality analysis of oilseeds and edible oils. Trends in Food Science & Technology, 101: 172-181. https://doi.org/10.1016/j.tifs.2020.05.002
[20] Nocita, M., Stevens, A., Noon, C., van Wesemael, B. (2013). Prediction of soil organic carbon for different levels of soil moisture using Vis-NIR spectroscopy. Geoderma, 199: 37-42. https://doi.org/10.1016/j.geoderma.2012.07.020
[21] Munawar, A.A., Zulfahrizal, Meilina, H., Pawelzik, E. (2022). Near infrared spectroscopy as a fast and non-destructive technique for total acidity prediction of intact mango: Comparison among regression approaches. Computers and Electronics in Agriculture, 193: 106657. https://doi.org/10.1016/j.compag.2021.106657
[22] Li, X., Wei, Y., Xu, J., Feng, X., Wu, F., Zhou, R., Jin, J.J., Xu, K.W., Yu, X.J., He, Y. (2018). SSC and pH for sweet assessment and maturity classification of harvested cherry fruit based on NIR hyperspectral imaging technology. Postharvest Biology and Technology, 143: 112-118. https://doi.org/10.1016/j.postharvbio.2018.05.003
[23] Yu, H.Y., Niu, X.Y., Lin, H.J., Ying, Y.B., Li, B.B., Pan, X.X. (2009). A feasibility study on on-line determination of rice wine composition by Vis–NIR spectroscopy and least-squares support vector machines. Food Chemistry, 113(1): 291-296. https://doi.org/10.1016/j.foodchem.2008.06.083
[24] Li, J., Huang, W., Zhao, C., Zhang, B. (2013). A comparative study for the quantitative determination of soluble solids content, pH and firmness of pears by Vis/NIR spectroscopy. Journal of Food Engineering, 116(2): 324-332. https://doi.org/10.1016/j.jfoodeng.2012.11.007