Salah Bezari | Nadia Metidji | Mohamed Lebbi | Salem Merabti | Chutarat Tearnbucha* | Weerawat Sudsutad | Giulio Lorenzini | Hijaz Ahmad | Younes Menni
© 2022 IIETA. This article is published by IIETA and is licensed under the CC BY 4.0 license (http://creativecommons.org/licenses/by/4.0/).
OPEN ACCESS
The physicochemical properties of the soil have an important influence on the climatic optimization of the solar greenhouse and its capacity to store thermal energy used for heating and/or for air conditioning to improve production. Under real conditions of semi-arid climate in the region of Ghardaïa, Algeria experimental measurements for chosen days at different depths to predict the thermal regime of the greenhouse soil, on the base of the meteorological conditions, i.e., air temperature, solar radiation and soil physical properties. Using the differential equation of the thermal conductivity, with applying the boundary limit condition at the soil surface for the energy balance. Consequently, the distribution of soil temperature was determined at different depths, with different time steps. The model prediction results present a good agreement with the experimental data, with a regression coefficient of 0.98 and root mean squared error RMSE 0.349. Moreover, the results showed that the best location for heat storage systems inside the greenhouse is at the subsoil layer at a depth of 70 cm. The analysis showed that the amount of heat storage appears more in wet than dry soil. It has been concluded that there is a significant influence of the soil temperature and moisture on improving the greenhouse microclimate for plants development.
agricultural greenhouse, solar energy, soil, thermal analysis, measurements
Physical and chemical processes in the soil are affected by spatial/temporal changes as well as by soil temperature. The latter is a very important meteorological parameter for transferring thermal energy from soil to the atmosphere and vice versa. Soil temperature is an environmental factor that has an important role in many fields, geology [1], hydrology [2], and environmental studies [3], solar energy applications such as passive heating and building cooling [4], architecture (depth of buildings and drinking water supply networks) [5]. It is, as well, a basic parameter in agricultural applications (depth determination, plant growth, fertilizer degradation, potential evaporation and control of microbiological activities) [6]. Many of these applications require knowledge of the thermal regime of the upper layers to the deeper layers. In the case of agricultural soils, knowledge of soil temperature data is necessary for plant development and inferring the state of the root of cultivated crops, which is generally distributed from 0 to 50 cm of growth [7]. Predicting and controlling greenhouse environmental conditions are essential for the management of crop production and for improving the efficiency of operations and production. Agricultural production requires a good control of the microclimate of the greenhouse through various systems [8, 9]. The main objective of a greenhouse is to provide a favorable environment adapted for different crops, and to protect them from extremely harsh and variable climatic conditions. Furthermore, energy exchanges and temperature distribution at the surface and in the upper layers of the soil are important, both in the field of agriculture, and in their relation to the practical aspects of greenhouse heating. This principle has been the subject of several studies, Therefore, models that accurately predict the influence of these factors, to estimate the thermal behavior of the soil at different depths over time are extremely important. Most greenhouse climate studies, which take into account heat exchanges with the soil, simplify the problem by considering that the soil is of homogeneous and isotropic composition [10]. Tong et al. [11]; Bezari et al. [12] have determinate the climate distribution in a greenhouse considering the dynamic aspect of the soil in unsteady state. Empirical models have been developed from correlations and more complex statistical methods, using time series input parameters based on experimental data [13, 14]. Nevertheless, soil temperature varies in one form or another according to meteorological conditions, such as air temperature and solar radiation, physical parameters of the soil such as surface albedo, water content and texture [15]. While Yanni et al. [16] evaluated the effect of temperature in different soil depths on the decomposition response under a changing climate; it was found that the activation energy is weak in the depths of the soil compared to its surface.
The main goal of this study is to investigate the soil thermal regime influenced by different climatic condition under the greenhouse environment, in the winter period. To predict the soil temperatures for different depths, firstly, one has to predict the effect of solar energy stored in the soil as heat to estimate the best location for the heat storage elements. Simplified equations are presented to determine soil temperatures and time lags as a function of depth. Using the energy balance equation as a boundary condition by incorporating the climatic parameters environmental of the site during varying periods and for different depths. Based on an analysis of daily experimental measurement fluctuations performed at the Unit of Applied Research of Renewable Energies of Ghardaïa.
2.1 Site and climate description
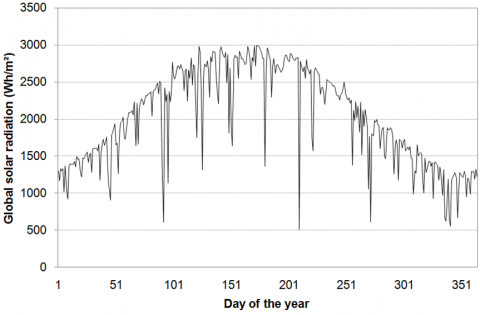
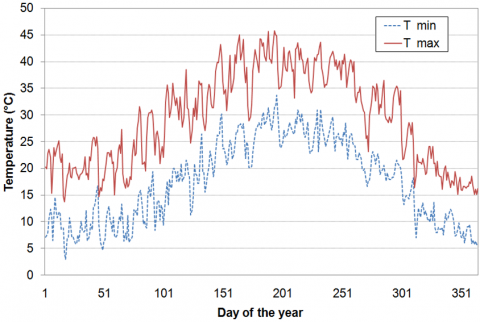
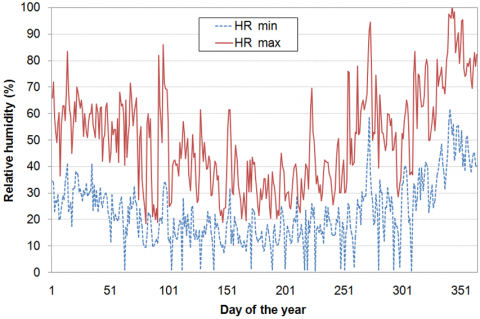
The work presented in this paper was carried out at the URAER (Applied Research Unit for Renewable Energies). It is located 20 km East of Ghardaïa, Algeria (32° 38' N latitude and 3° 81'E longitude at an altitude of 469 m at the mean sea level. Ghardaïa site was considered a semi-arid climate, located in the south of Algeria, about 600 Km far from the capital city. It is characterized by an exceptional sunshine duration of 3000 (hours/year) and the mean annual global solar radiation measured on a horizontal plane that exceeds 6000 (Wh/m²). This promotes the exploitation of solar energy and developing renewable energy technologies in various domains. This region is known by an extremely cold winter due to the winds blowing from snowy highlands; and sandstorms from the southwest in late winter are particularly troublesome. In this part, we presented the solar radiation, temperature and relative humidity evolution for ambient environmental (site of Ghardaïa) during the year. Figure 1 shows the indicated daily average global solar radiation for the entire year of 2017. Daily mean solar radiation values were high during the period 02ndMarch to 17th September. The highest daily mean radiation of 9080 (Wh/m²), was recorded on June 06th. Average daily energy input for the whole year was 21.83 (MJ/m²/day), which agrees with the global solar map [17]. Figure 2 shows the instantaneous temperature evolution during 365-day equivalence of four periodic consideration seasons. We can see that the maximum values may have exceeded 45℃ which corresponds to the minimum values of 30℃ during the summer period. Average values of the minimum and maximum temperatures which are recorded during the winter period reached 5℃ and 10℃ respectively. Figure 3 presents the average relative humidity evolution over the year. The average minimum and maximum relative humidity values for the warmest months are between 10% and 28% respectively. In winter, the maximum relative humidity reaches values exceeding 85% for January and December.
Figure 1. Global solar radiation
Figure 2. Variation of air temperature
Figure 3. Variation of the relative humidity
2.2 Greenhouse system and soil texture
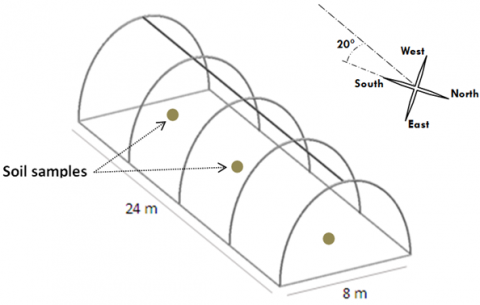
The study was conducted to set tunnel greenhouse for increasing maximally the production area with a heated volume which is estimated to around 442.6 m3 and an area of 24 m long by 8 m wide, with its longest axis aligned in the north-South direction with deviation angle of about 20 deg., towards the west. The greenhouse was covered with a 0.18 mm thick transparent polyethylene film. The ground is considered as a homogeneous and invariable medium, characterized by thermal conductivity, density, and heat capacity. The moisture content of a particular soil will determine the diffusion or storage of water in this soil, be it in a solid form or liquid. According to the particle size distribution of the soil particles, it has been initially proved that the soil is homogeneous through the test of three samples (Figure 4), examined by the apparatus (Garmulometre Lazer Mastersiezer 2000), Institute of Paleontology in Paris, France.
The analyzes result showed that the soil is of sandy loam type with a permeability which increases to 6.94 10-4 cm/s and a thermal diffusivity that equals approximately 1.02 10-6 m²/s if the soil is totally dry. Red sandy loam soils with good drain are ideal for good leaf yield. The optimum temperature requirement is 26-37℃ [18]. The following Table 1 gives the composition of the sandy loam soil.
Figure 4. Position of the samples in the experimental greenhouse
Table 1. Composition of sandy loam soil and thermo-physical properties
|
Particle size % |
Organicmatter % |
Thermal conductivity W/m.k |
Bulkdensity g/cm3 |
||
|
Silt |
Sand |
Clay |
|||
|
55 |
40 |
5 |
2.5 |
1.42 |
2.3 |
2.3 In-Situ measurements
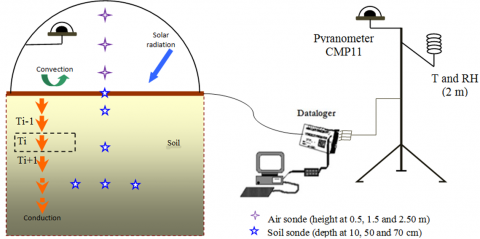
Numerous climate parameters have been systematically measured including the air temperature inside the greenhouse at three heights (50, 150 and 250 cm), on the soil surface, at various depths (10, 50 and 70 cm) and at the same depth 70 cm over similar spaced distances. At the external solicitations: solar irradiance, ambient temperature, etc (Figure 5).
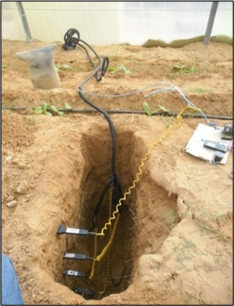
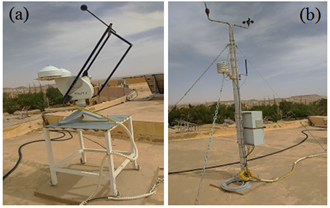
At present, the soil temperature data collection and air temperature inside the greenhouse are mainly obtained through the data acquisition. The acquisition is sent to a computer displaying the measurements made in real time. Using the four-wire PT100 thermal probes buried in the soil (Figure 6), and the other placed in the center of the greenhouse. The global solar radiation transmitted through the cover is measured by a pyranometer fixed just above the soil sat 2 m height. The pyranometer is basically equipped with thermocouples of white and black type of Epply model (model 8-48 serial N° 27037). Another Kipp & Zonen pyranometer type provides the global solar radiation measurements on a horizontal surface outside the greenhouse obtained by Solys2 radiometric station, placed on the roof of the solar radiation Lab (Figure 7a). To access weather data outside the greenhouse, we used the meteorological station installed at the URAER (Figure 7b).
Figure 5. Position of the sensors for the measurement of different climatic parameters
Figure 6. Location of probes at different ground depths (10, 50 and 70 cm) within the greenhouse
Figure 7. Measuring stations at URAER-Ghardaïa, (a) Radiometric station Solys2; (b) Meteorological station
3.1 Thermal regime of soil temperature
The temperature soil model presented in this paper is designed for a bare surface in a solar greenhouse. The ground is a semi-infinite medium limited on its upper face by a plane on which a periodic temperature signal is applied. By neglecting the side effects and the transfer of humidity inside the greenhouse, the equation, (the Fourier heat equation in one dimension), reflecting the thermal evolution of the soil is:
$\frac{\partial T}{\partial t}=a\frac{\partial {{T}^{2}}}{\partial {{z}^{2}}}$ (1)
Used to assess the soil temperature at a given depth. When the surface temperatures and of the inside air of the greenhouse are known. The variation of temperature at the soil surface is supposed to follow a sinusoidal function with an amplitude and an angular frequency of an average value:
${{T}_{ss}}={{T}_{m}}+\Delta T.\sin (\omega .t)$ (2)
In the greenhouse, the soil is considered homogeneous. The surface temperature is sinusoidal by the periodic effect of solar radiation fluxes on it. The analytical solution of equation 3 is suitable for obtaining the temperature as a function of time and depth of soil:
$T(z,t)={{T}_{m}}+{{A}_{s}}.{{e}^{-z\sqrt{\frac{\omega }{2a}}}}.\sin \left( \omega .t-\phi -z\left( \frac{\omega }{2a} \right) \right)$ (3)
where;
T(z,t) is the soil temperature at any depth z and time t (℃),
Tm is the mean annual temperature of the soil (℃),
As is depreciation of the Amplitude,
$\omega$ is the annual angular frequency, $\omega$ = 2π/31536000 (rad/s), and $\varphi$ is the phase angle in radians and corresponds to the time of the year in which the soil surface temperature is minimal [19].
Hence, the annual behavior of the soil is generally identified by the sinusoidal analytical model, taking into account that the required parameters Tm, As, and $\varphi$ have to be obtained, previously. Yet the same model can be used to determine the daily behavior. In this case, As identified to the daily amplitude of the soil surface temperature, Tm agree to the average daily surface soil temperature, $\omega$ is the daily angular frequency and $\varphi$ is the phase angle which corresponds to the time of day when the temperature of the soil surface is minimal [20].
3.1.1 Energy balance at the soil surface
The greenhouse soil constitutes the bulk of the thermal mass and the predominant storage element, due to its large thermal inertia, which tends to stabilize the temperature inside the greenhouse. Badache et al. [19] have analyzed the soil temperature that uses the energy balance equation as a boundary condition. In our case, we treated the bare soil (without vegetation), no evaporation occurs from the soil, so it is certainly the seat of sensible heat by radiation, convection and conduction (Figure 5). The energy balance at ground level takes the following form:
$\text{Q}={{\text{Q}}_{\text{CV}}}+{{\text{Q}}_{\text{SR}}}-{{\text{Q}}_{\text{LR}}}$ (4)
Under the boundary conditions, the energy balance solution will be determined by Eq. (1); two boundary conditions are often used. The rate of heat energy that is conducted from the soil surface to a depth "z" is given as follows [7]:
$\text{Q}=-k{{\left( \frac{\partial T}{\partial z} \right)}_{z=0}}$ (5)
The inside greenhouse soil exchanges heat by convection with the surrounding air and the exchanged convective flow is written as follows:
${{\text{Q}}_{\text{CV}}}={{h}_{CV}}({{T}_{s}}-{{T}_{ai}})$ (6)
${{h}_{CV}}$ is convective heat transfer coefficient, estimated by [21]:
${{h}_{CV}}=1.52{{({{T}_{s}}-{{T}_{ai}})}^{0.33}}$ (7)
The term ${{\text{Q}}_{\text{SR}}}$ represents the direct solar radiation absorbed by the interior soil after transmission through the cover of the enclosure, is given as follows:
${{\text{Q}}_{\text{SR}}}={{\alpha }_{s}}{{\tau }_{c}}I$ (8)
where in Eq. (8) ${{\alpha }_{s}}$ is the soil absorptivity, ${{\tau }_{c}}$is the cover transmittance $I$ is the incident solar radiation. Whereas, the net radiative heat exchange on the soil surface is given as:
${{\text{Q}}_{\text{LR}}}={{h}_{LR}}({{T}_{c}}-{{T}_{s}})$ (9)
${{h}_{LR}}$ is the radiative heat transfer coefficient,
${{T}_{c}}$ is the mean radiant temperature of the surroundings.
3.1.2 Estimated sol-air temperature
The sol-air temperature can be defined as the outside air temperature in the absence of solar radiation, would give the same temperature distribution and rate of heat transfer through roof as exists due to the combined effects of the actual outside temperature distribution plus the incident solar radiation. Sol-air temperature (T*) of the greenhouse ground can be acquired by considering the surface energy balance, by equating radiation gains with surface convective and conductive exchanges. As shown in Eq. (4). Replacing the appropriate analytical expressions for (5), (6), (8), and (9) corresponding to the quantities indicated in the energy balance (4):
$-k{{\left( \frac{\partial T}{\partial z} \right)}_{z=0}}={{h}_{CV}}\left( {{T}_{s}}-{{T}_{ai}} \right)+{{\alpha }_{s}}{{\tau }_{c}}I-{{h}_{LR}}\left( {{T}_{c}}-{{T}_{s}} \right)$ (10)
Eq. (11) shows the benefit of applying the definition of sol-air temperature.
${{\text{T}}^{\text{*}}}={{T}_{ai}}+\frac{\alpha I}{h}-\frac{{{h}_{LR}}}{h}({{T}_{ai}}-{{T}_{c}})$ (11)
where the first term indicates the temperature of the greenhouse air, the second term shows greenhouse soil surface temperature is higher due to absorbed solar radiation and the third term indicates surface temperature reduced due to long-wave radiant cooling.
In order to gauge the accuracy of the temperature profile calculated by the analytic solution (Eq. (3)) are compared to experimental data for a homogeneous soil, it has been programming on Matlab software (R2016a version). The model is initialized with a fixed temperature equal to the mean annual temperature. The simulation is run for seven days with a time step of one hour.
3.2 Heat storage calculations
For a certain amount of soil at a given time, the amount of sensible heat storage can be calculated from the following equation:
$\text{Q}=m.C\left[ {{T}_{i}}\left( t+\Delta t \right)-{{T}_{i}}\left( t \right) \right]$ (12)
The heat capacity of the soil was calculated by the equation:
$C=0.46{{x}_{m}}+0.60{{x}_{o}}+{{x}_{w}}$ (13)
xm, xo and xw are the volume fraction of minerals, organic and water respectively.
A program is implemented on Matlab software in order to resolve the above equation. Knowledge of the depths and the variation of surface temperature is necessary for the program. While the soil surface temperature is measured hourly. The deep soil temperature was assumed to be constant and evaluated to 17℃.
Eq. (12) will be solved by a program written on the Matlab software to calculate the amount of sensible heat storage at different depths as long as the thermal capacity is variable for each depth ranging from 10, 50 and 70cm. Based on the water content in soil, (0.14 and 0.36) we interpreted our results.
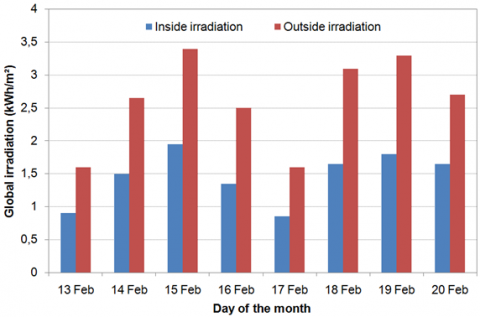
Figure 8 shows the global illumination of selected days for the month of February, measured inside and outside of the experimental greenhouse. The calculation of the total energy flow transmitted through the greenhouse cover involves the transmission coefficient of the blanket material (polyethylene); it is experimentally deduced by the ratio of the overall illumination measured within the greenhouse to that measured outside the greenhouse. It's observed that the transmissivity is low at the beginning of the day and then increases in a progressive manner as the day progresses and vary from 0.61 to 0.72. This corresponds to an increase of the overall illumination. Therefore, the condensation will decrease gradually until it disappears.
The main parameter used in this study is the temperature measured of inside the greenhouse for several constraints. Initially, it is a question of determining the temperatures of the inside environment, and in order to have a representative state, the probe PT100 was placed on the same vertical axis and at to the heights of 2.5 m, 1.5 m and 0.5 m. In this perspective, it has proposed to plot the temperature profiles corresponding to the period from 13th to 20th February 2017 (Figure 9). The results show that whatever the height the curves follow the same pattern with a small error, and the phenomenon of the air temperature stratification is not significant. For this reason, we assume that the temperature distribution in the greenhouse is almost uniform.
Figure 8. Daily global irradiation inside and outside the experimental greenhouse
Figure 9. Air temperature inside the greenhouse at different heights
The next step is to present the evolution of the measured and calculated soil temperatures for different depths: 10 cm, 50 cm and 70 cm. The experimental and theoretical results are shown in Figures 10 and 11 respectively. In this case, the model parameters which are obtained from experimental data indicate a good prediction of the daily soil temperature.
First, it is observed that the curves have a periodic pattern. Secondly, we noted that more the depth increases more the temperature amplitude decreases. However, the difference between the minimum and maximum temperatures decreases with the depth.
Another important aspect is that the difference between the measured soil temperatures at depth and the surface temperatures of the soil increases rapidly with increasing depth. Similarly, it is evident that temperatures are subject to less variation in-depth than at the surface. Variation of temperature at the ground surface induces the propagation of "thermal waves" by conduction in soils. It is thus a problem in the transient mode in which the direction of the thermal flux also changes as a function of time and directed towards the outside of the ground or towards the inside of the ground according to whether the temperature is higher or lower on the surface of the ground than within the ground. These assessments can be justified by the phenomenon of the thermal inertia of the soil. Generally, more the thermal inertia of the soil increases, the maximum temperature reached and the temperature variations are small. That is, it has confirmed that thermal inertia promotes greater temperature stability. In addition, the texture of the soil has a significant influence on the temperatures obtained; more it is compact (dense and solid) the more it phases.
Figure 10. Variation of the soil sub-layer temperature inside the greenhouse at different depths (10cm, 50 cm, 70 cm)
Figure 11. Simulated temperature of the soil at several depths (10cm, 30 cm, 50 cm and 70 cm)
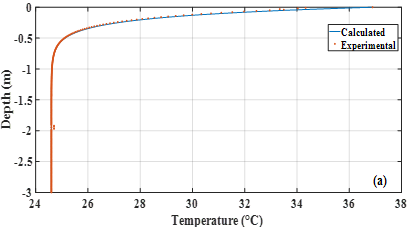
The measurement data that are used as model inputs to evaluate the performance of the model and its accuracy present a good agreement with the model. The R2 value of 0.98 and a reasonable small value of RSME; 0.349, indicate the overall quality of the field measurement at the site is acceptable (Figure 12).
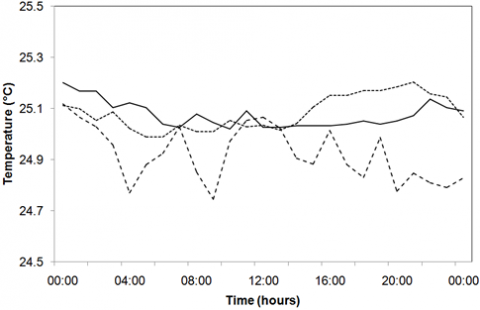
The soil temperature is essential and determining the data in this work. Whereas, energy conservation becomes more and more necessary, soil temperature analysis is an important aspect to determine the best place to install the thermal storage system to heat a greenhouse. In this regard, three PT 100 probes noted (i), (ii) and (iii) were placed in the greenhouse soil (Figure 5) on the same axis so that they have the same depth of 70 cm. Figure 13 shows the evolution of soil temperature under the experimental conditions. According to the plotted curves, we found that the temperatures vary slightly. The maximum temperatures difference; (around 0.38℃), is observed between the data recorded by position (i). However, the variations in these temperatures do not exceed 0.2℃ for the curves of positions (ii) and (iii). Consequently, they can be considered almost constant since the heat transfers through the axis that passes through the probes are not considerable. It can be negligible (no heat transfer) on the same horizontal axis.
(a)
(b)
Figure 12. (a) Comparison of the calculated and measured soil temperature. (b) Nonlinear Regression between experimental and calculated soil temperature curves
Over a period of 24 hours, at a certain depth, the influence of the temperature of the air on the soil surface, while the temperature distribution in the soil is sensitive. Beyond this depth, the temperature is constant and equal to the daily average of the surface temperature. This depth varies according to the thermalcharacteristics of the soil but does not exceed 70 cm. These results confirm the best position of the energy storage system for heating the greenhouse.
Under the semi-arid climate, the soil surface of the greenhouse is subject to cyclical variations in annual or daily atmospheric temperature that induce temperature changes in the soil. This behavioris illustrated by Figure 14, which shows the variations in temperature, namely: the surface of the ground, and the air recorded as a function of time either inside or outside the greenhouse. Indeed, during the day, the temperature on the ground surface is often higher than that in the deep soil due to the solar radiation received and the higher air temperature in the greenhouse. Therefore, a transfer of heat from the surface of the ground to its deep layers is observed, the heat is gradually stored. At night, reverse exchanges occur.
Figure 13. Evaluation of soil temperature inside the greenhouse for the depth of 70cm
Figure 14. Variations the temperatures for a clear sky
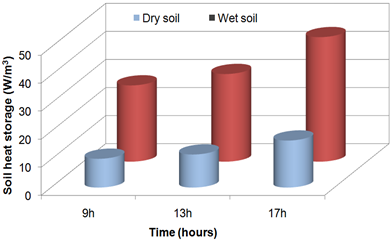
Figure 15. Diurnal heat storage at depth 0-10 cm for dry and wet soil
The greenhouse air temperature is less than the soil surface, due to the absence of solar radiation received by the soil; the soil temperature on depth is higher than that of its surface, the ground then releases the heat it has stored during the day. This propensity to store and release heat depends on the heat capacity of the soil. The higher it is, the greater the heat storage capacity. These results show that soil temperature has a significant influence on improving the climate in the greenhouse.
The variation of daily heat storage at depth 0-10 cm for volumetric moisture contents 0.14-0.35 is shown in Figure 15. The general form that can be clearly seen with these results is a significant increase of the amount of heat storage corresponding to an increase of soil moisture content. The differences 16.92, 19.44 and 27.63 W/m3 represent a significant heat storage throughout the daytime period (9 am, 13 pm and 17 pm respectively) between dry and wet soil of the depth 0-10. The chosen reference temperature directly affects the value of the heat storage, as changes in soil heat capacity are usually related to water flows to and from the surface (moisture content). This phenomenon can be attributed to the thermal conductivity changes.
This article was devoted to an experimental study in order to model the thermal regime of the greenhouse soil under semi-arid climatic conditions of Ghardaïa region. To this reason, the model obtained made it possible to predict the variation of soil temperature as a function of depth and time by means of experimental measurements. The results obtained showed that the soil temperature evaluated by the model and those measured with the sensors provide close good information and perfect correlations. However, a significant increase in the variation of the average daily soil temperature at all depths, due to the increase in air temperature, which greatly contributes to the heat storage capacity that appears more in wet soils than dry.
The variation of soil temperature near the surface increases and decreases at the depths of the lower layers (more than 0.50 m) and after a depth of 0.70 m the soil temperature remains almost constant depending on the type of soil. Whereas, the best location for heat storage systems inside the greenhouse soil is at the 70 cm depth level. Therefore, the proposed model is a positive and valuable tool for estimating the soil temperature determination profile in the context of diverse applications (energy and environmental).
Chutarat Tearnbucha would like to acknowledge financial support by Navamindradhiraj University through the Navamindradhiraj University Research Fund (NURF).
|
As |
depreciation of the Amplitude |
|
a |
thermal diffusivity, m²/s |
|
hcv |
convective heat transfer coefficient, W/m² ℃ |
|
hLR |
radiative heat transfer coefficient, W/m² .℃ |
|
k |
thermal conductivity, W/m.K |
|
I |
incident solar radiation, W/m² |
|
T |
temperature, ℃ |
|
Tc |
mean radiant temperature of the surroundings |
|
Tm |
mean annual temperature of the soil, ℃ |
|
Z |
depth, m |
|
Greek symbols |
|
|
$\alpha$ |
absorptivity |
|
$\tau$ |
transmittance |
|
$\omega$ |
the annual angular frequency, rad/s |
|
$\varphi$ |
the phase angle, rad |
|
Subscripts |
|
|
ai |
air inside |
|
c |
cover |
|
s |
soil |
[1] Müller, N., Kuttler, W., Barlag, A.B. (2014). Analysis of the subsurface urban heat island in Oberhausen, Germany. Climate Research, 58(3): 247-256. https://doi.org/10.3354/cr01195
[2] Genxu, W., Guangsheng, L., Chunjie, L., Yan, Y. (2012). The variability of soil thermal and hydrological dynamics with vegetation cover in a permafrost region. Agricultural and Forest Meteorology, 162: 44-57. https://doi.org/10.1016/j.agrformet.2012.04.006
[3] Choi, I.Y., Nguyen, H.V.M., Choi, J.H. (2017). Effects of controlled environmental changes on the mineralization of soil organic matter. Environmental Engineering Research, 22(4): 347-355. https://doi.org/10.4491/eer.2017.003
[4] Givoni, B. (2007). Cooled soil as a cooling source for buildings. Solar Energy, 81(3): 316-328. https://doi.org/10.1016/j.solener.2006.07.004
[5] Azam, M.H., Morille, B., Bernard, J., Musy, M., Rodriguez, F. (2018). A new urban soil model for SOLENE-microclimat: Review, sensitivity analysis and validation on a car park. Urban Climate, 24: 728-746. https://doi.org /10.1016/j.uclim.2017.08.010
[6] Maia, S.M.F., Gonzaga, G.B.M., Silva, L.K.D.S., Lyra, G.B., Gomes, T.C.D.A. (2019). Soil organic carbon temperature sensitivity of different soil types and land use systems in the Brazilian semi‐arid region. Soil Use and Management, 35(3): 433-442. https://doi.org/10.1111/sum.12508
[7] Huang, F., Zhan, W., Ju, W., Wang, Z. (2014). Improved reconstruction of soil thermal field using two-depth measurements of soil temperature. Journal of Hydrology, 519: 711-719. https://doi.org/10.1016/j.jhydrol.2014.08.014
[8] Radojević, N., Kostadinović, D., Vlajković, H., Veg, E. (2014). Microclimate control in greenhouses. FME Transactions, 42(2): 167-171. https://doi.org/10.5937/fmet1402167R
[9] Bezari, S., Bekkouche, S.M., Benchatti, A. (2021). Investigation and improvement for a solar greenhouse using sensible heat storage material. FME Transactions, 49(1): 154-162. https://doi.org/10.5937/fme2101154B
[10] Bezari, S., Bouhdjar, A., Ait-Messaoudenne, N. (2007). Study of the microclimate of a tunnel greenhouse equipped with water thermal storage system. In Proceeding of International Congress on Renewable Energy and Sustainable Development, May 21-24, 2007, Tlemcen, pp. 307-113, (in French).
[11] Tong, G., Christopher, D.M., Li, B. (2009). Numerical modelling of temperature variations in a Chinese solar greenhouse. Computers and Electronics in Agriculture, 68(1): 129-139. https://doi.org/10.1016/j.compag.2009.05.004
[12] Bezari, S., Amine Bekkouche, S.M.E., Benchatti, A., Adda, A., Boutelhig, A. (2020). Effects of the rock-bed heat storage system on the solar greenhouse microclimate. Instrumentation, Mesures, Métrologies, 19(6): 471-479. https://doi.org/10.18280/i2m.190608
[13] Staniec, M., Nowak, H. (2016). The application of energy balance at the bare soil surface to predict annual soil temperature distribution. Energy and Buildings, 127: 56-65. https://doi.org/10.1016/j.enbuild.2016.05.047
[14] Tabari, H., Hosseinzadeh Talaee, P., Willems, P. (2015). Short‐term forecasting of soil temperature using artificial neural network. Meteorological Applications, 22(3): 576-585. https://doi.org/10.1002/met.1489
[15] Kunah, O.M., Zhukov, O.V., Zelenko, Y.V., Fedushko, M.P., Babchenko, A.V., Sirovatko, V.O. (2019). The temporal dynamics of readily available soil moisture for plants in the technosols of the Nikopol Manganese Ore Basin. Biosystems Diversity, 27(2): 156-162. https://doi.org/10.15421/011921
[16] Yanni, S.F., Diochon, A., Helgason, B.L., Ellert, B.H., Gregorich, E.G. (2018). Temperature response of plant residue and soil organic matter decomposition in soil from different depths. European Journal of Soil Science, 69(2): 325-335. https://doi.org/10.1111/ejss.12508
[17] Elhassa, Z.A., Moh Zain, M.F., Sopian, K., Awadalla, A. (2011). Design of hybrid power system of renewable energy for domestic used in Khartoum. Journal of Applied Sciences, 11(12): 2270-2275. https://doi.org/10.3923/jas.2011.2270.2275
[18] Salikutty, J., Peter, K.V., Divakaran, M. (2012). Curry leaf. In Handbook of Herbs and Spices (pp. 260-274). Woodhead Publishing.
[19] Badache, M., Eslami-Nejad, P., Ouzzane, M., Aidoun, Z., Lamarche, L. (2016). A new modeling approach for improved ground temperature profile determination. Renewable Energy, 85: 436-444. https://doi.org/10.1016/j.renene.2015.06.020
[20] Naranjo-Mendoza, C., Wright, A.J., Oyinlola, M.A., Greenough, R.M. (2018). A comparison of analytical and numerical model predictions of shallow soil temperature variation with experimental measurements. Geothermics, 76: 38-49. https://doi.org/10.1016/j.geothermics.2018.06.003
[21] Joudi, K.A., Farhan, A.A. (2015). A dynamic model and an experimental study for the internal air and soil temperatures in an innovative greenhouse. Energy Conversion and Management, 91: 76-82. https://doi.org/10.1016/j.enconman.2014.11.052