Rahmat Safe’i* | Arief Darmawan | Anie Rose Irawati | Agung Yoga Pangestu | Elmo Rialdy Arwanda | Ahmad Nizam Syahiib
© 2022 IIETA. This article is published by IIETA and is licensed under the CC BY 4.0 license (http://creativecommons.org/licenses/by/4.0/).
OPEN ACCESS
One of the indicators in achieving the goal of sustainable forest management is maintaining forest health. Forest health can describe the good and bad conditions of forest management. Management is carried out based on the functions owned by the forest. With these different managements, there is a need to assess and map the current state of forest health across various parts. This study aimed to obtain values of forest health status in each plot for different forest functions and generate a cluster map of forest health status in other forest functions. This study was on three types of forest based on their functions: conservation forest, production forest, and protection in Lampung Province. The method used is the Forest Health Monitoring (FHM). Method to determine the health of forests using indicators of vitality, productivity, and biodiversity and using Web-GIS to create a map of the distribution of cluster plots. The sample plot used is in the form of cluster plots, with the number of each forest function is divided into 3 clusters whose status is categorized as good, moderate, and bad. Based on the research, it was found that the protected forest cluster 1 had bad health status, cluster 2 was good, and cluster 3 was moderate. The overall health condition of the production function is bad, and the forest health status of the conservation forest function is all good. The current distribution map of the forest's sanitary conditions for the three localities helps guide management decisions to be made soon. The conclusion obtained from this study is that existing forest functions influence forest health status because forest management is adjusted to forest functions so that each function has a different status of forest health conditions.
forest health, forest function, sustainable forest
Lampung Province has forests classified as complete functions, namely protected forests, conservation forests, and production forests. Currently, rapid growth is consuming many resources and increasing pressure on the environment [1], especially forest ecosystems. Each forest has different conditions. This condition is influenced by way of forest management, which will also have an impact on whether the forest is sustainable or not. According to Safe’i et al., [2], sustainable forest management aims to maintain the health of the forest. Forest health serves as forest management recommendations and foundations for forest sustainability. Therefore, monitoring forest health is vital for long-term forest management [3].
Forest health is determined by evaluating existing vitality, productivity, site quality, and biodiversity indicators. The Forest Health Monitoring (FHM) method was used to measure the health status of the forest. USDA introduced FHM as a condition monitoring method for monitoring forest health [4]. This method is one of the methods that begins with determining the sampling index of the forest to look for its health status. In addition, FHM can assist in providing management recommendations to forest managers, thus applying the principles of forest sustainability [5].
In the FHM method, the type of plot used is cluster-plot. Previously, the distribution of conditions in each cluster plot in various areas had never been mapped, so it became a significant problem in the implementation of monitoring forest conditions. A map of the distribution of forest health status is needed. The data can show the health status of forests in various functions in Lampung Province. Through this data, it can also be seen whether there is an effect of the forest having a different position with the forest health status. Based on this, a map is needed that indicates the distribution of the current state of forest health monitoring. In many countries, it is essential to regularly monitor forest health because information on the health of forest ecosystems has become an indicator of sustainable forest management [6].
This research is needed for policymakers to explain and provide an overview related to forest health conditions in forest types based on their functions so that further analysis can be carried out on how changes and trends that may occur in the land. This study will analyze various statuses of forest health conditions across multiple forest functions. This study aimed to obtain a value for the condition of forest health status in each cluster plot on forest types based on their function and produce a map of the distribution of clusters in various types of forest functions.
This is because monitoring forest conditions is essential in obtaining accurate data in order to achieve sustainable forest management [7]. In addition, this research will map the distribution of forest health. Therefore, it is expected that the distribution and health status of forests according to various forest functions can be known through this study. In addition, this research can be used as a reference for users of information, both researchers and related stakeholders.
The implementation of this research used in data collection, namely a compass, GPS, location maps, hagameter, calipers, hand counter, roll meter, tape meter, tally sheet, and stationery, while data processing equipment is computer and Microsoft Excel and ArcGIS software. The location of this research is in mixed forests based on their function, namely conservation forest in Cilimus Village, Teluk Pandan District, Pesawaran Regency, Production Forest in Buana Sakti Village, Batanghari District, East Lampung Regency, and protected forest in Beringin Jaya Village, Gisting District, Tanggamus Regency. This location was chosen to meet the criteria that became the focus of the study.
Forest health measurement plots were constructed according to the design of the Forest Health Monitoring (FHM) method [8]. FHM is a monitoring method used to identify and identify forest health conditions measured in clusters, with four measurement plots in one cluster [9]. This method aims to provide information related to forest conditions at a specific time and assess forest ecosystems' status and condition. The basis for monitoring and measuring this method is three forest ecological indicators, including vitality, productivity, and biodiversity [10]. Determination of measurement area according to forest function. This study uses a cluster analysis method in which the cluster plots are made to measure and take several research objects from the entire observed area [11]. Cluster analysis groups observations into clusters based on several values and variables. This analysis can maximize the similarity between individuals in the same cluster and other plot clusters [12]. The clustering of FHM forest plots for various forest functions is nine clusters (36 plots), namely each of the three clusters of plots in production forest, conservation forest, and protection forest. The design of the FHM forest health cluster for various forest functions in Lampung Province is shown in Figure 1.
Figure 1. Cluster plot design
Final data on forest health is obtained by measuring the forest environmental health index using the FHM method [13]. According to the development of forest health insurance quality indicators for each forest function, forest health is calculated as an ecological indicator. Measurement of forest health in various forest functions based on the FHM method. The creation of a cluster map of the forest health status plot begins with obtaining the coordinates of the location of the plots in various forest functions using a GPS tool. Then the coordinate data is exported to data processing software. The coordinate information is adjusted to the format owned by the software. In this case, the software used is ArcGIS. The next step is to overlay the plot coordinate data with administrative maps and Lampung Forest maps.
Data processing and analysis were carried out on the measurement results of forest health indicators in various forest types. The data that is processed and analyzed is based on the measurement of environmental forest health indicators, namely: data processing and analysis based on the measurement of tree Community Forest Plantation (HTR) health indicators can describe parameters of the current tree growth rate, can be measured through a basic area (LBDs), which can be used in interpreting productivity levels [5].
LBDs are an indicator of productivity. The use of LBDs to determine and calculate the growth of individual trees. The LBDs parameter is not difficult to measure and has an accurate consistency [4]. LBDs value can use the following formula:
LBDs = ¼ X π X d2 (1)
Furthermore, tree damage (Cluster plot Level Index-CLI) and crown condition (Visual Crown Ratio-VCR) were used to determine vitality indicators [14]. Tree damage was analyzed based on the damage index (IK) for each tree (TLI), which was then identified the level of damage in each plot (PLI) and identified the level of damage in each cluster (CLI). The equation that can be used to measure the level of tree damage is as follows [15]:
$\mathrm{TLI}=[\mathrm{IK} 1]+[\mathrm{IK} 2]+[\mathrm{IK} 3]$ (2)
$\mathrm{PLI}=\frac{\sum \text { TLI in the plot }}{\sum \text { Tree in the plot }}$ (3)
$\mathrm{CLI}=\frac{\sum \mathrm{PLI}}{\sum \mathrm{Plot}}$ (4)
The condition of the crown was analyzed based on the level of the VCR. The value of the VCR was obtained from assessing the five parameters of the crown condition [15, 16].
In addition, for indicators of flora and fauna species diversity, the Shannon-Whiener (H') species diversity index is used. The formula for the Shannon-Whiener (H') species diversity index that can be used is as follows:
H’ = -∑ pi.ln.pi (5)
Forest health assessed for unequal forest functions is calculated from the final value of forest health status for unequal forest functions. The end of the value of forest health status is the result of multiplication between the weight values and the respective parameter scores on each forest health indicator in different forest functions. Eq. (1) is the final value of forest health. Through formula 6, it can be seen that NKH is the final value of forest health status, NT is the parameter weight value of each forest health indicator, and NS is the parameter score of each forest health index.
NKH = ∑(NT x NS) (6)
The weighted value is expressed in the form of eigenvalues obtained using the Analytic Networking Process (ANP) method [10]. The score is obtained by transforming the value of each parameter of the forest health ecological indicator into other forest features.
Meanwhile, according to references [17, 18], the weighted values of forest health indicators for various forest functions can be seen in Table 1.
Table 1. Value weighted across various forest functions
|
Forest Type |
LBDs |
CLI |
VCR |
H’ |
|
Conservation Forest |
- |
0.10 |
0.10 |
0.48 |
|
Production Forest |
0.24 |
0.23 |
0.27 |
0.15 |
|
Protection Forest |
- |
0.25 |
0.25 |
0.15 |
3.1 Health condition status of conservation forest
Forest health in conservation forests is obtained by looking for the value of each indicator, namely vitality and biodiversity. The results of these measurements are presented in Table 2.
Table 2. Value score of conservation forest health indicators
|
Plot Cluster |
Score Value |
||
|
CLI |
VCR |
H’ |
|
|
1 |
2.61 |
2.98 |
0.76 |
|
2 |
2.87 |
3.10 |
1.01 |
|
3 |
2.19 |
2.96 |
0.89 |
Table 3. Status value and category of conservation forest health condition
|
Plot Cluster |
Final Value of Conservation Forest Health |
Forest Conservation Health Category |
|
1 |
5.95 |
Good |
|
2 |
4.18 |
Good |
|
3 |
4.00 |
Good |
Based on the calculations interpreted in Table 2, the lowest CLI value is owned by cluster plot 3, followed by cluster plot one, and the highest is owned by cluster plot 2. The different CLI values are influenced by factors that also influence them. Types of tree damage are damage that interferes with plant growth, the symptoms of which can be ascertained through the shape, size, color, and texture [19, 20]. For the minimum VCR value, cluster plot three is followed by cluster plot 1, and the highest is cluster plot 2. The low value of VCR is indicated by low forest cover in conservation forest, and conversely, the high value of VCR indicates higher forest cover. According to [21], crown quality also impacts forest vitality because crown quality can play a role in photosynthesis that occurs in each tree. As for the diversity value, the lowest value was owned by plot 1, followed by plot 3, and the highest was plot 2. Plot 2, which had the highest H' value, showed that the diversity of tree species contained in the plot was classified as high. The value of each indicator is then multiplied by the weight value of each forest function. The multiplication results indicate the state of forest health. The data and value of the health condition of the conservation forest are presented and can be seen in Table 3.
The results of the calculation of the final value of the health status of the protected forest, it can be seen that cluster plot 1 scores 5.95, which is included in the high-quality category, and cluster 2 gets a value of 4.18 points, which is also included here, in a good category. This is due to the high value of each indicator. The results in Table 2 are based on the sum of the multiplication values between the forest ecology indicator parameters and the parameter weight values. The categorization in Table 3 is obtained based on the range of values (Likert scale), the highest and lowest final scores from the three clusters of observation plots. So that the results of the cluster-plot category are obtained in the table above. Besides that, forest management in the function of conservation forest is limited by regulations that do not require managers to maintain existing biodiversity. In terms of productivity, conservation forest managers are also not allowed to harvest wood on their cultivated land to maintain its availability. Cultivators may only harvest Multy Purpose Tree Species (MPTs) or Non-Timber Forest Products (NTFPs). NTFPs can be defined as derivative products of forest products other than wood, whether biological, vegetable, or animal [22]. With the preservation of this forest, the life that is supported by its existence can be maintained.
3.2 Health condition status of production forest
Forest health in production forests is obtained by looking for the value of each indicator, namely productivity, vitality, and biodiversity. The results of these measurements are presented in Table 4.
Table 4. Value score of production forest health indicators
|
Plot Cluster |
Score Value |
|||
|
LBDs |
CLI |
VCR |
H’ |
|
|
1 |
442.19 |
2.00 |
2.90 |
0 |
|
2 |
500.55 |
2.50 |
2.30 |
1.7 |
|
3 |
943.32 |
2.50 |
3.00 |
2.1 |
In the conservation forest, the highest LBDs value is in cluster plot 3. Cluster plot 3 contains various plants because, in this cluster plot, the cropping pattern used is agroforestry. The tree that became the research sample has a large diameter, so that the results of the LBDs value are the highest. The smallest LBDs values are in cluster plot 1. The CLI values for cluster plots 2 and 3 have the same value of 2.50, whereas for cluster 1 it is 2.00. The highest VCR value is owned by cluster plot 3, and the lowest is owned by cluster plot 1. The highest diversity value, or can be called H`, is owned by cluster plot 3, the lowest is owned by cluster plot 1, and the value is 0. This is caused by the cropping pattern belonging to the cluster. Plot 1 is monoculture. This is consistent with the statement [23] that factors that can affect population numbers include environmental conditions, food availability, the presence of predators, and human activities. The value of the health condition of the production forest can be seen in Table 5.
The results of calculating the final status of health conditions in production forests show that all clusters have a bad category. This is because the existing production forest has a relatively low score. Bad management of production forests affects forest health. However, production forests that can be used for timber or non-timber forest products are believed to have the ability to improve the economic welfare of the surrounding community if managed properly [24].
Table 5. Status value and category of production forest health condition
|
Plot Cluster |
Final Value of Production Forest Health |
Production Forest Health Category |
|
1 |
3.20 |
Bad |
|
2 |
3.64 |
Bad |
|
3 |
3.42 |
Bad |
3.3 Health condition status of protection forest
Forest health in protection forests is obtained by looking for the value of each indicator, namely productivity, vitality, and biodiversity. The results of these measurements are presented in Table 6.
Table 6. Value score of protection forest health indicators
|
Plot Cluster |
Score Value |
||
|
CLI |
VCR |
H’ |
|
|
1 |
4.94 |
2.50 |
0.77 |
|
2 |
4.83 |
3.25 |
1.41 |
|
3 |
3.26 |
3.08 |
0.55 |
While the smallest value is owned by plot cluster 1, whereas for CLI results, the highest values are in graph cluster 1, high CLI values indicate a lot of damage. Damage to trees can be caused not only by environmental factors but also by various causes [25], such as destructive activities of humans and animals and attacks of pests and diseases. This part of the protected forest has the most significant VCR value owned by cluster plot 2 with a value of 3.25, and the smallest is owned by cluster plot 1 with a value of 2.50. The largest share of diversity is owned by cluster plot 2, while the smallest is owned by cluster plot 3. High diversity indicates that the forest can still carry out ecosystem functions well. The final value of protected forest can be seen in Table 7.
Table 7. Status value and category of protection forest health condition
|
Plot Cluster |
Final Value of Protection Forest Health |
Forest Protection Health Category
|
|
1 |
2.34 |
Bad |
|
2 |
8.79 |
Good |
|
3 |
5.36 |
Moderate |
From the calculation results in Table 7, the final value of the health status of the protected forest varies. In cluster 1, the plot has a bad value (2.34). Cluster 2 is good (8.79), and cluster 3 is moderate (5.36). Various factors influence the health status of the protected forest. One of the factors is how the forest is managed. Hence the need for forest management that prioritizes forest sustainability. According to the statement of [26], Although the success of sustainable forest management is still not determined by the number of funds allocated to these activities, it is highly dependent on the participation and engagement of the community. They can use forest resources for their daily needs and generate significant income [27, 28]. According to [29], The benefits that humans feel come directly or indirectly from all forest ecosystem functions.
3.4 Map of distribution of forest health status in various forest functions
In the conservation forest, all the cluster plots have good status, which is shown in the green plan. Good forest management is one of the factors that make this forest status good. Limitations in conservation forests have a positive effect on its status. The distribution map of the health status of the conservation forest can be seen in Figure 2.
Figure 2. Distribution map of conservation forest health conditions
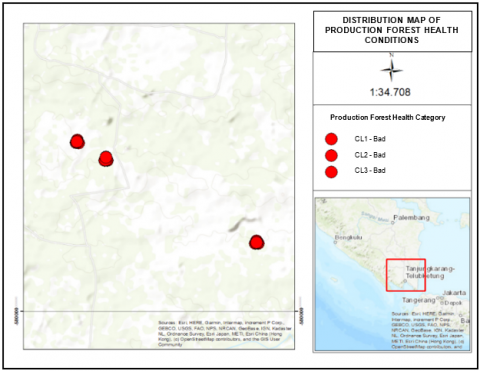
Distribution map of production forest health conditions can be seen in Figure 3. All clusters that are sampled have bad status. The red cluster color indicates this.
Figure 3. Distribution map of production forest health conditions
Production is a forest that has the function of producing wood as the main component of forest products. This forest is managed intensively to ensure the productivity of its products. The overall land use found is generally livelihood-oriented and economically oriented [29]. However, the impact of this is the condition of their health status. In addition, the distribution map of the health status of the protected forest can be seen in Figure 4.
Figure 4. Distribution map of protected forest health conditions
Figure 4 shows the distribution of the cluster plots of the health status of the protected forest. On the map, it can be seen that there are various statuses, namely bad, which is marked with a red cluster color. At the same time, those in yellow and green indicate good status. the various statuses provide a reference for decisions that need to be taken in order to improve forest conditions. In addition, good management is indicated by good status conditions, so it is necessary to improve the management of this protected forest.
The health status of forests for different functions of forests is different. In conservation forests, forest health status is good. In the protected forest, the status of the good forest is in cluster two, cluster one is bad, and plot 3 is moderate. Meanwhile, the overall health status of production forests is classified as bad. The distribution of each health condition status is shown in color. Red indicates the cluster has a bad status, yellow is moderate, and green is good.
Based on the results obtained, it is necessary to do more repairs on forests that are categorized as bad. The results of this study can be used as a reference in policy design in decision making on the implementation of forest management in various types of forest so that it becomes the primary key in leading to sustainable forests management to further analyze changes and trends that may occur in forest health conditions.
[1] Zhu, L., Zhang, H., Liao, H., Peng, R. (2020). Evaluation of ecological sustainability in Chongqing, China based on 3D ecological footprint model. International Journal of Design & Nature and Ecodynamics, 15(1): 89-96. https://doi.org/10.18280/ijdne.150112
[2] Safe’i., R., Latumahina, F.S., Dewi, B.S., Ardiansyah, F. (2021). Short communication: Assessing the state and change of forest health of the proposed arboretum in Wan Abdul Rachman Grand Forest Park, Lampung, Indonesia. Biodiversitas, 22(4): 2072-2077. https://doi.org/10.13057/biodiv/d220456
[3] Puspita, E.N., Safe’i, R., Kaskoyo, H. (2021). Forest health study in efforts to preserve community forest agroforestry patterns in Kubu Batu Village, Gedong Tataan District, Pesawaran Regency, Lampung Province. IOP Conf. Ser. Earth Environ. Sci., 886(1): 1-7. http://dx.doi.org/10.1088/1755-1315/886/1/012075
[4] Rochmah, S.F., Safe’i, R., Bintoro, A., Kaskoyo, H., Rahmat, A. (2021). The effect of forest health on social conditions of the community. IOP Conf. Ser. Earth Environ. Sci., 739: 012016. http://dx.doi.org/10.1088/1755-1315/739/1/012016
[5] Arwanda, E.R., Safe’i, R. (2021). Assessment of forest health status of Panca Indah Lestari Community Plantation Forest (case study in Bukit Layang Village, Bakam District, Bangka Regency, Bangka Belitung Province). IOP Conf. Ser. Earth Environ. Sci., 918(1): 012031. http://dx.doi.org/10.1088/1755-1315/918/1/012031
[6] Safe’i, R., Ardiansyah, F., Banuwa, I., Yuwono, S., Maulana, I., Muslih, A. (2021). Analysis of internal factors affecting the health condition of mangrove forests in the coastal area of East Lampung Regency. IOP Conference Series: Earth and Environmental Science, p. 9. https://doi.org/10.1088/1755-1315/912/1/012070
[7] Maulana, I., Safe’i, R., Rochmah, S.F. (2021). Analysis of the vitality of the Agathis dammara tree at Situ Gunung Resort, Gunung Gede Pangrango National Park. IOP Conference Series: Earth and Environmental Science, p. 7. https://doi.org/10.1088/1755-1315/912/1/012071
[8] Mangold, R. (1997). Forest Health Monitoring: Field Method Guide (New York: USDA Forest Service).
[9] Safe’i, R., Maulana, I.R., Ardiansyah, F., Banuwa, I.S., Harianto, S.P., Yuwono, S.B., Apriliyani, Y. (2022). Analysis of damage to trees in the coastal mangrove forest of East Lampung Regency. International Journal of Sustainable Development and Planning., 17(1): 307-312. https://doi.org/10.18280/ijsdp.170131
[10] Saaty, T.L. (2003). Decision-making with the AHP: Why is the proncipal eigenvector necessary. European Journal of Operational Research, 145: 85-91.
[11] Anwar, P.S., Safe’i, R., Darmawan, A. (2021). Landscape characteristics on forest health measurement plots in several forest functions. IOP Conf. Series: Earth and Environmental Science, p. 10. https://doi.org/10.1088/1755-1315/950/1/012101
[12] Harlyan, L.I., Sambah, A.B., Iranawati, F., Ekawaty, R. (2021). Klasterisasi spasial keragaman spesies tuna di perairan selatan jawa. J. Perikan. Univ. Gadjah Mada., 23(1): 9-16. https://doi.org/10.22146/jfs.58917
[13] Safe’i, R., Darmawan, A., Kaskoyo, H., Rezinda, C.F.G. (2021). Analysis of changes in forest health status values in conservation forest (Case study: Plant and animal collection blocks in Wan Abdul Rachman Forest Park (Tahura WAR)). J. Phys. Conf. Ser., 1842(1). https://doi.org/10.1088/1742-6596/1842/1/012049
[14] Safe’i, R., Hardjanto, Supriyanto, Sundawati, L. (2014). Value of vitality status in monoculture and agroforestry planting systems of the community forests. Int. J. Sci. Appl. Res., 18(2): 340-353.
[15] Puspita, E.N., Safe’i, R., Kaskoyo, H., Hilmanto, R. (2021). Penilaian indikator kesehatan hutan rakyat pada pola tanam agroforestri Indones. J. Conserv., 10(1): 27-33. https://doi.org/10.15294/ijc.v10i1.28894
[16] Darmawan, R. (2014). Penilaian Kondisi Kesehatan Tegakan di Areal Pasca Tambang PT Antam Tbk UBPE Pongkor, Jawa Barat (Institut Pertanian Bogor). http://repository.ipb.ac.id/handle/123456789/71249.
[17] Safe’i, R., Wulandari, C., Kaskoyo, H. (2019). Penilaian kesehatan hutan pada berbagai tipe hutan di Provinsi Lampung. Jurnal Sylva Lestari, 7(1): 95-109. https://doi.org/10.23960/jsl1795-109.
[18] Safe’i, R., Hardjanto, Supriyanto, Sundawati, L. (2013). Pengembangan metode penilaian kesehatan hutan rakyat sengon (Falcataria moluccana (Miq.) Barneby & J.W. Grimes). Jurnal Penelitian Hutan Tanaman, 12(3): 175-187.
[19] Safe’i, R., Latumahina, F.S., Suroso, E., Warsono. (2020). Identification of durian tree health (durio zibethinus) in the prospective nusantara garden wan abdul rachman lampung Indonesia. Plant Cell Biotechnol. Mol. Biol., 21: 103-110.
[20] Ardiansyah, F., Safe’i, R. (2021). Analysis of changes in health of coastal mangrove forest on the East Coast of lampung. IOP Conf. Ser. Earth Environ. Sci., 755: 1-7. https://doi.org/10.1088/1755-1315/755/1/012028
[21] Taskirawati, I., Surmi, Baharuddin, Safe’i, R. (2021). The effect of starter fermentation time and the different volumes of starters in making nata de arenga. IOP Conf. Ser. Earth Environ. Sci., 886(1): 1-7. https://doi.org/10.1088/1755-1315/886/1/012110
[22] Doria, C., Safe’i, R., Iswandaru, D., Kaskoyo, H. (2021). Fauna biodiversity as one of Repong Damar forest health indicators. IOP Conf. Ser. Earth Environ. Sci., 886: 1-5. https://doi.org/10.1088/1755-1315/886/1/012036
[23] Herwanti, S., Febryano, I.G., Yuwono, S.B., Khotimah, K., Banuwa, I.S., Harianto, S.P., Tsani, M.K., Surnayanti, Damayanti, I., Prasetia, H., Rusita, Fitriana, Y.R. (2021). Tourism economic value of Bukit Pangonan Urban Forest, Lampung, Indonesia. Int. J. Des. Nat. Ecodynamics, 16(5): 543-549. http://dx.doi.org/10.18280/ijdne.160508
[24] Safe’i, R., Arwanda, E.R., Doria, C., Taskirawati, I. (2021). Health assessment of vegetation composition in the reclamation area of PT Natarang Mining, Tanggamus Regency, Lampung Province. IOP Conf. Ser. Earth Environ. Sci., 886(1): 1-11. http://dx.doi.org/10.1088/1755-1315/886/1/012076
[25] Sukardi, L., Ichsan, A.C., Febryano, I.G., Idris, M.H., Dipokusumo, B. (2021). Analysis of community self-assistance level in water resources conservation in the upper areas of renggung watershed Lombok Island. Int. J. Des. Nat. Ecodynamics, 16(4): 387-392. https://doi.org/10.18280/ijdne.160405
[26] Luo, Y., Liu, J., Zhang, D., Dong, J. (2014). Actor, customary regulation and case study of collective forest tenure reform intervention in China. Small-Scale Forestry, 14(2): 155-169. http://dx.doi.org/10.1007/s11842-014-9279-1
[27] Yin, R., Zulu, L., Qi, J., Freudenberger, M., Sommerville, M. (2016). Empirical linkages between devolved tenure systems and forest conditions: Challenges, findings, and recommendations. Forest Policy and Economics, 7: 294-299. https://doi.org/10.1016/j.forpol.2016.05.008
[28] Li, A., Zhao, T. (2020). Research on the spatial pattern of forest undergrowth industries based on the evaluation of forest ecosystem services in Langxiang town. Int. J. Des. Nat. Ecodynamics, 15(3): 417-424. https://doi.org/10.18280/ijdne.150315
[29] Golar, G., Muis, H., Massiri, S.D., Rahman, A., Maiwa, A., Pratama, F., Baharuddin, R.F., Simorangkir, W.S. (2021). Can forest management units improve community access to the forest? Int. J. Des. Nat. Ecodynamics, 16(5): 565-571. http://dx.doi.org/10.18280/ijdne.160511