Muhammad Safar | Muh. Galib Ishak | I Gede Tunas*
© 2022 IIETA. This article is published by IIETA and is licensed under the CC BY 4.0 license (http://creativecommons.org/licenses/by/4.0/).
OPEN ACCESS
The research was conducted at the confluence of two rivers on Tawaeli River, Nupabomba Village, Tanantovea District, Central Sulawesi, Indonesia. This research intends to determine the rate of erosion in the watershed as part of the source of sediment transport at the confluence of the Tawaeli River. The research method applied to collect primary data and secondary data. In determining the rate of erosion, researchers used the Universal Soil Loss Equation (USLE) method. By calculating the value of the erosion rate using the USLE method using ArcGIS, the total value of the erosion rate that occurs in the Upper Tawaeli watershed area is 13506,865 tons/year where each hectare of the watershed is able to produce sediment from the erosion process of 4,3977 tons/ha/year included in the very low classification based on the criteria for the value of the erosion hazard level, and based on the erosion hazard level class, most of the watershed area, which is an area of 3053,572 ha or equivalent to 99.42% of the total area of the Upper Tawaeli watershed, is included in the area category with a very low level of erosion hazard. The results of the analysis through the sediment delivery ratio (SDR) using the Auserwald equation obtained an SDR value of 0.223 which indicates that not all sediment from the erosion process is transported or enters the river, therefore the sediment produced at the river outlet (STA. 3.4). is smaller than the erosion rate result of 261,278 tons/year. In addition, the results of this research also reveals that the configuration of the riverbed at the meeting point of the tributary has changed from the previous one which had a base elevation of 175,143 m, after an aggradation phenomenon occurred which was marked by an increase in the elevation of the riverbed as high as 0.348 meters.
USLE, sediment transport, river juction, aggradation, sediment delivery ratio (SDR)
Watershed as a land area that is topographically limited by mountain ridges that collect and store rainwater to channel it to the sea through the main river. The land area is called the basin or catchment area which is an ecosystem with the main elements consisting of natural resources (soil, water, and vegetation) and human resources as natural resource users [1, 2].
A watershed is a certain area whose its nature and form is an ecosystem unit, including hydrology with rivers and their tributaries that function as receivers, reservoirs and storage of water from rain and other sources [1, 3]. River or river flow as the main component of a watershed is defined as the amount of water flowing along the path on land to the sea so that the river is a path where water originating from upriver joins in one direction, namely downriver (estuary). Rivers are part of the hydrological cycle which consists of several processes, namely evaporation or water evaporation, condensation and precipitation.
Arsyad states that erosion occurs due to work interactions between climatic factors, topography, soil, vegetation and humans [3]. The most influential climatic factor on erosion is the intensity of rainfall. The steepness and length of the slope are topographic factors that affect the mud content [4, 5].
The erosion process can be viewed from three successive processes, namely detachment, transportation, and sedimentation [6]. The three stages of erosion are the stage of release from the soil mass, the stage of transport by erosive media such as water flow and wind, and the stage of deposition which occurs under conditions of weakened flow.
The morphological form of the confluence of two rivers is an interesting natural phenomenon to study because there will be various forms of the confluence of two rivers. The confluence of two rivers is a highly nonlinear dynamic system [7]. This research was conducted by taking the location at the confluence of two rivers on the Tawaeli River, which is located in Nupabomba Village, Tonantovea District, Donggala Regency, Central Sulawesi.
The condition of this watershed is very dependent on the conditions of water, soil, and the environment as well as human interaction with the watershed [8]. The characteristics of a good watershed can be seen from its ability to hold raindrops that fall to the land surface, so that they do not directly become surface runoff. One of the factors that affect the catchment capacity of the watershed is the density of vegetation cover which is usually related to the health condition of the watershed environment.
The change of forest land into plantations and housing is a phenomenon that often occurs in environmental damage [9]. Even though there has been a strong warning from the Indonesian government, forest changes that damage watershed ecosystems are still happening in Indonesia. Basically, the increasing number of people causes an increasing need for land use change. This watershed environmental damage it is very clear that it can damage the water supply system in the ground, because when it rains water cannot be stored in the ground [10]. This is because the rain water that falls directly flows and erodes the soil surface and carries soil grains which are partially soluble in water and some become coarse grains in the form of sand which are channeled into the surrounding rivers. As a result, the river water becomes cloudy and is carried to the lower reaches of the river until sediment is deposited. In addition, water that cannot be stored in the ground will increase river discharge which at the same time can cause flooding in the rainy season [11].
Soil and parts of soil that are transported by water from an eroded place in a watershed and into a body of water are generally called sediments [12]. Some of the sediment will arrive and enter the river and be carried out of the catchment area or watershed, and some will settle along the runoff path at the bottom of the slope. Sediment is the result of an erosion process in the form of surface erosion, trench erosion, or other types of soil erosion [13].
Changes in the ecosystem of the Tawaeli River Basin in the upriver area are mostly caused by deforestation, and changes in land into agricultural land and settlements. Damage to the watershed environment can have a very large impact on the soil above it, so that during the rainy season the upper soil surface is eroded/degraded (erosion). This erosion then causes the soil particles to be carried by water and into the river, thereby reducing the carrying capacity of the river. Joshi et al. revealed complex hydrological and environmental problems due to erosion and sediment transport in rivers [14]. Sediment supply is an important control on river morphology and sediment transport. Flow morphology responds to an imbalance between the magnitude of the transport capacity and the transport capacity of sediment supply, and rivers can be classified as limited supply if the transport capacity exceeds the layer or transport limited if the sediment supply exceeds the carrying capacity. Apart from that, at certain times the high flow rate and velocity are prone to overflow and scour at the meeting point of the river. The pattern of distribution of sediment deposits in rivers can occur at different points, the volume and movement of sediment found at the confluence of the Tawaeli River section can be used for research objects.
Studies related to erosion and sedimentation have been carried out by many researchers, especially in Indonesia. Inoue et al. (2015) has carried out an erosion study in one of the coal mine areas in Indonesia using the USLE method [15]. A similar study was also performed by Leomo et al. (2016) in one of the agricultural watersheds in South Sulawesi Province [16]. Furthermore, Yustika et al. (2019) and Naharuddin et al. (2020) applied the USLE method to predict erosion in social forest-dominated and soil liquefaction watersheds [17, 18]. The results of all these studies indicate that the USLE method shows good performance. Meanwhile, the erosion analysis on the studied watershed has never been carried out. Therefore, this research is important in relation to providing information about erosion for sustainable watershed management.
It is very important to carry out calculations or analysis of erosion based on this background, because soil erosion has very important ecological and economic consequences, including surface erosion causing the depletion of the top-soil layer which has an impact on decreasing land productivity and increasing sediment load. Under natural conditions, the rate of soil erosion is proportional to the rate of weathering and soil formation. However, if the environmental conditions are disturbed, there will be an acceleration of erosion which is very destructive and requires great effort and cost to control it.
2.1 Research site
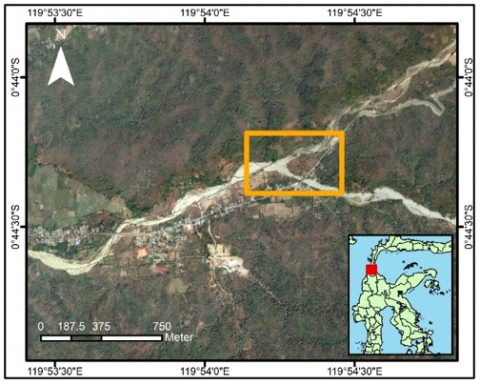
The study was conducted at the confluence of two rivers on the Tawaeli River, Nupabomba Village, Tanantovea District, which is located between 119°54'0" to 119°54'30" east longitude and 0°44'0" to 0°44'30" south latitude. Figure 1 illustrates the site of research location.
Figure 1. Research site
2.2 Data collection
There are two types of data performed in this study: primary data and secondary data. The primary data is obtained from field investigation, especially the measurement of the river profile around the confluence point. The secondary data were collected from the relevant agencies, such as: Rainfall data for 2011-2020 (Meteorology and Geophysics Agency Class II Mutiara Palu), topographic and slope data (Indonesian Geospatial Agency), soil type data and land use data (Agriculture and Plantation Board of Central Sulawesi).
2.3 Tools and materials
The equipment used is a set of computers with Microsoft Windows 10 operating system equipped with several software: hardware is a set of computers, DJI Phantom 4 Pro drone, ArcGIS 10.6 software, Agisoft PhotoScan Professional Version 1.4.5, ArcSWAT version 2012.10.6 and Microsoft Office Word 2016, Microsoft Office Excel 2016, and Microsoft Office Access 2016.
The materials used in this study include: climatic data (rainfall, air temperature, humidity, solar radiation, and wind speed) for 2017 (before liquefaction disaster) and 2019 (after liquefaction disaster), water discharge data, aster GDEM (Global Digital Elevation Model), topographic map, land cover data and oil type data.
2.4 Data processing
The model for estimating the potential for erosion can be seen from the amount of erosion expressed in the amount of soil lost in tons per hectare per year (tonnes/ha/year) which can be calculated using the USLE formula. Table 1 shows the classification of erosion potential as follows:
Table 1. Classification of soil erosion [3]
|
Class |
Amount of Erosion (ton/ha/year) |
Note |
|
1 |
< 15 |
Very low |
|
2 |
15 – 60 |
Low |
|
3 |
60 – 180 |
Moderate |
|
4 |
180 – 480 |
Heavy |
|
5 |
> 480 |
Severe |
USLE was developed at the National Runoff and Soil Loss Data Center which was founded in 1954 by the Science and Education Administration, United States of America Purdue. Federal and state research projects contributed more than 10,000 plot years of erosion and runoff data for statistical analysis [1, 3]. The USLE equation can be expressed as follows:
A=R*K*LS*CP (1)
where:
A = Total land lost (ton/ha/year)
R = Erosivity of average annual rainfall
K = Soil erodibility index
LS = Index of slope length and slope
C = Crop management index
P = Index of soil/land conservation efforts.
From the general USLE equation, the amount of erosion can be obtained by multiplying the parameters.
1). Rain Erosivity (R)
Rainfall erosivity is the ability of rainwater to cause erosion that originates from the rate and distribution of raindrops, both of which affect the amount of kinetic energy of rainwater. The USLE equation stipulates that the value of R which is the annual rainfall erosivity (rain erosivity) can be calculated from the rainfall data obtained from the automatic rainfall station (ARR) or from the data from the ordinary rainfall generator.
2). Soil Erodibility (K)
Soil erodibility factor is the ability/resistance of soil particles to peeling and removal of soil due to the kinetic energy of rain. The value of soil erodibility, apart from depending on topography, slope and the effects of human treatment, is also determined by the influence of soil texture, aggregate stability, infiltration capacity, organic and inorganic matter content of the soil. Table K by Arsyad is a table K that can be used in Indonesia [3].
3). Slope Slope (LS)
In making the length and slope index (LS) values, it is only determined from the slope or it can be calculated by looking at the length and slope of the land. The length of the slope (L) is measured from a place on the soil surface where erosion begins to occur to a place where deposition occurs, or to a place where water flow on the soil surface enters the channel. In field practice the value of L is often calculated at the same time with the steepness factor (S) as the slope factor (LS).
4). Crop Management (C)
In determining the plant management index, it is determined from land use maps and information on land use on topographic maps or data directly obtained from the field.
5). Soil Conservation (P)
While the determination of the soil conservation index is determined from the interpretation of plant species from land use which is evaluated by slopes and field checks. As for the stages of processing sediment data for sediment transport, it is calculated using the HEC-RAS program with the Meyer Peter-Muller method.
3.1 Research area condition
1). Topography and Water Flow Patterns in the Upper Tawaeli Watershed Area
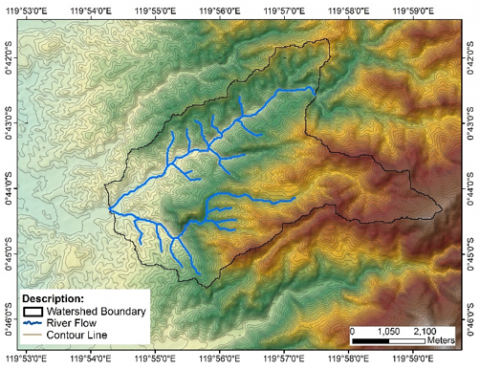
Administratively, the Upper Tawaeli watershed is part of the Tawaeli District of Palu City in the downriver part, while upriver the watershed is included in the Tanantovea District of Donggala Regency. This watershed has an area of approximately 3453,188 Ha which is located between 119°53'30” to 119°59'10”E and 0°41'30” to 0°45'30” South Latitude, which is an area with a slope that varies between 8 % to 72%. The contours of the Upper Tawaeli watershed area can be seen in Figure 2.
Figure 2. Topographic map of the Upper Tawaeli Watershed area
Condition of Water Flow Patterns in the Upper Tawaeli Watershed Area:
The results of the delineation above show that the pattern of water flow in the Upper Tawaeli watershed has a dendritic shape, this can be seen from the drainage network whose branches resemble a tree structure. In general, dendritic flow patterns are controlled by homogeneous rock lithology. Dendritic flow patterns can have a river texture/density which is controlled by the rock type. Texture is the length of the river per unit area.
2). Land Use
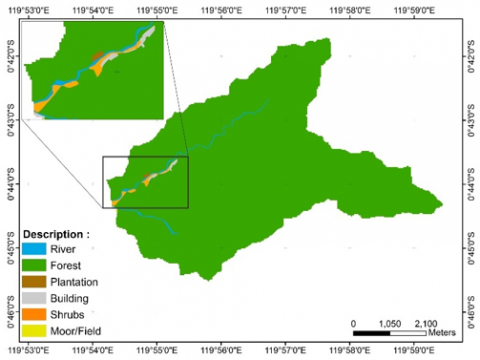
The land cover map for the Upper Tawaeli Watershed in 2020 can be seen in Figure 3.
Figure 3. Land cover map of Upper Tawaeli Watershed area
The land cover map above shows that the Upper Tawaeli watershed area is dominated by land in the form of forest with a land area of 3357,230 hectares or 97.22% of the total area, then shrubs with a land area of 34,161 hectares or 0.99% of the total area of the area, the river area in this area reaches a total area of 28,937 hectares or 0.84% of the total area, residential areas with an area of 14,156 hectares or 0.41% of the total area of the area, land area in the form of fields covering an area of 10,664 hectares or 0.31% of the total area, and the rest is used as a plantation area with an area of 8,040 hectares or 0.23% of the total area of the area.
3). Soil Type
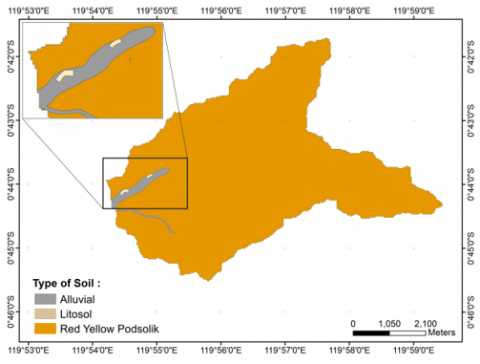
Based on the soil type map of the Regional Planning and Development Agency of Central Sulawesi Province, the Upper Tawaeli watershed area has 3 (three) soil types, namely Alluvial soil, Litosol, and Red Yellow Podsolic. For more details regarding the distribution of soil types in the Upper Tawaeli watershed area (Figure 4).
Figure 4. Map of the distribution of soil types in the Upper Tawaeli Watershed area
4). Climate
Climatological data affecting the transformation of rain into discharge in the hydrological cycle are rainfall, temperature, humidity, solar radiation, and wind speed in 2020, which in detail the climatic conditions in the Tawaeli region in 2020 can be seen in Table 2.
Table 2. Climate conditions in Tawaeli District in 2020
|
Month |
Average Temperature (℃) |
Rainfall (mm) |
Humidity (%) |
Solar Radiation (MJ/m2) |
|
January |
22,209 |
1,400 |
0.883 |
18,989 |
|
February |
22,035 |
8,967 |
0.923 |
18,317 |
|
March |
22,959 |
4,067 |
0.821 |
20,949 |
|
April |
22,580 |
8,200 |
0.936 |
15,751 |
|
May |
23,401 |
12,200 |
0.865 |
19,564 |
|
June |
22,928 |
5,600 |
0.899 |
17,064 |
|
July |
22,313 |
8,300 |
0.924 |
13,444 |
|
August |
22,852 |
8,500 |
0.919 |
16,352 |
|
September |
23,026 |
18,000 |
0.892 |
20,889 |
|
October |
22,773 |
17,200 |
0.928 |
18,025 |
|
November |
22,625 |
6,300 |
0.946 |
14,750 |
|
December |
22,091 |
9,300 |
0.952 |
13,410 |
|
Average |
22,649 |
9,003 |
0.91 |
17.29 |
3.2 Factors affecting erosion processes in the Upper Tawaeli Watershed
1). Rain Erosivity Index (R)
The calculation of the rain erosivity index (R) in this study is based on the Bols formula [3]. The data used includes monthly rainfall, the number of rainy days and a maximum daily rainfall of at least 10 years. In this study, 10-year rainfall data from the year (2011-2020) were used which were obtained from the BMKG Lambara station, Tawaeli District.
The value of the rate of rainfall erosivity in the study area ranges from 0.15 to 271.83 kj/ha/cm. When viewed from the calculation of the monthly R value, the highest R value occurred in 2011 which was 603.12 kj/ha/cm. and the lowest was in 2013 with an R value of 206.87 kj/ha/cm. The value of the rate of rainfall erosivity in the research area of 3706.99 kj/ha/cm was obtained from the results of adding up the R values for 10 years.
2). Soil Erodibility Index (K)
Data identification of soil types obtained from a digital map of the distribution of soil types in the Upper Tawaeli Watershed, using GIS tools, the soil erodibility (K) values in each sub-watershed are obtained as in Table 3.
Table 3. Average K value of each Upper Tawaeli Sub-watershed
|
Sub- Watershed |
Soil Type |
Soil Erodibility Index (K) |
Area (ha) |
|
1 |
Alluvial |
0.47 |
38.75 |
|
1 |
Litosol |
0.24 |
3.22 |
|
1 |
Red-Yellow Podzolic |
0.15 |
1568.61 |
|
2 |
Alluvial |
0.47 |
10.70 |
|
2 |
Red-Yellow Podzolic |
0.15 |
1450.04 |
|
Total |
|
|
3071.32 |
3). Slope Factor (LS)
The Upper Tawaeli watershed area has a diverse topography, using GIS tools to obtain the average length and slope factor (LS) for each sub-watershed as in Table 4.
Table 4. Average LS value of each Upper Tawaeli Sub-watershed
|
Sub-watershed |
Slope (%) |
Slope Factor (LS) |
Area (ha) |
|
1 |
0-8% |
0.4 |
46.73 |
|
1 |
8-15 % |
1.4 |
107.89 |
|
1 |
15-25 % |
3.1 |
254.49 |
|
1 |
25-45% |
6.8 |
780.91 |
|
1 |
> 45% |
9.5 |
420.56 |
|
2 |
0-8% |
0.4 |
39.22 |
|
2 |
8-15 % |
1.4 |
106.65 |
|
2 |
15-25 % |
3.1 |
273.59 |
|
2 |
25-45% |
6.8 |
657.56 |
|
2 |
>45% |
9.5 |
383.72 |
|
Total |
|
|
3071.32 |
4). Vegetation Factor (C)
Classification of types of land use and management of the Upper Tawaeli watershed in each sub-watershed is shown in the Table 5.
Table 5. Value of vegetation factors in the research area
|
Sub-watershed |
Value C |
Area (ha) |
|
1 |
0.0006 |
1577.91 |
|
1 |
0.2 |
1.66 |
|
1 |
0.2 |
5.00 |
|
1 |
0.3 |
10.15 |
|
1 |
0.001 |
15.86 |
|
2 |
0.0006 |
1452.60 |
|
2 |
0.2 |
0.00 |
|
2 |
0.2 |
0.77 |
|
2 |
0.3 |
0.66 |
|
2 |
0.001 |
6.41 |
|
2 |
0.4 |
0.30 |
|
Total |
|
3071.32 |
5). Conservation Action Factor (P)
Regarding soil conservation actions in each sub-watershed, it can be seen in Table 6.
Table 6. Soil conservation index in the study area
|
Sub-watershed |
Conservation Action Factor (P) |
Area (ha) |
|
1 |
0.07 |
1.66 |
|
1 |
0.1 |
10.14 |
|
1 |
0.01 |
1577.91 |
|
1 |
1 |
20.87 |
|
2 |
0.07 |
0.01 |
|
2 |
0.1 |
0.66 |
|
2 |
0.01 |
1452.60 |
|
2 |
1 |
7.17 |
|
2 |
0.15 |
0.30 |
|
Total |
|
3071.32 |
6). Land Unit
From the results of the geological map overlay, soil type map, slope map and land use in the Upper Tawaeli watershed area, there are 90 land unit. The parameters used to compile the land unit map are land use maps, slope maps, soil type maps and geological maps by overlaying these maps using Arc Map 10.6 Software. In this study, the sample was taken using purposive sampling method, namely the sampling method based on the research objective.
3.3 Erosion calculation results, classification of erosion hazard levels and distribution of erosion hazard classes
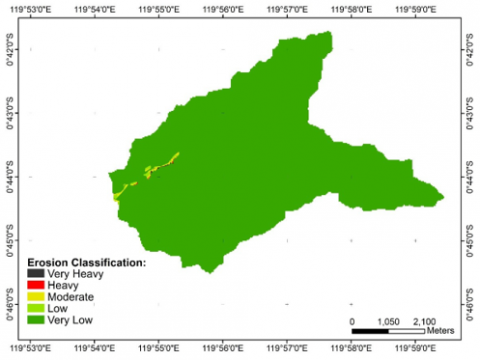
The calculation of erosion using the USLE method is done by multiplying all the factors that cause erosion (R, K, LS, C and P). Based on the calculation of the erosion rate using the USLE method using ArcGIS, the total value of the erosion rate that occurs is 13506,865 tons/year, which means that each hectare of the watershed is able to produce sediment from the erosion process of 4,3977 tons/ha/year. Then regarding the distribution of the level of erosion hazard in the Upper Tawaeli watershed area as a whole, it can be seen in Figure 5.
Figure 5. Map of distribution of erosion hazard levels in the Upper Tawaeli Watershed
For each land cover unit, erosion that occurs in the Upper Tawaeli watershed varies from very low to very heavy, while based on the erosion hazard level, most of the area of this watershed (an area of 3053,572 ha or equivalent to 99.42% of the total area of the Upper Tawaeli watershed) included in the category of very low erosion hazard, where the value of the resulting erosion rate is less than 15 tons/year Low erosion (erosion rate 15 – 60 tons/year) covers an area of 7,269 ha or 0.24% of the total area of the Tawaeli watershed Upriver, while moderate erosion (erosion rate 60 -180 tons/year) occurs in an area with a total area of 8,281 ha which is equivalent to 0.27% of the total area of the Upper Tawaeli watershed. Erosion rates of 180 – 480 tons/year are categorized as heavy erosion and covers an area of 0.923 ha which is equivalent to 0.03% of the total area of the Upper Tawaeli watershed Very heavy erosion with an erosion rate of more than 480 tons/year occurred in an area of 1.277 ha which is equivalent to 0.04% of the total area of the Upper Tawaeli Watershed.
The low level of erosion hazard in the Upper Tawaeli watershed is of course inseparable from the condition of land use at the location which is dominated by forest, only a small part of the land in that location is used by the community, so that although the level of slope varies, the land use pattern is different. controlled enough to make the location quite safe from the danger of erosion.
3.4 Sedimentation analysis
1). Calculation of Sediment Delivery Ratio (SDR)
Based on research by Auserwald (1992) the SDR value can be determined using the following equation [3]:
SDR= −0,02 + 0.385.A-0,2= -0.02 + 0.385 x 11,8587417-0,2= 0.223 (2)
Based on the SDR value obtained through the calculations above, it shows that the sedimentation transported to the river is quite small. The factor that is thought to influence this is that the slopes of the area around the river are mostly categorized as quite flat, which is between a slope of less than 8% to 15%.
2) Analysis of Sedimentation Transport at the Tawaeli River Confluence Through Hydrodynamic Simulation With HEC-RAS
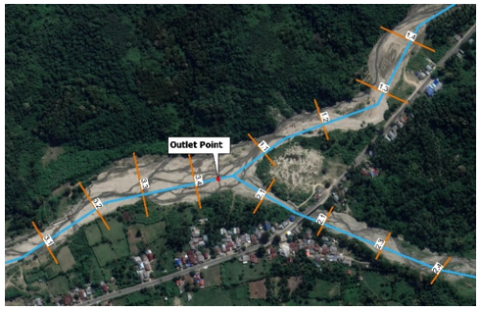
The simulation carried out to calculate sediment transport at the confluence of the Tawaeli river using the HEC-RAS 6.0 program requires input of appropriate data so that the simulation results can produce according to the field. The data needed to perform simulations in the HEC-RAS 6.0 program include specific river geometry data at the meeting area of the Tawaeli tributary (Figure 6) which includes cross-sectional images and longitudinal cross-sectional images.
The geometric data obtained are used to model the flow of the river in the HEC-RAS 6.0 program [19-21]. Longitudinal cross section of Sub-watershed 1 from the point of STA 1.1 in the downriver to STA 1.4 in the upriver of the tributary. For the longitudinal cross section, Sub-watershed 2 extends from the point of STA 2.1 on the downriver drainage to STA 2.4 on the upriver of the tributary. Meanwhile, the outlet for the confluence of tributaries in this study is located at STA 3.4 which is the upriver of the main river.
Analysis of sediment transport in the confluence area of the Tawaeli River was carried out using HEC-RAS software based on primary and secondary data, and based on the Meyer – Peter and Müller sediment transport analysis method. The simulation is carried out for a simulation time of approximately 1 year. From the analysis of total sediment transport in the Upper Tawaeli watershed using the Meyer – Peter and Müller equation, it shows that the total sediment produced by all rivers in the upriver Tawaeli watershed is 1308.293 tons/year.
Figure 6. Flowpath schematic at the confluence area of the Tawaeli River
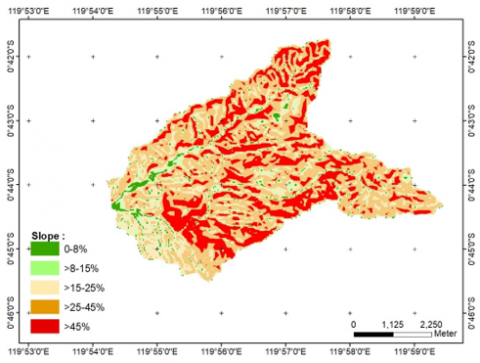
Figure 7. Topographic slope of the Upper Tawaeli Watershed
After knowing the amount of total erosion based on USLE, the SDR value can be calculated, so that it can be seen how much sediment reaches the outlet or river. The results of the analysis through the sediment delivery ratio (SDR) using the Auserwald equation obtained the SDR value of 0.223. So from the results of this calculation indicate that the value of sedimentation transport from the erosion process transported to the river is quite small. The factor that is predicted to influence this transportation rates that the slopes of the area around the river are mostly categorized as moderate slope of less than 25% (Figure 7). In addition, in this case the SDR value is also determined by the type of land cover, because the condition of land cover dominated by forest will inhibit the flow of sediment to the river, so it is possible that not all eroded sediment enters the river, only a small part of the material. eroded sediments in watersheds can reach nearby rivers. The result of erosion that reaches the river is called sediment yield. On the way from the place where land erosion occurs to the river there is deposition, either permanent or temporary, especially in basin areas, sloping areas, flood plains, and in the channel itself.
In connection with the above phenomenon, if it is related to the results of sediment analysis as described in the sediment simulation results using HEC-RAS which shows using the Meyer - Peter and Müller equations the total sediment produced at the watershed outlet which can be seen in cross section 3.4 is 261,278 tons/year, which means that this value is smaller than the total erosion rate, and the results of this study also show that in the area where the tributaries meet, they experience aggradation, which is indicated by an increase in the elevation of the riverbed as high as 0.348 meters/year as evidenced by analysis using the equation Meyer – Peter and Müller on HEC-RAS, of course this phenomenon is caused by the accumulation of sediment transported from the upriver of the river.
The research conducted has given various results to the author. It can be concluded as follows.
1) Through the calculation of the erosion rate value using the USLE method using ArcGIS, the total value of the erosion rate that occurs in the Upper Tawaeli watershed area is 13506,865 tons/year where each hectare of the watershed is able to produce sediment from the erosion process of 4,3977 tons/year. ha/year which is classified as very low based on the criteria for the value of the erosion hazard level, and based on the erosion hazard level class, most of the watershed area, which is 3053,572 ha or equivalent to 99.42% of the total area of the Upper Tawaeli watershed, is included in the category of areas with a very low level of erosion hazard.
2) The results of the analysis through the sediment delivery ratio (SDR) using the Auserwald equation obtained an SDR value of 0.223 which indicates that not all sediment from the erosion process is transported or enters the river, so that the resulting sediment is also at the river outlet (STA. 3.4). smaller than the resulting erosion rate, which is 261,278 tons/year. In addition, the results of this study also show that the configuration of the riverbed at the meeting point of the tributary has changed from the previous one which had a base elevation of 175,143 m, after an aggradation phenomenon occurred which was marked by an increase in the elevation of the riverbed as high as 0.348 meters.
|
A |
Soil loss per unit area in unit time, t/ha/year |
|
C |
Crop management factor |
|
K |
Soil erodibility factor |
|
P |
Index of soil/land conservation efforts |
|
R |
Rainfall erosivity factor |
|
LS |
Topographic factors (slope length and steepness) |
|
ARR |
automatic rainfall station |
|
SDR |
Sediment delivery ratio, % |
|
USLE |
Universal soil loss equation |
[1] Asdak, C. (2014). Hydrology and Watershed Management. Gadjah Mada University Press, Yogyakarta [in indonesian].
[2] Pham, T.G., Degener, J., Kappas, M. (2018). Integrated universal soil loss equation (USLE) and geographical information system (GIS) for soil erosion estimation in A Sap basin: Central Vietnam. International Soil and Water Conservation Research, 6(2): 99-110. https://doi.org/10.1016/j.iswcr.2018.01.001
[3] Arsyad, S. (2010). Soil and Water Conservation. IPB Press, Bogor [in indonesian].
[4] Bera, A. (2017). Assessment of soil loss by universal soil loss equation (USLE) model using GIS techniques: a case study of Gumti River Basin, Tripura, India. Modeling Earth Systems and Environment, 3(29): 1-9. https://doi.org/10.1007/s40808-017-0289-9
[5] Chuenchum, P., Xu, M., Tang, W. (2020). Estimation of soil erosion and sediment yield in the Lancang–Mekong River using the modified revised universal soil loss equation and GIS techniques. Water, 12(135): 1-24. https://doi.org/10.3390/w12010135
[6] Tamene, L., Le, Q.B. (2015). Estimating soil erosion in sub-Saharan Africa based on landscape similarity mapping and using the revised universal soil loss equation (RUSLE). Nutrient Cycling in Agroecosystems, 102: 17-31. https://doi.org/10.1007/s10705-015-9674-9
[7] Gaubi, I., Chaabani, A., Mammou, A.B., Hamza, M.H. (2017). A GIS-based soil erosion prediction using the revised universal soil loss equation (RUSLE) (Lebna watershed, Cap Bon, Tunisia). Natural Hazards, 86: 219-239. https://doi.org/10.1007/s11069-016-2684-3
[8] Balasubramani, K., Veena, M., Kumaraswamy, K., Saravanabavan, V. (2015). Estimation of soil erosion in a semi-arid watershed of Tamil Nadu (India) using revised universal soil loss equation (RUSLE) model through GIS. Modeling Earth Systems and Environment, 1(10): 1-17. https://doi.org/10.1007/s40808-015-0015-4
[9] Belasri, A., Lakhouili, A. (2016). Estimation of soil erosion risk using the universal soil loss equation (USLE) and geo-information technology in Oued El Makhazine Watershed, Morocco. Journal of Geographic Information System, 8: 98-107. https://doi.org/10.4236/jgis.2016.81010
[10] Rahim, S.E., Supli, A.A., Damiri, N. (2017). Soil loss prediction on mobile platform using universal soil-loss equation (USLE) model. MATEC Web of Conferences, 01066: 1-8. https://doi.org/10.1051/matecconf/20179701066
[11] Fayas, C.M., Abeysingha, N.S., Nirmanee, K.G.S., Samaratunga, D., Mallawatantri, A. (2019). Soil loss estimation using rusle model to prioritize erosion control in Kelani river basin in Sri Lanka. International Soil and Water Conservation Research, 7(2): 30-137. https://doi.org/10.1016/j.iswcr.2019.01.003
[12] Purwaamijaya, I.M. (2018). Multi criteria evaluation for universal soil loss equation based on geographic information system. Journal of Physics: Conference Series, 1013(012153). https://doi.org/10.1088/1742-6596/1013/1/012153
[13] Zhang, X., Fan, J., Liu, Q., Xiong, D. (2018). The contribution of gully erosion to total sediment production in a small watershed in Southwest China. Physical Geography, 38(3): 246-263. https://doi.org/10.1080/02723646.2017.1356114
[14] Joshi, V., Susware, N., Sinha, D. (2016). Estimating soil loss from a watershed in Western Deccan, India, using Revised Universal Soil Loss Equation. Landscape & Environment, 10(1): 1325. https://doi.org/10.21120/LE/10/1/2
[15] Inoue, N., Hamanaka, A., Shimada, H., Sasaoka, T., Matsui, K. (2015). Fundamental study on assessment of soil erosion by the USLE method at rehabilitation area in Indonesian coal mine. Earth Science Research, 4(1): 1-7
[16] Leomo, S., Ginting, S., Sabaruddin, L., Tufaila, M. (2016), Estimation of erosion hazard level using Universal Soil Loss Equation (USLE) method in Endanga watershed, Southeast Sulawesi, Indonesia. Advances in Environmental Biology, 10(1): 101-106
[17] Yustika, R.D., Somura, H., Yuwono, S.B., Arifin, B., Ismono, H., Masunaga, T. (2019). Assessment of soil erosion in social forest-dominated watersheds in Lampung, Indonesia. Environmental Monitoring and Assessmen, 191(726): 1-15. https://doi.org/10.1007/s10661-019-7890-5
[18] Naharuddin, N., Malik, A., Rachman, I., Muis, H., Hamzari, H., Wahid, A. (2020). Land use planning for post-disaster soil liquefaction area based on erosion hazard index. International Journal of Design & Nature and Ecodynamics, 15(4): 573-578. https://doi.org/10.18280/ijdne.150415
[19] Das, B., Sil, B.S. (2017) Assessment of sedimentation in Barak River reach using HEC-RAS. Development of Water Resources in India, 75. https://doi.org/10.1007/978-3-319-55125-8_8
[20] Daham, M.H., Abed, B.S. (2020). Simulation of sediment transport in the upper reach of Al-Gharraf River. IOP Conference Series: Materials Science and Engineering, 901(012012). https://doi.org/10.1088/1757-899X/901/1/012012
[21] Dutta, S. (2016). Soil erosion, sediment yield and sedimentation of reservoir: A review. Modeling Earth Systems and Environment, 2(123). https://doi.org/10.1007/s40808-016-0182-y