Relangi Naga Durga Satya Siva Kiran* | Chaparala Aparna | Sajja Radhika
© 2021 IIETA. This article is published by IIETA and is licensed under the CC BY 4.0 license (http://creativecommons.org/licenses/by/4.0/).
OPEN ACCESS
The groundwater for aquatic purposes must be assessed prior to its consumption. Huge number of conventional methods are existing for assessing the quality of groundwater. The water quality index is one of the important conventional methods to assess the groundwater quality. But the conventional methods alone are not enough to assess groundwater quality as well as classify based on its purity. In this paper, we propose an enhanced weight update method for Simplified Fuzzy Adaptive Resonance Theory model to classify the groundwater quality depending on the relative weights of the groundwater quality parameters. Finding the optimal weights is the key to achieve better accuracy of the model, most of the nonlinear models fails to exhibit good accuracy if they fail to learn the optimal weights in the learning process. The aim of the work is to find the good fit between the predicted and the actual groundwater quality grades by identifying the optimal weights of the network by the enhanced weight update method. The Simplified Fuzzy Adaptive Resonance Theory map with the enhanced weight update method performance is justified by comparing it with the Simplified Fuzzy Adaptive Resonance Theory Map. The enhanced weight update method improves the accuracy of the Simplified Fuzzy Adaptive Resonance Theory Map in classifying and predicting the groundwater quality.
adaptive resonance theory, artificial neural network, fuzzy water quality index, simplified fuzzy ARTMAP, weighted arithmetic water quality index
We all know that groundwater is one of the natural major water sources across the world. Primarily, it is used for drinking and living purposes. Besides this, it is also used for agricultural, industrial and domestic purposes. But urbanization and industrialization, for getting the crops in short periods the farmers using pesticides and chemical fertilizers for protecting the crops from insects. The quality of groundwater is deteriorated due to the waste produced by the industries which is also one of the factors. We cannot absolutely stop these practices which will deteriorate the groundwater quality. Instead, we should take proper care regarding the groundwater. We can assess the quality of the groundwater before consumed, because groundwater is deteriorated by various factors as above stated and mostly by anthropogenic activities. Water Quality Index is one powerful and frequently used mathematical method to assess the groundwater quality. WQI is actually developed by Horton (1965) [1] in USA. Since 1965 it is one of the most effective tools used in various groundwater studies by researchers and groundwater management stations. Recently, Udeshani et al. [2], applied wqi to assess the groundwater quality of a hard rock terrain in Sri Lanka.
Rest of this research work is arranged as follows: In Section 2 the literature is presented. The methodology we followed to develop the models is presented in Section 3. Empirical study of the considered 2 models is presented in Section 4. Finally, Section 5 provides conclusion of this work.
In this section, an attempt has been made to study the assessment methods used to determine status of the groundwater excellence and the classification of the groundwater depending on its purity. According to the chronological order, Horton (1965) is the first person who formulated water quality index method to assess the quality of water in United States. Brown et al. [3] improved the Horton’s water quality index by adding 2 more water quality parameters. Since 1970 more than 30 groundwater quality indices are formulated across the globe to assess the groundwater quality basing on physical, chemical parameters. Lumb et al. [4] presented a comprehensive review of various water quality indices since 1960 to 2011. Vidyalakshmi et al. [5] reviewed more than 30 water quality indices those are exits since 1970 to 2011. Tyagi et al. [6] reviewed and presented the pros and cons of 4 popular water quality assessment methods. Anwar and Aggarwal [7] utilized wqi to assess the groundwater status of Aligarh City, India. By collecting groundwater data in pre and post monsoon seasons from 40 sampling points during 2012. This study reports that half of area under study is moderately polluted. Gholami et al. [8] applied wqi, GIS and statistical techniques to identify the sanitary boundaries of the drinking water wells to guarantee the water quality. Saleem et al. [9] utilized wqi by collecting samples from 10 locations of Grater Noida, Uttar Pradesh State, India, and the results exhibited that most of the study area belongs to good water quality type. Saana et al. [10] utilized wqi to determine the groundwater quality for potable purpose of Upper West and Northern regions of Ghana and found that the groundwater is suitable for potable purpose form the area under study. Adimalla et al. [11] applied wqi method, Gibbs and Hill-Piper diagrams to assess the groundwater quality of the study area viz. ShaslerVagu watershed of Nalgonda, India. This study state that 76% of groundwater samples from the study area belongs to poor water type. Hui et al. [12] utilized wqi and multivariate statistical analysis methods for appraisal of shallow groundwater in Hailun, Northeast China. The samples are classified as excellent type, good, poor and not fit for drinking purpose are 69.09%, 25.45%, 1.81% and 3.64% respectively.
2.1 Applications of ANN and fuzzy logic in groundwater classification
Classification is a supervised learning process. Classification used in various applications like image processing, document classification, pattern classification etc. It can be applied to groundwater quality classification also. Many groundwater studies are used for various classification models like Back propagation, Radial Bias function neural network, Decision trees, Random forests etc.
Since last two decades Artificial Neural Networks (ANN) are used in various sectors akin to financial sector, medical diagnosis, earth sciences, power systems, business applications etc. Actually, ANN is biologically inspired computational model and is first proposed by McCulloch in 1943. Thereafter, various researchers proposed and developed different kinds of ANN models. Different types of ANN model are proposed and used in groundwater quality research but the MLP model has been frequently used to classify the groundwater quality class or type of groundwater [13-25]. Actually, the ANN models can handle crisp data, but some of the classification problems need to process the data with uncertainty along with the crisp data. The groundwater and surface water quality classification are one of the classification problems where the water quality parameter data possess vagueness i.e., fuzzy data. In this view, researchers used fuzzy set theory to classify the groundwater and surface water. Fuzzy set theory is theory about handling data with uncertainty and it is developed by Zadeh in 1960 [26].
Fuzzy set theory is also employed to verify the excellence of groundwater. Hosseini Moghar et al. [27] developed fuzzy water quality index to counter the limitations of conventional water quality index. Developed water quality index based on the fuzzy set theory [28-31]. Mohammed et al. [32] conducted a comprehensive study, to define the hydro chemical characteristics those control the quality of the groundwater quality. In this study, applied conventional methods as well as fuzzy logic comprehensive evaluation method. The conventional methods and the fuzzy logic comprehensive evaluation method justified that the groundwater samples from the area under study belongs to fresh category and it is suitable for drinking purposes.
2.2 Applications of simplified ARTMAP in classification problems
Fuzzy inference system is one of the classification models built on top of the fuzzy set theory. Simplified Fuzzy Adaptive Resonance Theory is another popular model to classify the data with vagueness. Simplified ARTMAP is proposed by Kasuba, 1993. Kausba’s Simplified ARTMAP is used in a wide range of classification problems. Rajasekaran and Vijayalakshmi Pai [33] studied the capability of Simplified ARTMAP for classification of patterns by extending the functionality model by a moment based on feature extractor. Vakil-Baghmisheh [34] proposed a variant of Kasuba Simplified ARTMAP model in 2003 and the proposed model is better than the Kausba’s model. Boonpoke [35] applied Simplified ARTMAP for pattern recognition and classification of Partial Discharge. Kakati et al. [36] proposed a new approach of Simplified ARTMAP for supporting Medical Diagnostic Reasoning. Alickovic& Subasi [37] used Simplified ARTMAP to classify the data of 3 bench mark data sets to study the potential of classification and found that the Simplified ARTMAP achieves better performance. Vincent et al. [38] utilized Simplified ARTMAP to classify honeys. Acampora and Cosma [39] performed comparative study of 3 fuzzy methods including Simplified ARTMAP to classify the customer review rating predictions. De Oliveira and Inman [40] utilized the Simplified ARTMAP along with the Euclidean distance measure to classify the structural damage. De Oliveira and Inman [41] study the potential of Simplified ARTMAP for identifying Structural Damage Growth. Naga et al. [42] applied Simplified ARTMAP to classify the groundwater.
From the literature it is observed that assessment and classification of the groundwater is independent of the sampling location, number of parameters and seasons. In this work we have evaluated the quality of groundwater data using the wqi method. Thereafter, we classify the groundwater by 2 machine learning models simplified fuzzy adaptive resonance theory model and enhanced simplified fuzzy adaptive resonance theory model. In this work we enhanced the weight update method to improve the performance of the simplified fuzzy adaptive resonance theory model to classify the groundwater data more accurately.
3.1 Experimental setup
We implemented the Simplified ARTMAP and Simplified ARTAMP with enhanced weight update method models using the freeware i.e., Python language with version number 3.8.9 through Anaconda 3 individual user platform. In the development of the above two models sklearn, pandas, numpy and matplotlib package were used. The groundwater data samples are collected from Water Quality Monitoring Lab, RWS&S Sub-Division, Narsapuram, West Godavari, Andhra Pradesh, India for experimental study. The groundwater quality data samples are subjected to 7 parameters, they include pH, Temp, Conductivity, BOD, Nitrate+Nitrite, Fecal Coliform and Total Coliform. The class label each groundwater samples is assessed by applying the WAWQI method, in the grade assignment process we follow the guidelines of drinking water issued by Bureau of Indian Standards [43]. The class label of the samples may be excellent type, good, poor, very poor and unfit for potable purpose. These grades are assigned based on the computed value of the sample by the WAWQI method. If the computed value is between 0 to 25 then the sample belongs to excellent category, if the computed value is between 26 to 50 the sample is belonging to good category, if the computed values is between 51-72 the sample belongs to poor category, if the computed value is between 76 to 100 the sample belongs to very poor category and the value is between greater than 100 then the water is not fit for potable purpose. The WAWQI is calculated using the following Equation. 4. Thereafter, the groundwater quality classification and prediction were made using the Simplified ARTAMP with the enhanced weight update method. Further, the accuracy of the model is verified by comparing it with its counter model in terms of classifier accuracy, mean absolute error and root mean squared error. The statistical summary of the considered parameters is presented in Table 1. The detailed steps to determine the groundwater excellence are presented below.
Table 1. Statistical summary of the parameters for groundwater samples
|
Name of the Statistic |
Potential Hydrogen |
Conductivity |
Biological Oxygen Demand |
Nitrate + Nitrite |
Fecal Coliform |
Total Coliform |
Temperature |
|
min |
2.6 |
37 |
0.3 |
0 |
2 |
5 |
17 |
|
max |
9.1 |
36593 |
27.8 |
14.85 |
36250 |
75000 |
31.1 |
|
mean |
7.43 |
758.61 |
9.59 |
3.20 |
5876.20 |
13511.1 |
24.8 |
|
std |
0.85 |
1951.7 |
7.74 |
2.60 |
10439.0 |
21972.1 |
3.12 |
|
25% |
7.3 |
294 |
2.2 |
1.5 |
24 |
82 |
22 |
|
50% |
7.5 |
531 |
8.8 |
2.69 |
130 |
343 |
24.5 |
|
75% |
7.8 |
970 |
13.5 |
4.77 |
5000 |
26750 |
25.8 |
|
count |
1020 |
1020 |
1020 |
1020 |
1020 |
1020 |
1020 |
3.2 Assessment of groundwater quality grade through WQI
By applying Weighted Arithmetic Water Quality Index method (WAWQI) we can assess the type of each sample. To calculate the drinking water quality, the groundwater quality parameters pH, Temp, Conductivity, BOD, Nitrate+Nitrite, Fecal Coliform and Total Coliform were considered. The most frequently used water quality assessment method WAWQI used in this study which was employed in several earlier studies [44-47]. In order to assess the groundwater quality, first we should assign the weight for the above 7 groundwater quality parameters basing on their importance with respect to drinking purposes. To assign the relative weight for each of the 7 parameters, it can be determined by using the Eq. (1), next the quality rating scale of each parameter was calculated by using Eq. (2). The relative weight of each parameter is multiplied by quality rating scale of each parameter to get the groundwater quality subindices of each parameter and is given in Eq. (3). Finally, we can compute the water quality index (WQI) by using the Eq. (4).
$r w_{i}=\frac{W_{i}}{\sum_{i=1}^{n} W_{i}}$ (1)
$Q_{i}={C}_{i} / S_{i} * 100$ (2)
$S I_{i}=r w_{i} * Q_{i}$ (3)
$W Q I=\sum_{i=1}^{n} S I_{i}$ (4)
In the above equations, rwi, wi are the relative weight and influence of each groundwater quality parameter, n is the total number of parameters considered in this study, Qi represents the quality rating scale of groundwater parameters, the Si represents the national drinking water quality standard, as per BIS 2012. Ci is the concentration of each of the parameters. $\mathbf{S I}_{\mathbf{i}}$ and WQI represents the sub index and water quality index. The assigned weights and relative weights used to compute the WQI are presented in Table 2.
Table 2. Assignment of weight and relative of each parameters
|
Name of the Parameter |
Weight (wi) |
Relative Weight (rwi) |
|
pH |
5 |
0.20 |
|
Conductivity |
5 |
0.20 |
|
BOD |
3 |
0.12 |
|
Fecal Coliform |
3 |
0.12 |
|
Total Coliform |
3 |
0.12 |
|
Nitrate+Nitrite |
3 |
0.12 |
|
Temp |
3 |
0.12 |
|
|
∑ wi= 25 |
∑ rwi = 1.00 |
The pseudo code of Simplified ARTMAP is presented below.
3.3 Pseudo code of Simplified ARTMAP
Start the training procedure.
Load the groundwater dataset.
IFV is a n dimensional input feature vector representing the groundwater quality features.
w represents the top down weight vector.
Initialize the parameters n, α, ρ and ɛ.
for $i \leftarrow 1$ to n samples in the training dataset do
$A I F V=\left(I F V . I F V^{C}\right)$ where
$I F V_{i}=\left(F_{1}, F_{2}, F_{3} \ldots \ldots \ldots F_{n}\right)$ with n dimensions and its class label is $C_{i}$
$I F V^{C}=\left(F_{1} F_{2}, F_{3} \ldots \ldots \ldots F_{n}, 1-F_{1}, 1-F_{2} \ldots .1-F_{n}\right)$
$\rho_{i} \leftarrow \rho$
If $A I F V_{i}$ is the first input with class label $C_{i}$ do
$w_{i}=A I F V_{i}$
done.
for $\mathrm{j} \leftarrow 1$ to n do
$\mathrm{T}_{\mathrm{j}}\left(\mathrm{AIFV}_{\mathrm{i}}\right)=\frac{\left\|\mathrm{AIFV}_{\mathrm{i}} \Lambda \mathrm{W}_{\mathrm{j}}\right\|}{\alpha+\left\|\mathrm{w}_{\mathrm{j}}\right\|}$
$\mathrm{T}_{\mathrm{k}}=\operatorname{argmaxT}_{\mathrm{j}}\left\{\left(\mathrm{AIFV}_{\mathrm{i}}\right), \mathrm{j}=1,2,3 \ldots \ldots \mathrm{n}\right\}$
$\mathrm{T}_{\mathrm{k}}\left(\mathrm{AIFV}_{\mathrm{i}}\right)=\frac{\left\|\mathrm{AIFV}_{\mathrm{i}} \Lambda \mathrm{W}_{\mathrm{j}}\right\|}{\mathrm{n}}$
if $T_{k}\left(A I F V_{i}\right)>\rho$ and $C_{i}=C_{k} d o$
$w_{\mathrm{j}}^{\text {new }}=\mathrm{w}_{\mathrm{j}}^{\text {old }}+\left\|\mathrm{AIFV}_{\mathrm{i}}+\mathrm{w}_{\mathrm{j}}^{\text {old }}\right\|$
done.
else if $\mathrm{T}_{\mathrm{k}}\left(\mathrm{AIFV}_{\mathrm{i}}\right)>\rho$ and $\mathrm{C}_{\mathrm{i}} \neq \mathrm{C}_{\mathrm{k}} \mathrm{do}$
$\rho_{\mathrm{i}} \leftarrow \mathrm{T}_{\mathrm{j}}+\varepsilon$
done.
else (i.e.) $\mathrm{T}_{\mathrm{k}}\left(\mathrm{AIFV}_{\mathrm{i}}\right)<$ p do
$\mathrm{T}_{\mathrm{k}}=-1$
$\mathrm{w}_{\mathrm{j}}^{\text {new }}=\mathrm{IFV}_{\mathrm{j}}$
done.
end for.
$i \leftarrow \mathrm{i}+1$.
end for.
end of the training procedure.
3.4 Our contribution
The primary objective of this work is to classify the groundwater data based on the groundwater parameters. All the groundwater monitoring and management stations first collect the groundwater samples and then they will be tested at the laboratory to get the values of the groundwater parameters. Based on the groundwater quality parameter values, the management stations decide the quality of the groundwater. In this regard, the researchers applied artificial neural network models to classify the groundwater samples. But the problem with the ANN models are: deciding the architecture of the network, finding the right activation function and configuration parameters etc. After identifying the right architecture, activation function and parameter values another important problem to address is to find the optimal values of the weight vector it can be done by running the ANN model with different iterations. Finding the optimal weights of the weight vector is the core activity in the ANN model training. The optimal weights of the weight vector only identify the good fit between the predicted and the actual value. So, it is very essential to find the optimal weights. Hence, we propose an enhanced weight update model to learn the optimal weights and it is incorporated with the simplified fuzzy adaptive resonance theory model we named it as ESFART. The proposed weight update method depends on the relative weights of the groundwater parameters and hence it can be applicable to groundwater classification problems only. Further, we experimented with the simplified fuzzy adaptive resonance theory model and the enhanced simplified fuzzy adaptive resonance theory model to check the performance of the proposed weight update method with the same training and the test data set we use 70% of the data for training and 30% data for testing the models. The proposed weight update model is presented below.
$\mathrm{W}_{\mathrm{j}}^{\text {new }}=\left(\alpha *\left(\mathrm{I} \Lambda \mathrm{W}_{\mathrm{j}}^{\text {old }}\right)\right)+\left(\mathrm{RW}_{\Lambda} \mathrm{W}_{\mathrm{j}}^{\text {old }}\right)+(\alpha\left.* \mathrm{~W}_{\mathrm{j}}^{\text {old }}\right)$ (5)
In Eq. (5). RW is the sum of the relative weights of the groundwater sample parameters i.e., $\mathrm{RW}=\sum_{\mathrm{i}=1}^{\mathrm{n}} \mathrm{rW}$.
In the proposed weight update method, the weights are updated using three terms, all these terms use old weight vector values. All the terms minimize the weight vector values which in turn increase the accuracy of the model.
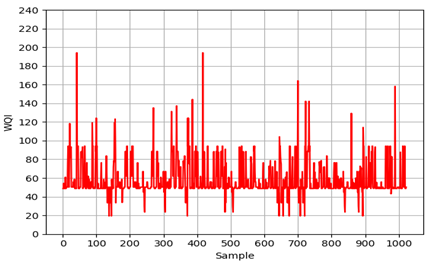
We first assessed the groundwater quality type of every representative in the dataset by applying the most popular wqi i.e., Weight Arithmetic Water Quality Index Method Eq. (4). The wqi method is also implemented using the Python 3.8.9 programming language. After applying WAWQI method, we get the groundwater quality type of each data sample, the quality type belongs to excellent or good or poor or very poor or not suitable for drinking purpose. The percentages of samples fall into each type are presented in Table 3 and we plotted the type of each sample (Figure 1).
Table 3. Groundwater quality classification criteria and their percentage
|
WQI RANGE |
WATERCATEGORY |
PERCENTAGE |
|
0-25 |
Excellent |
30.88% |
|
25-50 |
Good |
36.17% |
|
51-75 |
Fair/Poor |
12.54% |
|
75-100 |
Very Poor/Poor |
12.05% |
|
>100 |
Not suitable for Drinking |
8.33% |
The assessed value of groundwater quality of each sample varies from 19.30 to 194.18 with an average of 58.74. The groundwater type is classified into 5 types based on the computed value using the WAWQI method. Excellent groundwater quality when the computed values is less than 25, good groundwater quality when it is greater than 25 and less than 50, poor groundwater quality when it is greater than 51andless than 75, very poor when it is greater than and 75 and less than 100 and not fit for potable purpose when it is greater than 100.According to the wqi computed value, 30.88% of the groundwater samples falls into excellent groundwater quality type, 36.17% of the groundwater samples belong to good groundwater quality type, 12.54% of the samples come under poor category, 12.05% of the samples comes under poor/very poor category and the remaining groundwater samples 8.33% comes under unfit for potable type (Table 3). From Figure 1 it should be observed that most of the samples index values below 75 and greater than 50.
Figure 1. The water quality grade of each sample
In this empirical study, the performance of two neuro fuzzy models i.e., Simplified fuzzy adaptive resonance theory model and ESFART model were evaluated to determine the suitable model to classify the groundwater data. The two neuro fuzzy models are trained with reference to the 7 groundwater quality parameters along with the wqi computed value and the groundwater type viz. excellent, good, poor etc. Thereafter we evaluated the accuracy of the 2 models based on statistical metrics. There are many statistical metrics for model evaluation. In this study we used confusion matrix to find out the accuracy of the model. The mean absolute error and root mean squared error (Najah et al. [15]; Wagh et al. [21]; Wang et al. [47]) also used to validate the two neuro fuzzy models in terms of error rate. The computed metrics values as above mentioned of the two models are studied from 250 iterations to 2500 iterations. The above stated 3 metrics are used to find the best fitting between the actual and the predicted values. The computed classifier accuracy values of the two models are presented in the following Table 4. The training process is stopped at 2500 iterations as the accuracy of the model remains constant. From the Table 4, it is observed that the enhanced simplified fuzzy adaptive resonance theory model exhibits good accuracy rate in terms of classifier accuracy.
Table 4. Accuracy values of SFART and Enhanced SFART models
|
Number of iterations |
Name of the Model |
|
|
SFART Model Accuracy |
Enhanced SFART Model Accuracy |
|
|
250 |
88.64 |
91.43 |
|
500 |
88.64 |
94.33 |
|
750 |
90.9 |
96.00 |
|
1000 |
91.43 |
96.60 |
|
1250 |
91.43 |
96.55 |
|
1500 |
91.43 |
96.55 |
|
1750 |
91.43 |
96.96 |
|
2000 |
91.43 |
97.36 |
|
2250 |
91.43 |
98.79 |
|
2500 |
91.43 |
98.79 |
Figure 2. The Mean Absolute Error Graph of SFART and Enhanced SFART
In this work, The MAE and RMSE metrics are used to identify how close the model prediction and the ground truth value. The MAE and RMSE values obtained are plotted in Figure 2 and Figure 3 between the Simplified fuzzy adaptive resonance theory model and the Enhanced Simplified fuzzy adaptive resonance theory model. It can be observed from the Figure 2 and Figure 3 Enhanced Simplified fuzzy adaptive resonance theory model had low MAE and RMSE values than the Simplified fuzzy adaptive resonance theory model.
If the MAE and RMSE values of the model are low means that the model performs well and vice versa. If the MAE and RMSE values are 0 means the model exhibits 100% accuracy in predicting the groundwater class label or else if the MAE and RMSE it very closer to 0 also indicate that the model having highest accuracy rate between 98% to 100%. The lowest MAE and RMSE values indicate that there is good fit between the predicted groundwater class label and the ground truth class label. The computed MAE and RMSE values are presented in the following Table 5 and Table 6.
Table 5. The MAE values of SFART and Enhanced SFART models
|
Number of iterations |
Name of the model |
|
|
Simplified ARTMAP |
Enhanced Simplified ARTMAP |
|
|
250 |
0.340 |
0.256 |
|
500 |
0.340 |
0.103 |
|
750 |
0.285 |
0.080 |
|
1000 |
0.256 |
0.080 |
|
1250 |
0.256 |
0.068 |
|
1500 |
0.256 |
0.068 |
|
1750 |
0.256 |
0.060 |
|
2000 |
0.256 |
0.041 |
|
2250 |
0.256 |
0.041 |
|
2500 |
0.181 |
0.041 |
Table 6. The RMSE values of SFART and Enhanced SFART models
|
Number of iterations |
Name of the model |
|
|
Simplified ARTMAP |
Enhanced Simplified ARTMAP |
|
|
250 |
1.011 |
0.878 |
|
500 |
1.011 |
0.483 |
|
750 |
0.925 |
0.400 |
|
1000 |
0.878 |
0.400 |
|
1250 |
0.878 |
0.371 |
|
1500 |
0.878 |
0.371 |
|
1750 |
0.878 |
0.348 |
|
2000 |
0.878 |
0.287 |
|
2250 |
0.878 |
0.287 |
|
2500 |
0.738 |
0.287 |
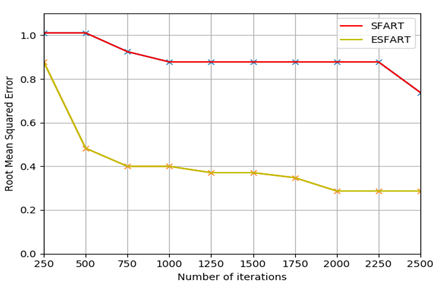
Figure 3. The root mean squared error graph of SFART and enhanced SFART
From the Figure 2, the experimental outputs of the SFART model represents the mean absolute error rate is high at 250-750 iterations by increasing the number of iterations and the mean absolute error rate is decreased. At 2500 iterations the mean absolute error rate is 0.181. The mean absolute error rate of the ESFART model is high at 250 iterations and it gets decreased to 0.041 when the number of iterations is 2000. The mean absolute error seems to be considerable when compared with the SFART model.
The root mean squared error is another widely acceptable metric as stated above to study the performance of the classification model. The computed RMSE values of the 2 models SFART and ESFART are presented in Table 6. We plotted the root means squared values in Figure 3. From the Figure 3 it is noticed that the ESFART rmse values are lower than the SFART model. At 2000 iterations it gets 0.287 error rate which is considerably very lower than the SFART model. If the rmse value is lower it indicates that the model performs well in the prediction process. If rmse values are larger means that the model performs not up to mark. If the rmse values are closer to 0 or 0 means that the model achieves 100% accuracy and there is good agreement between the predicted ground water class label and the original class label.
One can assess the performance of the classification models in terms of error rate, in this work we used the MAE and RMSE metrics to study the error rate of the 2 models. From Table 5, Table 6, Figure 2 and Figure 3 we notice that the enhanced simplified fuzzy ART model has the good fit between the training data and the test data than the simplified fuzzy ART model. It is shows that the predicted class label is same as the actual groundwater class label in 98% of the total predictions we made on the test data set. From Table 5, Table 6 and Figure 2, Figure 3 it is noticed that from 2000 iterations the MAE and RMSE value records its better values. From this analysis we conclude that the proposed weight update method improves the accuracy of the simplified fuzzy ART model to classify and predict the groundwater class label.
The conventional methods are used for the assessment of quality of the groundwater with respect to the groundwater quality parameters. After applying any one of the conventional methods, the results of the conventional method states that whether the groundwater is suitable for aquatic purposes or not. But the conventional methods lack the predictive feature. By using the machine learning models we can predict the quality of the groundwater of a given groundwater sample. In the leaning process, the machine learning model will find the optimal weights, if the model finds the optimal weights, then the model establishes a fit between the predicted value and the ground truth value. The weight update method is the key to find the optimal weights in the learning process. The simplified fuzzy adaptive resonance theory model is used in this work to classify the groundwater data. Each groundwater sample is subjected to 7 groundwater quality parameters viz., pH, Temp, Conductivity, BOD, Nitrate+Nitrite, Fecal Coliform and Total Coliform. We enhanced the simplified fuzzy adaptive resonance theory model by proposing an enhanced weight update method to classify the groundwater data. From the experimental study it is evident that the enhanced simplified fuzzy adaptive resonance theory model is the promising model to classify and predict the groundwater quality type when compared with the simplified fuzzy adaptive resonance theory model. The enhanced simplified fuzzy adaptive resonance theory model achieved 98.79%accuracy in classifying the groundwater data subjected to the above stated 7 parameters.
We have collected the groundwater samples data from Water Quality Monitoring Lab, RWS&S Sub-Division, Narsapuram, West Godavari, Andhra Pradesh, India and we thank them for their timely support and for according permission for utilizing the groundwater data samples in this research work.
|
WQI |
Water Quality Index |
|
ANN |
artificial neural network |
|
SFART |
simplified fuzzy Adaptive Resonance Theory |
|
pH |
potential of Hydrogen |
|
DO |
dissolved oxygen |
|
BOD |
biological oxygen demand |
|
TH |
total hardness |
|
TDS |
total dissolved solids |
|
T-Alk |
total alkalinity |
|
Pb |
Lead |
|
Cd |
Cadmium |
|
Cr |
Chromium |
|
Mn |
Manganese |
|
Fe |
Iron |
|
Zn |
Zinc |
|
Ni |
Nickel |
|
MAE |
mean absolute error |
|
RMSE |
root mean square error |
|
$\rho$ |
vigilance parameter |
|
Subscripts |
|
|
$\mathrm{Xi}$ |
ith value of the sample |
|
$\mathrm{Tj}$ |
activation function of the jth node |
|
$\mathrm{Wj}$ |
weights of the jth node |
[1] Horton, R.K. (1965). An index number system for rating water quality. Journal of Water Pollution Control Federation, 37: 300-306.
[2] Udeshani, W.A.C., Dissanayake, H.M.K.P., Gunatilake, S.K., Chandrajith, R. (2020). Assessment of groundwater quality using water quality index (WQI): A case study of a hard rock terrain in Sri Lanka. Groundwater for Sustainable Development, 11: 100421. https://doi.org/10.1016/j.gsd.2020.100421
[3] Brown, R.M., McClelland, N.I., Deininger, R.A., O’Connor, M.F. (1972). A water quality index -crashing the psychological barrier. Indicators of Environmental Quality, 173-182. https://doi.org/10.1007/978-1-4684-1698-5_15
[4] Lumb, A., Sharma, T.C., Bibeault, J.F. (2011). A review of genesis and evolution of water quality index (WQI) and some future directions. Water Quality, Exposure and Health, 3(1): 11-24. https://doi.org/10.1007/s12403-011-0040-0
[5] Vidyalakshmi, R., Brindha, B., BenedictRoosvelt, P.S., Rajakumar, S., PrashanthiDevi, M. (2013). Determination of land use stress on drinking water quality in tiruchirappalli, india using derived indices. Water Quality, Exposure and Health, 5(1): 11-29. https://doi.org/10.1007/s12403-012-0083-x
[6] Tyagi, S., Sharma, B., Singh, P., Dobhal, R. (2020). Water quality assessment in terms of water quality index. American Journal of Water Resources, 1(3): 34-38. https://doi.org/10.12691/ajwr-1-3-3
[7] Anwar, K., Aggarwal, V. (2014). Analysis of groundwater quality of Aligarh City, (India): Using water quality index. Current World Environment, 9(3): 851-857. https://doi.org/10.12944/cwe.9.3.36
[8] Gholami, V., Aghagoli, H., Kalteh, A.M. (2015). Modeling sanitary boundaries of drinking water wells on the Caspian Sea southern coasts, Iran. Environmental Earth Sciences, 74(4): 2981-2990. https://doi.org/10.1007/s12665-015-4329-3
[9] Saleem, M., Hussain, A., Mahmood, G. (2016). Analysis of groundwater quality using water quality index: A case study of greater Noida (Region), Uttar Pradesh (U.P), India. Cogent Engineering, 3(1). https://doi.org/10.1080/23311916.2016.1237927
[10] Saana, S.B.B.M., Fosu, S.A., Sebiawu, G.E., Jackson, N., Karikari, T. (2016). Assessment of the quality of groundwater for drinking purposes in the Upper West and Northern regions of Ghana. SpringerPlus, 5(1): 1-15. https://doi.org/10.1186/s40064-016-3676-1
[11] Adimalla, N., Marsetty, S.K., Xu, P. (2020). Assessing groundwater quality and health risks of fluoride pollution in the Shasler Vagu (SV) watershed of Nalgonda, India. Human and Ecological Risk Assessment, 26(6): 1569-1588. https://doi.org/10.1080/10807039.2019.1594154
[12] Tian, H., Du, J.Z., Ma, S.M., Kang, Z., Gong, Y. (2021). Application of water quality index and multivariate statistical analysis in the hydrogeochemical assessment of shallow groundwater in Hailun, northeast China. Human and Ecological Risk Assessment: An International Journal, 27(3): 651-667. https://doi.org/10.1080/10807039.2020.1749827
[13] Pradeep Kumar, G.N., Sujatha, P., Srinivas, P. (2010). Groundwater level forecasting using feed forward neural network trained with different algorithms. ISH Journal of Hydraulic Engineering, 16(1): 20-35. https://doi.org/10.1080/09715010.2010.10514986
[14] Khalil, B., Ouarda, T.B.M.J., St-Hilaire, A. (2011). Estimation of water quality characteristics at ungauged sites using artificial neural networks and canonical correlation analysis. Journal of Hydrology, 405(3-4): 277-287. https://doi.org/10.1016/j.jhydrol.2011.05.024
[15] Najah, A., El-Shafie, A., Karim, O.A., El-Shafie, A.H. (2014). Performance of ANFIS versus MLP-NN dissolved oxygen prediction models in water quality monitoring. Environmental Science and Pollution Research, 21(3): 1658-1670. https://doi.org/10.1007/s11356-013-2048-4
[16] Saghebian, S.M., Sattari, M.T., Mirabbasi, R., Pal, M. (2014). Ground water quality classification by decision tree method in Ardebil region, Iran. Arabian Journal of Geosciences, 7(11): 4767-4777. https://doi.org/10.1007/s12517-013-1042-y
[17] Srivastava, D., Singh, R.M. (2014). Breakthrough curves characterization and identification of an unknown pollution source in groundwater system using an artificial neural network (ANN). Environmental Forensics, 15(2): 175-189. https://doi.org/10.1080/15275922.2014.890142
[18] Sakizadeh, M., Malian, A., Ahmadpour, E. (2016). Groundwater quality modeling with a small data set. Groundwater, 54(1): 115-120. https://doi.org/10.1111/gwat.12317
[19] Lohani, A.K., Krishan, G. (2015). Groundwater level simulation using artificial neural network in Southeast, Punjab, India. Journal of Geology & Geophysics, 04(03). https://doi.org/10.4172/2381-8719.1000206
[20] Sakizadeh, M. (2016). Artificial intelligence for the prediction of water quality index in groundwater systems. Modeling Earth Systems and Environment, 2(1): 1-9. https://doi.org/10.1007/s40808-015-0063-9
[21] Wagh, V.M., Panaskar, D.B., Muley, A.A., Mukate, S.V., Lolage, Y.P., Aamalawar, M.L. (2016). Prediction of groundwater suitability for irrigation using artificial neural network model: a case study of Nanded tehsil, Maharashtra, India. Modeling Earth Systems and Environment, 2(4): 1-10. https://doi.org/10.1007/s40808-016-0250-3
[22] Zaqoot, H.A., Hamada, M., Miqdad, S. (2018). A comparative study of ann for predicting nitrate concentration in groundwater wells in the southern area of gaza strip. Applied Artificial Intelligence, 32(7-8): 727-744. https://doi.org/10.1080/08839514.2018.1506970
[23] Kadam, A.K., Wagh, V.M., Muley, A.A., Umrikar, B.N., Sankhua, R.N. (2019). Prediction of water quality index using artificial neural network and multiple linear regression modelling approach in Shivganga River basin, India. Model. Earth Syst. Environ., 5(2019): 951-962. https://doi.org/10.1007/s40808-019-00581-3
[24] Mosavi, A., Hosseini, F.S., Choubin, B., Goodarzi, M., Dineva, A.A. (2020). Groundwater salinity susceptibility mapping using classifier ensemble and bayesian machine learning models. IEEE Access, 8: 145564-145576. https://doi.org/10.1109/ACCESS.2020.3014908
[25] Latif, S.D., Azmi, M.S.B.N., Ahmed, A.N., Fai, C.M., El-Shafie, A. (2020). Application of artificial neural network for forecasting nitrate concentration as a water quality parameter: A case study of feitsui reservoir, Taiwan. International Journal of Design and Nature and Ecodynamics, 15(5): 647-652. https://doi.org/10.18280/ijdne.150505
[26] Zadeh, L.A. (1965). Fuzzy sets. Inform. Control, 8(3): 338-353. https://doi.org/10.1016/S0019-9958(65)90241-X
[27] Hosseini-Moghari, S.M., Ebrahimi, K., Azarnivand, A. (2015). Groundwater quality assessment with respect to fuzzy water quality index (FWQI): an application of expert systems in environmental monitoring. Environmental Earth Sciences, 74(10): 7229-7238. https://doi.org/10.1007/s12665-015-4703-1
[28] Gharibi, H., Mahvi, A.H., Nabizadeh, R., Arabalibeik, H., Yunesian, M., Sowlat, M.H. (2012). A novel approach in water quality assessment based on fuzzy logic. Journal of Environmental Management, 112: 87-95. https://doi.org/10.1016/j.jenvman.2012.07.007
[29] Dahiya, S., Singh, B., Gaur, S., Garg, V.K., Kushwaha, H.S. (2007). Analysis of groundwater quality using fuzzy synthetic evaluation. Journal of Hazardous Materials, 147(3): 938-946. https://doi.org/10.1016/j.jhazmat.2007.01.119
[30] Sahu, M., Mahapatra, S.S., Sahu, H.B., Patel, R.K. (2011). Prediction of water quality index using neuro fuzzy inference system. Water Quality, Exposure and Health, 3(3-4): 175-191. https://doi.org/10.1007/s12403-011-0054-7
[31] Nasr, A.S., Rezaei, M., Barmaki, M.D. (2013). Groundwater contamination analysis using Fuzzy Water Quality Index (FWQI): Yazd province, Iran. Geopersia, 3(1): 47-55.
[32] Mohamed, A.K., Dan, L., Kai, S., Mohamed, M.A.A., Aldaw, E., Elubid, B.A. (2019). Hydrochemical analysis and fuzzy logic method for evaluation of groundwater quality in the North Chengdu plain, China. International Journal of Environmental Research and Public Health, 16(3). https://doi.org/10.3390/ijerph16030302
[33] Rajasekaran, S., Pai, G.A.V. (2001). Image recognition using simplified fuzzy artmap augmented with a moment based feature extractor. International Journal of Pattern Recognition and Artificial Intelligence, 14(8): 1081-1095. https://doi.org/10.1016/S0218-0014(00)00068-4
[34] Vakil-Baghmisheh, M.T., Pavešić, N. (2003). A fast simplified fuzzy ARTMAP network. Neural Processing Letters, 17(3): 273-316. https://doi.org/10.1023/A:1026004816362
[35] Boonpoke, S., Marungsri, B. (2010). Pattern recognition of partial discharge by using simplified fuzzy ARTMAP. World Academy of Science, Engineering and Technology, 65(5): 212-219. https://doi.org/10.5281/zenodo.1083777
[36] Kakati, P., Baruah, H. (2013). The new architecture of simplified fuzzy ARTMAP for supporting medical diagnostic reasoning. International Journal of Computer Applications, 81(17): 16-19. https://doi.org/10.5120/14215-2413
[37] Alickovic, E., Subasi, A. (2013). Usage of SIMPLIFIED FUZZy ARTMAP for improvement of classification performances. Southeast Europe Journal of Soft Computing, 2(2). https://doi.org/10.21533/scjournal.v2i2.36
[38] Vincent, E.D.B., Garcia-breijo, E., Garrigues, J., Gil-sanchez, L. (2013). An embedded simplified fuzzy ARTMAP implemented on a microcontroller for food classification. Sensors, 13(8): 10418-10429. https://doi.org/10.3390/s130810418
[39] Acampora, G., Cosma, G. (2015). A comparison of fuzzy approaches to e-commerce review rating prediction. Proceedings of the 2015 Conference of the International Fuzzy Systems Association and the European Society for Fuzzy Logic and Technology, 89. https://doi.org/10.2991/ifsa-eusflat-15.2015.173
[40] De Oliveira, M.A., Inman, D.J. (2016). Simplified fuzzy ARTMAP network-based method for assessment of structural damage applied to composite structures. Journal of Composite Materials, 50(25): 3501-3514. https://doi.org/10.1177/0021998315621964
[41] de Oliveira, M.A., Inman, D.J. (2017). Performance analysis of simplified fuzzy ARTMAP and probabilistic neural networks for identifying structural damage growth. Applied Soft Computing Journal, 52: 53-63. https://doi.org/10.1016/j.asoc.2016.12.020
[42] Naga, R., Satya, D., Kiran, S., Aparna, C., Radhika, S. (2021). Classification of groundwater by applying simplified fuzzy adaptive resonance theory. International Journal of Design & Nature and Ecodynamics, 16(2): 167-176. https://doi.org/10.18280/ijdne.160206
[43] Standard, I. (2012). BIS IS: 10500 Indian Standard: Drinking Water-Specification, first revision 2012, Bureau of Indian Standards New Delhi, India.
[44] Adimalla, N. (2019). Groundwater quality for drinking and irrigation purposes and potential health risks assessment: A case study from semi-arid region of South India. Exposure and Health, 11(2): 109-123. https://doi.org/10.1007/s12403-018-0288-8
[45] Subba Rao, N. (2018). Groundwater quality from a part of Prakasam District, Andhra Pradesh, India. Applied Water Science, 8(1). https://doi.org/10.1007/s13201-018-0665-2
[46] Subba Rao, N., Srihari, C., Deepthi Spandana, B., Sravanthi, M., Kamalesh, T., Abraham Jayadeep, V. (2019). Comprehensive understanding of groundwater quality and hydrogeochemistry for the sustainable development of suburban area of Visakhapatnam, Andhra Pradesh, India. Human and Ecological Risk Assessment, 25(1-2): 52-80. https://doi.org/10.1080/10807039.2019.1571403
[47] Liu, J., Gao, Z., Wang, Z., Xu, X., Su, Q., Wang, S., Xing, T. (2020). Hydrogeochemical processes and suitability assessment of groundwater in the Jiaodong Peninsula, China. Environmental Monitoring and Assessment, 192(6). https://doi.org/10.1007/s10661-020-08356-5