Huda Sulaiman Ghalib* | Majeed Mattar Ramal
© 2021 IIETA. This article is published by IIETA and is licensed under the CC BY 4.0 license (http://creativecommons.org/licenses/by/4.0/).
OPEN ACCESS
Heavy metal concentrations in a water sample from Habbaniyah Lake (HL), Iraq (Cr, Cd, Ni, Fe, Co, Zn, Pb, and Cu). Thirty-three sites were chosen in the research area from October 2020 to April 2021 to evaluate emissions of heavy metals during two seasons (dry and wet). Spectrophotometer for atomic absorption was used to test heavy metal concentration (USA Phoenix-986). The findings of the study indicate that water levels were concentrated Cr>Ni >Fe>Co>Pb>Zn=Cd=Cu during the dry season and the wet season Cr>Fe>Pb>Co>Ni=Zn=Cd=Cu. HMPI and HMEI were both used to assess the level of water supply toxicity of heavy metals in the area of research. In Habbaniyah Lake water, several concentrations of heavy metals exceed the criteria for drinking and water life such as Co and Pb were exceed the allowed limits of WHO, CCME in the dry and wet seasons. The study area's human, agricultural and industrial activities and human population resulted in a rise in heavy element concentrations including Cr that surpassed the WHO, CCME, FAO, EPA, and IQS. The mean values of (Cd, Zn, and Cu) during dry and wet seasons were non-consistent in all stations. The average value of Ni was above water life limit during the dry season. The average values of CD, HMPI, and HMEI during the wet season were 20.8984, 57.8248 and 24.8977 and in the dry season were 17.3745, 61.8769, and 22.3747 respectively. Results indicate that HL is highly contaminated with HMs according to national and international guidelines, (CD), (HMPI) and (HMEI) indices pointed that HL water quality was bad. Principal component analysis (PCA) and cluster analysis (CA) were applied to estimate the pollution sources, results show that, pollution are originated from multiple sources, anthropogenic sources are major pollution sources while lithogenic is minor pollution sources, anthropogenic origin, which is mostly due to the wastewater point sources on Warrar stream.
water quality, pollution assessment, heavy metal, heavy metal pollution index (HMPI), heavy metal evaluation index (HMEI), contamination degree (CD)
The nature of the water is famous for its physical, chemical, and biological properties [1]. Due to their toxicity and alleged persistence within aquatic settings, interest in heavy metals (HMs) in environmental conditions has increased in past years [2, 3]. Heavy metals, which include both vital and non-essential elements, are particularly important in ecotoxicology because they are very persistent and can all be harmful to live species [4-6]. Trace metals are among the most important environmental toxins and the presence of natural or biota in water sources of anthropogenic [7]. Surface water can pose a major danger to water environments through chemical toxicity causing acute and chronic toxicity in water environments, ecosystem accumulation, habitat degradation, and biodiversity destruction, as well as a potential danger to human health [8]. Trace metals have taken place in marine habitats and have created significant questions over their effects on plants and animals. Heavy metals accumulation in water, the clean safe water, which another of the main elements for human wellbeing, induces water loss and thus reduces the quality of water and cannot use the water in some uses [9]. The toxicity of heavy metal for people and the ecosystem is a concern because it accumulates in the food chain and is non-biodegradable. Metals like Fe, Zn, Cu, and Ni are essential for animals and plants to survive, but other metals like Pb, Cd, and Cr have physiological effects on animals and plants. To evaluate the state of pollution in the environment, heavy metal concentrations can also be analyzed and distributed in the environment. [5, 10, 11]. Heavy metals are most much the source of pollution of the water system because of numerous anthropological causes such as industrial wastewater, drainage of municipal surface water, agriculture processes, etc. [12]. Sources of heavy metals are anthropogenic (agriculture activities, industries, and mining) and natural (weathering of soils and rocks) [8, 11, 13-18]. These heavy metals can be accumulated strongly along the water, the food chain, and sediment which causes the deadly effects of aquatic organisms [19, 20]. Natural sources are mostly low in concentrations, however higher levels of anthropogenic sources cause environmental problems [3]. Agricultural, human and industrial activities are the main cause of toxic metals accumulates in rivers, sediments, plants, and animals [21-23]. Quality of water is decreasing due to indiscriminate use of pesticides and heavy-metal fertilizers in irrigation, mining, final disposal of toxic metal-bearing waste and metal from various factories such as steel, battery production, thermal energy, and etc. [24]. Several water quality assessing approaches, including the Pollution Index (CD), (HPI) and the Heavy Metal Assessment Index have been established (HEI). Al-Saadi and et al developed Regression Model for Estimating Irrigation Water Quality Index, the data demonstrate that 90 percent of groundwater wells have IWQI levels that fall into the Severe Restriction category, while the remaining 10% had IWQI values that fall into the High Restriction category. The constructed model's calibration and validation revealed that it has a decent estimation of the IWQI values [25].
The actual water discharge levels are measured in these indexes and integrate all parameters of water pollution into a single method [17]. This research aims at determining heavy metal concentrations (Cr, Cd, Ni, Fe, Co, Zn, Pb, and Cu) in water of Habbaniyah Lake, estimating the Heavy Metal Pollution Index (HMPI), Heavy metal evaluation index (HMEI) and communication degree (CD) optimal risk on the human to assess pollution in water of Habbaniyah Lake.
2.1 Study area
Habbaniyah Lake (HL) is centrally situated in Iraq (33°18'21"N 43°26'14 "E) 51 m above sea level in height, as seen in Figure 1. Its depth is 9-13 meters, its length is 35 kilometers, its maximum width is 25 kilometers, and its storage capacity is 3.26 x 10⁹ cubic meters. The Euphrates River feeds the Habbaniyah Lake (HL) by the Warrar stream, The Majara Canal releases the water into Lake Razzazah, and the Theban Canal recirculates the water in the Euphrates River.
Figure 1. Location of the study area of HL
2.2 Sampling
In this study was selected thirty-three sites around the research area from October 2020 to May 2021, with water samples being determined using (Garmin Gps map 60 Csx). Water samples were collected using clean Polyethylene bottles (2 L) and take (15 ml) water sample. The process of digesting water samples was added (37% HCl) and (65% HNO3) to water samples in a flask size of (100 ml), filtered the samples through Whatman paper (No. 42) to exclude unwanted objects (e.g., wood pieces, plants, and other particles) and keep at (4°C) for more study. Then by using a hot plate at (200°C) were heated samples to match the sample size (1 ml) with the addition of double water (24 ml) in the flask size (25 ml). The analysis was then carried out using an atomic absorption spectrophotometer (USA Phoenix-986).
Nine soil samples were taken from selected sits around the lake to quantify the HMs in soil, the samples were dried within the electrical oven at a 120°C for 3 hours and measuring one gram of every sample employing a sensitive balance. The process of digesting sediment samples was applied as water samples except that the sediment sample was one gram.
Sediments bed from HL were examined to measure the HMs concentrations, results show high concentrations of HMs in sediments bed. HMs in sediments bed were analysed as same soil samples [26].
2.3 Materials
(USA Phoenix-986) atomic absorption spectrophotometer (AAS) is the instrument that has been tested for heavy metal (HMs) analysis, Responsive balance, National Research Council-Canada ((NRCC), Regular (NASS-5) and Nitrate salt has been utilized to make some standard Ni, Cd, Cr, Fe, Co, Zn, Cu, and Pb solutions, using geographic information systems technology (ARC GIS.V 10.33) in research mapping and determination of water samples by using (GPS).
2.4 Evaluation pollution of heavy metal
To evaluate the portability of water and the effect of heavy metals on humans and their formulations dealing with relevant heavy metal features, the indices used for the study were developed: the Heavy Metal Evaluation Index (HEI), the Heavy Metal Pollution Index (HPI), and the Containment Degree (CD) [8, 16]. For calculating indices, a standard was used HPI and HEI calculation values (WHO guidelines) (Table 1).
Table 1. Applied HMPI and HMEI estimation parameters and constants (according to WHO guidelines)
|
Metal |
MCL*mg/l |
Wi |
Ii |
Si |
MAC |
|
Co |
0.05 |
20 |
0.004 |
0.11 |
0.05 |
|
Fe |
0.2 |
5 |
0.2 |
0.3 |
0.2 |
|
Pb |
0.0015 |
666.67 |
0.01 |
0.1 |
0.0015 |
|
Cr |
0.05 |
20 |
0.05 |
0.1 |
0.05 |
|
Ni |
0.02 |
50 |
0 |
0.02 |
0.02 |
|
Zn |
5 |
0. 2 |
0.2 |
5 |
5 |
|
Cd |
0.003 |
300 |
0 |
0.005 |
0.003 |
|
Cu |
1 |
1 |
0.05 |
1 |
1 |
Wi =Weightage (1/MAC), Si = Allowable standard in ppm, Ii = Highest allowed in ppm, MAC: Maximum allowable concentration.
2.4.1 Contamination factor and contamination degree
In this analysis the contaminating CF element and the extent of contamination used to define water pollution. For the concept of pollution element, CF values are recommended [10]. Cf < 1 (low factor); 1 to Cf < 3 (moderate factor); 3 = Cf < 6 (significant factor of pollution); Cf =6 (very high contamination factor). Both emission causes were detected for the level of pollution (CD).CD < 6(low pollution degree); 6 = CD < 12 (moderate pollution degree); 12 = cd < 24 (significant pollution degree); cd = 24 (High contamination level suggesting significant anthropogenic contamination). The pollution degree (CD) and pollution Factor (Cf) are calculated from Eqns. (1) and (2):
$C D=\sum_{i=1}^{n} C f i$ (1)
$C f i=\frac{C_{A i}}{C_{N i}}-1$ (2)
The analytical value for ith is the Cai element, and The CNi in the ith section is the maximum allowable concentration [27].
2.4.2 Index of background enhancement (Indices calculation)
(1) Heavy Metal Pollution Index (HMPI)
The HMPI index is one of the highest rating methodologies and a very valuable instrument that offers a cumulative impact on water quality by individual heavy metals [28]. The overall level for heavy metals in drinking water is shown [29]. This index shall be determined under the following Eqns. (3) and (4):
$H M P I=\frac{\sum_{i=1}^{n} W i . Q i}{\sum_{i=1}^{n} w i}$ (3)
$Q_{i}=\sum_{i=1}^{n} \frac{M i(-) I i}{S i-I i} \widehat{n} 100$ (4)
where, Qi and Wi are the subs for ith and the weighting units for ith indices. n takes the number of variables into consideration. The heavy metal monitoring values of Mi, Ii, and Si are both the optimal and normal parameters of the ith individual. The sign (−) represents values number that overlook the algebraic symbol. Includes, low (under 100), high (over 100) threshold risk (equal 100). If the water content is higher than 100, the water cannot be used as drinking [28, 29].
(2) Heavy Metal Evaluation Index (HMEI)
The HMEI measures the water's total quality in terms of heavy metal content [8]. HMEI is an indicator of heavy metal water content in potable water [29]. HMEI index is determined as follows by Eq. (5):
$H M E I=\sum_{i=1}^{n} \frac{H c}{H m a c}$ (5)
where, Hc and Hmac are the tracked and maximally allowable concentrations of the ith parameters. The HEI index classifications are low (less than 10), medium (between 10 and 20), and heavy (more than 20).
2.5 Statistical analysis
Multivariate procedure gives appropriate quantitative and qualitative data about the pollutant’s origins [30]. Applying of a single Multivariate method alone to water quality data can yield highly important information on water quality [31, 32]. We apply two Multivariate methods in this study: Principal Component Analysis (PCA) and Cluster Analysis (CA).
PCA's goals are to extract underlying data from multivariable raw data as a set of uncorrelated (i.e., orthogonal) variables. PCA examines a data set containing observations characterized by a number of implied variables that are generally, inter-correlated.
These variables are known as principal components, singular vectors, eigenvectors, or loadings. Each unit also creates a list of scores based on its projection on the components.
The significance of every component is represented by the variance of its projection or by the ratio of the variance illustrated [33].
The vertical rotation was used so as to reduces the variables number of a high loading on every component and improves the understanding of relations and the potential origin of metals, lithogenic or anthropogenic [34, 35].
In the context of the sources of water contaminants, the multivariate statistic approach of a limited collection of data combined with additional information might give important insight about pollutant origins [36, 37].
Cluster analysis (CA) is one of predictive data analysis techniques that is used to solve classification issues. Its purpose is to group or cluster situations, data, or objects. The clusters should have high exterior (between-cluster) heterogeneity and high internal (within-cluster) homogeneity [38].
The most popular technique, hierarchical CA, begins with each issue in a new cluster and gradually links clusters together until only one cluster produces [39].
A dendrogram or binary tree is the best way to represent the results of applying cluster analysis. further depth about this approach by Salah et al. [40].
Pearson's correlation, PCA, and CA were performed applying IBM SPSS Statistic 26 software to investigate the heavy metals origin in water of HL.
3.1 Concentration of heavy metal in water
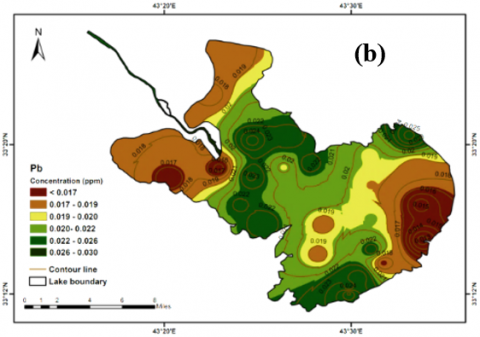
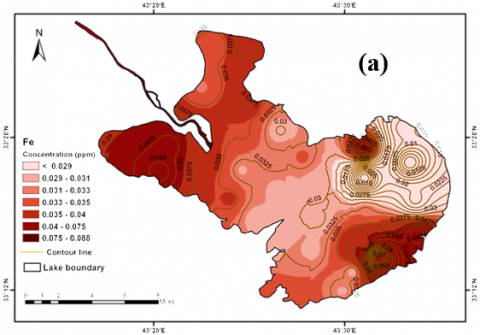
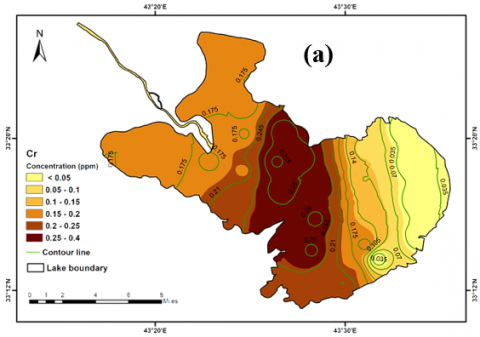
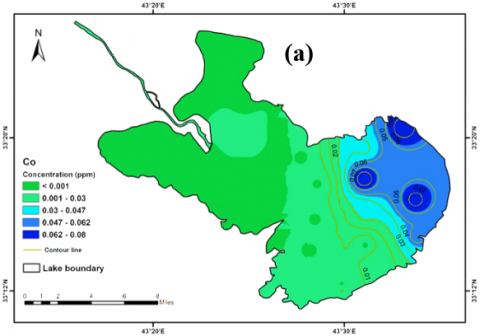
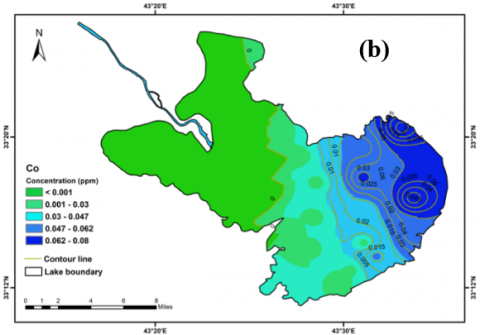
Table 2 objectively determines the amounts of heavy metals obtained from the HL in the area of research. Figures 2 (2a&2b), 3(3a&3b), 4(4a&4b) and 5(5a&5b) show the Spatial and temporal concentration during wet(a) and dry season(b) of (Pb), (Fe), (Cr) and (Co) respectively. In the dry order, the mean concentration of the metals analyzed in the water is as follows: Cr >Ni >Fe>Co>Pb>Zn=Cd=Cu and in the wet season Cr>Fe>Pb>Co>Ni=Zn=Cd=Cu. During the (dry and wet) seasons, the average concentration of Cr was 0.209 and 0.164 mg/l, respectively, above WHO, FAO, IQS, EPA and CCME drinking, irrigation, Iraqi Standards, Environmental Protection Agency, and aquatic life standards, respectively. During the dry and wet seasons, average levels of Fe inside the WHO, FAO, EPA, IQS and CCME were 0.035 and 0.037 mg/l respectively. Interestingly, the maximum Fe concentration was found at the W3 site (0.0885 mg/l) during the wet season. The average Co concentration in the wet (0.0153 mg/l) was less than in dry (0.024 mg/l), but it was also higher than the WHO, IQS, and CCME limits. The average values in Pb of water during dry and wet seasons was 0.0205 mg/l and 0.0206 mg/l respectively, above (WHO), (EPA) and (CCME) recommendations for marine life and below the allowable limits of Food, (FAO) and IQS guidelines (Table 2). The mean values of (Cd, Zn, and Cu) were non-consistent in all stations during wet and dry seasons due to the standard of (AAS), the device did not measure these metals due to very low concentrations of these metals were within the allowable limits of WHO, FAO, IQS, EPA, and CCME guidelines (Table 2). During the dry season Ni was above the CCME limit of aquatic organisms, an average of 0.07 mg/l, during dry time attributable to agricultural and human activity, the highest value of Ni was found in the site W3 (0.097 mg/l), exceeding the standards of the WHO and CCME limits for drinking and living water and during the wet season the mean value of Ni was non-consistent. The values of Ni were recorded in Warrar stream during the dry season and not recorded in HL because a concentration was diluted with the river water and therefore concentration is non-consistent. The maximum values of the measured metals (Fe and Co) were recorded at S1 during the dry season this can be due to the lack of treatment stations for inlet water in Lake as well as this water from industrial facilities such as sand and gravel facilities that located near the lake, in additions auto laundry, fat and gasoline resulting from cars and river boats that leads to increases the concentration of heavy metals. Seasonal differences of metals in water were found, with dry showing higher amounts than wet [41]. Higher levels of Cr and Ni in the dry season and lower in the wet season were observed. The high level of Pb at S1 and W3 in water during wet and dry season might be due to industrial and agriculture waste and erosion sources, stations vary spatially and can be caused by the distribution of elements affecting many significant spatial variables, such as human population, Lake bank densities, hydrological conditions on the beds, dumping by local factories, and wastewater disposals [2].
Which has large amounts of fuel combustion lead in cars, was also caused by Concentrations of heavy metals analyzed between various the spillover of fuel from fishing vessels. Due to the heavy fuel consumption causes higher Pb levels in water bodies [42].
Results show that water of Habbaniyah Lake was highly polluted by HMs, therefore extra research done to know the HMs origin source. wastewater discharge points, Soil samples and sediments bed were taken from specified agricultural areas, and Habbaniyah Lake sediments bed.
Figure 2. Spatial and temporal concentration of Lead (Pb) during: (a) wet, and (b) dry season
Figure 3. Spatial and temporal concentration of Iron (Fe) during: (a) wet, and (b) dry season
Figure 4. Spatial and temporal concentration of Chromium (Cr) during: (a) wet, and (b) dry season
Figure 5. Spatial and temporal concentration of Cobalt (Co) during: (a) wet, and (b) dry season
Table 2. Heavy metals analytical value and guidelines (mg/l)
|
HMs |
Average HMs Conc.±S.D. |
D (a) |
I (b) |
AL (c) |
IQS |
EPA |
|
Pb |
0.02±0.0045 |
0.01 |
5 |
0.007 |
0.05 |
0.015 |
|
Fe |
0.036±0.018 |
0.3 |
5 |
0.3 |
0.1 |
0.3 |
|
Cr |
0.187 ±0.096 |
0.05 |
0.1 |
0.001 |
0.05 |
0.1 |
|
Cd |
0.000±0.000 |
0.003 |
0.01 |
0.001 |
0.005 |
0.005 |
|
Ni |
0.035±0.009 |
0.07 |
0.2 |
0.025 |
0.2 |
- |
|
Co |
0.019±0.019 |
0.01 |
0.1 |
0.002 |
0.01 |
- |
|
Zn |
0.00±0.00 |
3 |
2 |
0.005 |
5 |
5 |
|
Cu |
0.00±0.00 |
2 |
0.2 |
0.005 |
1 |
1.3 |
D: Driking; I: Irrigation; AL: Aquatic lif ;(a): WHO (2011); (b): FAO (1994); (c): CCME (2007); IQS (2005) Iraqi Standard; EPA (2009) Environmental Protection Agency.
3.2 Wastewater discharge
There are three point source discharging directly the untreated wastewater into Warrar canal, Then pollutants transformed indirectly into Habbaniyah lake [43].
Tests were applied to measure HMs in wastewater show the wastewater polluted with heavy metals. Table 4 show the heavy metals concentration in wastewater discharged indirectly to Habbaniyah Lake.
3.3 Heavy metal in sediments bed
Sediments beds from HL were analysed to measure the HMs concentrations. Results of HMS concentration in sediments bed of HL shown in Table 3.
3.4 Heavy metals in soil
Nine soil samples were taken from selected sits around the lake to quantify the HMs in soil. Results of HMS concentration in soil of HL shown in Table 3.
3.5 Assessment of metal pollution
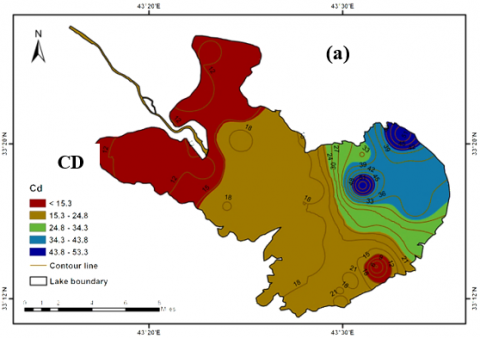
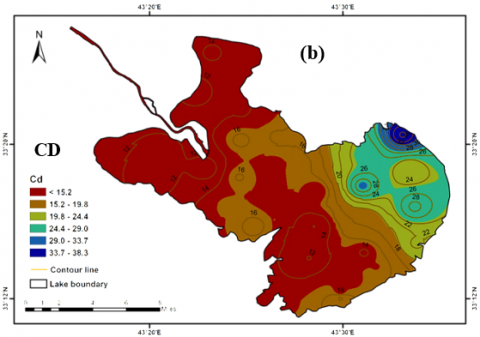
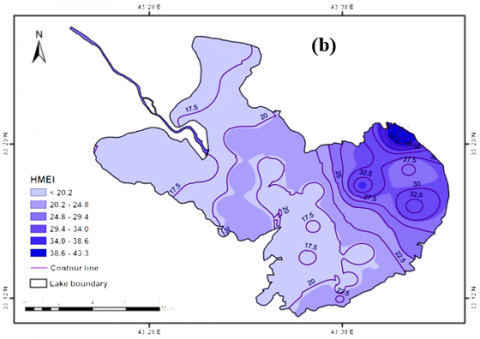
Contamination degree (CD) has been used to measure metal pollution levels [16]. Table 5 shows the heavy metal distribution water quality indices spatially and temporally (CD, HMEI, and HMPI). Figures 6(6a&6b), 7(7a&7b) and 8 (8a&8b) show the spatial and temporal variation during the dry and wet season of (CD, HMEI, and HMPI) respectively. The average CD value of samples in the wet season is 20.89848, while this value decreases notably during dry to 17.37455, so the regions are classified considerable degree of contamination. The maximum pollution degree recorded in S1 during the wet and dry season were recorded in the wet season (53.29) and the dry season (38.27), classified a pollution level that is very high because of agricultural and human activates and sewage without treatment. The lowest contamination degree recorded in S5 (5.77) classified a low degree of contamination and S28 (10.59) classified a moderate degree of contamination during wet and dry season respectively. Contamination of heavy metal in aquatic environment and heavy metal pollution have also been evaluated with the HMPI and HMEI. The average HMPI value during the wet season is (57.8248), while during the dry season (61.87697). The HMPI calculated shows values ranging from 16.56 and 101.56 in the wet season (mean 57.8248) and the dry season vary from 21.3 to 108.07 (mean 61.87697) according to the standard of HMPI that the water of the Lake is low contamination by heavy metal. The mean value of (HMEI) was 24.89772 and 22.37479 during the wet and dry seasons respectively, the mean value of (HMEI) increased during the wet season so this indicates high heavy metals level pollution and inappropriate for drinking water samples have been found in the research region. The maximum values of CD and HMEI were recorded in S1 during seasons due to use fertilizers and chemicals materials in agriculture that are added to the agricultural soil to improve soil quality and use the surface irrigation that effects to the water return to HL from this agricultural fields especially those irrigation projects are located along the Euphrates River, in addition to ground water, rural wastewater, Population growth that gets in the area, and industrial activities near these stations can be attributed to high values. The minimum values of CD and HMEI were recorded in S5 in the wet season while registered in S28 in dry season these regions classified had low contamination by heavy metals because there is no agricultural and industrial activity and far from the population assembly in this region. The maximum value of (HMPI) was recorded in S7 (101.56) because of industrial activity while in the dry season was recorded in S6 (108.07) due to human activity and sewage without treatment these areas were classified high polluted by heavy metals. The minimum value of (HMPI) recorded in S5 (16.56) during the wet season and S5 (21.3) during the dry season because this area is far from the population and agricultural activity. The HMPI values of this analysis show that water from the lake is low polluted, which based on classification of HMPI method (average HMPI 57.82 and 61.87 for wet and dry respectively) so that leads to low polluted by heavy metals.
The number of pages for the manuscript must be no more than ten, including all the sections. Please make sure that the whole text ends on an even page. Please do not insert page numbers. Please do not use the Headers or the Footers because they are reserved for the technical editing by editors.
Table 3. Average Heavy metals analytical value in soil and sediments beds and guidelines
|
Wastewater mg/L |
Soil mg/Kg |
Sediment mg/Kg |
|||||
|
Metals |
Wastewater |
IQS Discharge(a) |
EPA |
soil |
USEPA guideline |
Sediments bed mg/ kg |
USEPA guideline |
|
Pb |
0.5756 |
0.05 |
0.015 |
1.337 |
40 |
47.354 |
40 |
|
Fe |
3.7475 |
0.3 |
0.3 |
245 |
30 |
2152.971 |
30 |
|
Cr |
0.6371 |
0.05 |
0.1 |
1.413 |
25 |
25.188 |
25 |
|
Ni |
0.4523 |
0.1 |
- |
4.47 |
16 |
18.002 |
16 |
|
Co |
0.269 |
0.05 |
- |
1.328 |
- |
10.608 |
- |
IQS (2005) Iraqi Standard, EPA (2009) Environmental Protection Agency, USEPA [1999]
Figure 6. Spatial and temporal variation of (CD) during: (a) wet, and (b) dry season
Figure 7. Spatial and temporal variation of (HMEI) during: (a) wet, and (b) dry season
Figure 8. Spatial and temporal variation of (HMPI) during: (a) wet, and (b) dry season
3.6 Pollution Source
The principal component analysis (PCA) was performed to investigate the relationship among the five metals analyzed. Table 4 shows the Pearson correlation coefficients results and the associated matrix developed in the study.
Table 4. PCA matrix of HMs during wet and dry seasons
|
Wet season (P < 0.05) |
|||||
|
|
Cr |
Pb |
Fe |
Co |
|
|
Cr |
1.000 |
|
|
|
|
|
Pb |
0.416* |
1.000 |
|
|
|
|
Fe |
-0.221 |
-0.251 |
1.000 |
|
|
|
Co |
-0.728** |
-0.191 |
-0.319 |
1.000 |
|
|
Dry season (P < 0.05) |
|||||
|
|
Ni |
Cr |
Pb |
Fe |
Co |
|
Ni |
1.000 |
|
|
|
|
|
Cr |
-0.220 |
1.000 |
|
|
|
|
Pb |
0.408* |
0.035 |
1.000 |
|
|
|
Fe |
0.482** |
-0.284 |
0.315 |
1.000 |
|
|
Co |
-0.022 |
-0.569** |
-0.247 |
0.026 |
1.000 |
*. Correlation is significant at the 0.05 level (2-tailed).
**. Correlation is significant at the 0.01 level (2-tailed).
Table 5. PCA (Rotated matrix) of HMs during wet and dry seasons
|
Wet season |
||
|
Element |
Factor 1 |
Factor 2 |
|
Cr |
0.454 |
0.171 |
|
Pb |
0.205 |
0.426 |
|
Fe |
0.142 |
-0.678 |
|
Co |
-0.517 |
0.259 |
|
Eigen value |
1.934 |
1.322 |
|
Variance explained % |
48.354 |
33.049 |
|
Cumulative variance % |
48.354 |
81.404 |
|
Dry season |
||
|
Element |
Factor 1 |
Factor 2 |
|
Ni |
0.437 |
0.034 |
|
Cr |
-0.103 |
-0.51 |
|
Pb |
0.4 |
-0.212 |
|
Fe |
0.405 |
0.105 |
|
Co |
-0.104 |
0.534 |
|
Eigen value |
1.907 |
1.627 |
|
Variance explained % |
38.143 |
32.535 |
|
Cumulative variance % |
38.143 |
70.678 |
The principal components with eigenvalues larger than 1 were extracted with loadings rotated for the maximum variance. Two factors (F1 and F2) were extracted, accounting for wet season were 48.354% and 33.049% respectively, of the total variance of 81.404% as shown in Table 5. (F1 and F2) were extracted, accounting for dry season were 38.143% and 32.535% respectively, of the total variance of 70.678%. Table 5 provides numerical representation for the relations between the HMs and the two factors, during wet season, results show moderately connection between Cr and factor 1, and also moderate relation between Pb and factor 2.
In addition, during dry season, results show moderately connection among Ni, Pb and Fe with factor 1, and also moderate relation between Co and factor 2. This means HMs originated from multi sources (lithogenic and anthropogenic). Results confirmed the estimation provided by Table 4, that the relation between HMs are either insignificance or moderately, and the optimal origin from the factor are moderately, therefore the major pollutant source may be contributed from anthropogenic origin, which mostly due to the wastewater point sources on Warrar stream, and the minor source is lithogenic. Two components (F1 and F2) were with an eigenvalue greater than 1, which points the exist of multi sources of HMs in HL.
In the study, water quality of Habbaniyah lake (HL) was analyzed and distribution characteristics of heavy metals (Cd, Cu, Pb, Cr, Zn, Ni, Fe, Co) pollution during two seasons (dry and wet). The concentrations of heavy metals during dry season were a greater than wet season, there was simple difference between the two seasons, The average heavy metal concentration in water over the dry is as follows: Cr>Ni>Fe>Co>Pb>Zn=Cd=Cu while follows Cr>Fe>Pb>Co>Ni=Zn= Cd=Cu over wet seasons.
The mean levels of some HMs concentrations were greater than the safe prescribed by WHO, CCME, and EPA. HMPI, (HMEI), and (CD) were because in dry season agricultural crops need large amounts of water and use of surface irrigation style, in addition to the fertilizers and chemicals materials in agriculture that are added to the agricultural soil to improve soil quality that produce the heavy metals that effect on the lake and industrial activities, human population, sewage without treatment and tourist activity during the dry season. In all stations the average (Cd, Zn and Cu) values during the seasons were inconsistent due to the standard of (AAS) the device did not feel these metals due to lack of concentrations of these metals. High concentrations of average HMs in HL water are due to: 1) HL represents the final discharge of many effluent point sources from agricultural and residential areas without treatment; 2) The bad water quality of Euphrates River at upstream; 3) The surrounding area of the HL has been subjected to military activities and bombings in previous years; we believe that military actions may be a significant source of elevated heavy metals such as (Ni, Cu, Zn, Pb) in the studied region; 4) using inappropriate fishing methods such as (toxic chemicals and explosives); 5) Industrial activates and population growth. All these reasons lead to the increase of the concentrations of heavy metals in water.
Finally, results indicate that HL is highly contaminated with HMs according to national and international guidelines (CD), (HMPI) and (HMEI) indices pointed that HL water quality was bad.
[1] AL-Fahdawi, A.A.H., Rabee, A.M., Al-Hirmizy, S.M. (2015). Water quality monitoring of Al-Habbaniyah Lake using remote sensing and in situ measurements. Environmental Monitoring and Assessment, 187(6): 1-11. https://doi.org/10.1007/s10661-015-4607-2
[2] Balasim, H.M., Al-azzawi, M.N., Rabee, A.M. (2013). Assessment of pollution with some heavy metals in water, sediments, and Barbus xanthopterus fish of the Tigris River – Iraq. Iraqi Journal of Science, 54(4): 813-822.
[3] Ezziyyani, M. (2019). Advanced Intelligent Systems for Sustainable Development (AI2SD’2018). Vol 2: Advanced Intelligent Systems Applied to Energy. https://doi.org/10.1007/978-3-030-12065-8
[4] Öztürk, M., Özözen, G., Minareci, O., Minareci, E. (2009). Determination of heavy metals in fish, water, and sediments of Avsar dam lake in Turkey. Iranian Journal of Environmental Health Science and Engineering, 6(2): 73-80.
[5] Yunus, K., Zuraidah, M.A., John, A. (2020). A review on the accumulation of heavy metals in coastal sediment of Peninsular Malaysia. Ecofeminism and Climate Change, 1(1): 21-35. https://doi.org/10.1108/efcc-03-2020-0003
[6] Benzer, S., Arslan, H., Uzel, N., GÜl, A., Yilmaz, M. (2013). Concentrations of metals in water, sediment, and tissues of Cyprinus Carpio L., 1758 from Mogan Lake (Turkey). Iranian Journal of Fisheries Sciences, 12(1): 45-55.
[7] Mohiuddin, K.M., Zakir, H.M., Otomo, K., Sharmin, S., Shikazono, N. (2010). Geochemical distribution of trace metal pollutants in water and sediments of downstream of an urban river. International Journal of Environmental Science and Technology, 7(1): 17-28. https://doi.org/10.1007/BF03326113
[8] Khoshnam, Z., Sarikhani, R., Dehnavi, A.G., Ahmadnejad, Z. (2017). Evaluation of water quality using heavy metal index and multivariate statistical analysis in Lorestan Province, Iran. J Adv. Environ Health Res, 5(1): 29-37. https://doi.org/10.22102/JAEHR.2017.47756
[9] Mirzabeygi, M., Abbasnia, A., Yunesian, M., Nodehi, R. N., Yousefi, N., Hadi, M., Mahvi, A.H. (2017). Heavy metal contamination and health risk assessment in drinking water of Sistan and Baluchistan, Southeastern Iran. Human and Ecological Risk Assessment, 23(8): 1893-1905. https://doi.org/10.1080/10807039.2017.1322895
[10] Shanbehzadeh, S., Vahid Dastjerdi, M., Hassanzadeh, A., Kiyanizadeh, T. (2014). Heavy metals in water and sediment: A case study of Tembi River. Journal of Environmental and Public Health, 2014: 858720. https://doi.org/10.1155/2014/858720
[11] Khazaal, S.H., Al-Azawi, K.F., Eassa, H.A., Khasraghi, A.H., Alfatlawi, W.R., Al-Gebori, A.M. (2019). Study the level of some heavy metals in the water of lake Hananiah in Al-Anbar-Iraq. Energy Procedia, 157: 68-74. https://doi.org/10.1016/j.egypro.2018.11.165
[12] Singovszka, E., Balintova, M., Demcak, S., Pavlikova, P. (2017). Metal pollution indices of bottom sediment and surface water affected by acid mine drainage. Metals, 7(8): 284. https://doi.org/10.3390/met7080284
[13] Al-Sarraj, E.S., Jankeer, M.H., Al-rawi, S.M. (2019). Estimation of the concentrations of some heavy metals in water and sediments of Tigris River in Mosul City. Rafidain Journal of Science, 28(1): 1-10. https://doi.org/10.33899/rjs.2019.159401
[14] Muhammad, S., Shah, M.T., Khan, S. (2011). Health risk assessment of heavy metals and their source apportionment in drinking water of Kohistan region, northern Pakistan. Microchemical Journal, 98(2): 334-343. https://doi.org/10.1016/j.microc.2011.03.003
[15] Abdulhameed, I.M., Sulaiman, S.O., Najm, A.B.A. (2021). Reuse wastewater by using water evaluation and planning (WEAP)(Ramadi City–Case Study). In IOP Conference Series: Earth and Environmental Science, 779(1): 012104. https://doi.org/10.1088/1755-1315/779/1/012104
[16] Biswas, P.K., Uddin, N., Alam, S., Sultana, S., Ahmed, T. (2017). Evaluation of heavy metal pollution indices in irrigation and drinking water systems of Barapukuria coal mine area, Bangladesh. American Journal of Water Resources, 5(5): 146-151. https://doi.org/10.12691/AJWR-5-5-2
[17] Sobhanardakani, S. (2016). Evaluation of the water quality pollution indices for groundwater resources of Ghahavand plain, Hamadan province, western Iran. Iranian Journal of Toxicology, 10(3): 35-40.
[18] Sulaiman, S.O., Najm, A.B.A., Kamel, A.H., Al-Ansari, N. (2021). Evaluate the optimal future demand of water consumption in Al-Anbar province in the West of Iraq. Planning, 16(3): 457-462. https://doi.org/10.18280/ijsdp.160306
[19] Jiao, Z., Li, H., Song, M., Wang, L. (2018). Ecological risk assessment of heavy metals in water and sediment of the Pearl River Estuary, China. In IOP Conference Series: Materials Science and Engineering, 394(5): 052055. https://doi.org/10.1088/1757-899X/394/5/052055
[20] Shamsaie Mehrgan, M., Hosseini Shekarabi, S.P., Hassanzadeh, B., Seyed Alhosseini, S.H. (2019). Seasonal variations of cadmium and lead concentrations in water, sediments, and tissues of fish in Mellat artificial lake, Iran. Journal of Human, Environment, and Health Promotion, 5(4): 177-182. https://doi.org/10.29252/jhehp.5.4.6
[21] Yi, L., Gao, B., Liu, H., Zhang, Y., Du, C., Li, Y. (2020). Characteristics and assessment of toxic metal contamination in surface water and sediments near a Uranium mining area. International Journal of Environmental Research and Public Health, 17(2): 548. https://doi.org/10.3390/ijerph17020548
[22] Pejman, A.H., Nabi Bidhendi, G.R., Karbassi, A.R., Mehrdadi, N., Esmaeili Bidhendi, M. (2009). Evaluation of spatial and seasonal variations in surface water quality using multivariate statistical techniques. International Journal of Environmental Science and Technology, 6(3): 467-476. https://doi.org/10.1007/BF03326086
[23] Ali, M.M., Ali, M.L., Islam, M.S., Rahman, M.Z. (2016). Preliminary assessment of heavy metals in water and sediment of Karnaphuli River, Bangladesh. Environmental Nanotechnology, Monitoring & Management, 5: 27-35. https://doi.org/10.1016/j.enmm.2016.01.002
[24] Kar, D., Sur, P., Mandal, S.K., Saha, T., Kole, R.K. (2008). Assessment of heavy metal pollution in surface water. International Journal of Environmental Science and Technology, 5(1): 119-124. https://doi.org/10.1007/BF03326004
[25] Al-Saadi, R.J.M., Mutasher, A.K.A., Al-Awadi, A.T. (2021). New regression model for estimating irrigation water quality index. International Journal of Design & Nature and Ecodynamics, 16(2): 127-134. https://doi.org/10.18280/ijdne.160202
[26] USEPA. (2012). SW-846 On-line (WWW Document). Waste-Hazard. Waste-Test Methods. https://www.epa.gov/hw-sw846/federal-register-notices-related-sw-846.
[27] Prasanna, M.V., Praveena, S.M., Chidambaram, S., Nagarajan, R., Elayaraja, A. (2012). Evaluation of water quality pollution indices for heavy metal contamination monitoring: A case study from Curtin Lake, Miri City, East Malaysia. Environmental Earth Sciences, 67(7): 1987-2001. https://doi.org/10.1007/s12665-012-1639-6
[28] Majhi, A., Biswal, S.K. (2016). Application of HPI (heavy metal pollution index) and correlation coefficient for the assessment of ground water quality near ash ponds of thermal power plants. International Journal of Science Engineering and Advance Technology, 4(8): 395-405.
[29] Ghaderpoori, M., Kamarehie, B., Jafari, A., Ghaderpoury, A., Karami, M. (2018). Heavy metals analysis and quality assessment in drinking water - Khorramabad city, Iran. Data in Brief, 16: 685-692. https://doi.org/10.1016/j.dib.2017.11.078
[30] Zhou, F., Guo, H., Liu, L. (2007). Quantitative identification and source apportionment of anthropogenic heavy metals in marine sediments of Hong Kong. Environmental Geology, 53: 295-305. http://dx.doi.org/10.1007/s00254-007-0644-7
[31] Chen, T., Wang, J., Zhou, H., Wong, M. (1996) Assessment of trace metal distribution and contamination in surface soils of Hong Kong. Environmental Pollution, 96: 61-68. http://dx.doi.org/10.1016/S0269-7491(97)00003-1
[32] Heinrich, A. (2007). The application of multivariate statistical methods for evaluation of soil profiles. Journal of Soil and Sediments, 7: 45-52. http://dx.doi.org/10.1065/jss2006.11.193
[33] Abdi, H. (2003). Multivariate Analysis. In: Lewis-Beck, M., Bryman, A. and Futing, T., Eds., Encyclopedia of Social Sciences Research Methods, Sage, Thousand Oaks.
[34] Acosta, J., Faz, A., Martinez-Martinez, S., Zomoza, R., Carmona, D., Kabas, S. (2011). Multivariate statistical and GIS-based approach to evaluate heavy metals behavior in mine sites for future reclamation. Journal of Geochemical Exploration, 109: 8-17. http://dx.doi.org/10.1016/j.gexplo.2011.01.004
[35] Bini, C., Sartori, G., Wahsha, M., Fontana, S. (2011). Background levels of trace elements and soil geochemistry at regional level in NE Italy. Journal of Geochemical Exploration, 109: 125-133. http://dx.doi.org/10.1016/j.gexplo.2010.07.008
[36] Zhou, J., Ma, D., Pan, J., Nie, W., Wu, K. (2008) Application of multivariate statistical approach to identify heavy metals sources in sediments and waters: A Case Study in Yangzhong, China. Environmental Geology, 54: 373-380. http://dx.doi.org/10.1007/s00254-007-0824-5
[37] Boruvka, L., Vacek, O., Jehlicka, J. (2005). Principal component analysis as a tool to indicate the origin of potentially toxic elements in soils. Geoderma, 128: 289-300. http://dx.doi.org/10.1016/j.geoderma.2005.04.010
[38] McGarial, K., Cushman, S., Stafford, S. (2000). Multivariate statistics for wildlife and ecology research. Springer, New York. http://dx.doi.org/10.1007/978-1-4612-1288-1
[39] Mckenna, G. (2003). An enhanced cluster analysis program with bootstrap significant testing for ecological community analysis. Environmental Modeling and Software, 18: 205-220. http://dx.doi.org/10.1016/S1364-8152(02)00094-4
[40] Salah, E., Turki, A., Al-Othman, E. (2012). Assessment of water quality of Euphrates River using cluster analysis. Journal of Environmental Protection, 3: 1269-1273. http://dx.doi.org/10.4236/jep.2012.312180
[41] Habeeb, M.A., Al-Bermani, A.K.K., Salman, J.M. (2016). Environmental study of water quality and some heavy metals in water, sediment, and aquatic macrophytas in lotic ecosystem, Iraq. Mesopotamia Environmental Journal (MEJ), 1(2): 66-84.
[42] Saeed, S.M., Shaker, I.M. (2008). Assessment of heavy metals pollution in water and sediments and their effect on Oreochromis Niloticus in the Northern Delta Lakes, Egypt. 1999: 475-490.
[43] Ramal, M.M. (2012). Evaluation the wastewater effluents and It's Effects upon AL-WARAR Canal. Anbar Journal for Engineering Sciences, 2: 239-258. https://www.iasj.net/iasj/article/69265.