Ameer Mohammed Khalaf* | Zuhair Jaber Mushref | Ismael Mohammed Khaleefah | Salah Othman Abed
© 2021 IIETA. This article is published by IIETA and is licensed under the CC BY 4.0 license (http://creativecommons.org/licenses/by/4.0/).
OPEN ACCESS
Through the analysis of the digital elevation model (DEM) of the search area, it was found that the search area is located within a mountainous region with a complex twisting, as the surface has been classified into five regions of elevations, among which the first region represents the lowest elevation lands, and extends an area of 118.7 km2 It equates to (22.6%) of the total area, while the largest region is the second region, occupying an area of (187.9) km2, 36% of the total area of the region, while the regression categories were divided into five levels depending on the classification of (Zink) It turns out that the Fifth Region is the most complex of the regions, and it includes the summit of Mount Hendrin, the summit of Mount Karukh. As for the characteristics of the direction of the slopes, nine slope directions of varying areas were found. As for the density of vegetation coverage according to (NDVI), we find that the NDVI index in the research area is divided into three levels of plant density, as the second level, i.e. average density, recorded the largest area at about (344.8) km2, equivalent to (66.1%) of the area the college. Which is characterized by the topological complexity of the surface, which makes it the most suitable areas for pastoral activity, while the higher density in relation to vegetation coverage was more widespread in the first and second steep categories by about (2.5, 9.8) km2, i.e. (21.6%, 24.3%) of the total area.
topography, vegetation, slope, slope direction
Topography has an important role in its impact on the overall life above the surface of the earth, Modeling has an important role to play in understanding the nature of the terrain and its characteristics from height, slope and direction of the slopes of the slopes helps to know the variation of vegetation density and then determine the type of relationship Between topographic characteristics and vegetation [1-3]. The difference in the nature of the surface topography in terms of elevation and subsidence naturally leads to the diversity and variation of the biological life of the vegetation and is a major factor in relational modeling between the distribution of the degree of plant density and its quality from one place to another according to the height factor above sea level [4-6]. As for the degree of slope, it has a direct effect on the type and density of vegetation cover, as the greater the degree of slope, the greater the strength of soil erosion and erosion and the instability and stability of soil particles, which is reflected in the scarcity of the vegetation cover, and the slower the degree of slope, the lower the rate of soil erosion and erosion and the greater the density of the cover Vegan [7, 8]. Whereas, the direction of the slopes of the slopes determines the type and distribution of vegetation density through the influence of the angle of incidence of sunlight and its shade on the slopes with different directions [9, 10].
The study problem was as following:
The Research included several hypotheses, as following:
Through relational modelling, the extent to which the terrain affects the type and distribution of vegetation density in the region is shown.
The research is based on the use of analytical and quantitative method [11, 12], in studying the research area by using modern techniques to analyze the terrain nature of the area based on digital data from space sensors.
2.1 Data and software used in the research
2.2 Limits of the study area
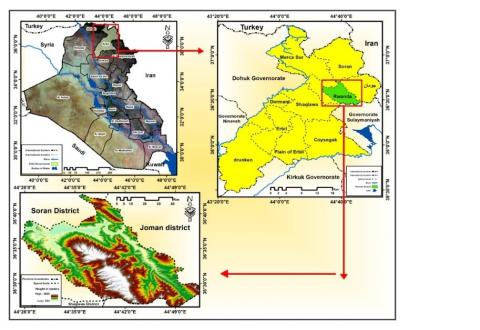
Rawanduz district is located in Erbil governorate within the northeastern part of Iraq between latitude (36 ° 26'34 "N) and (36 ° 42'43" N) and longitude (44 ° 27'28 "E) and (44 ° 53 ') 2 "E) with an area of (522.3) km2, Figure 1.
Reference: Based on: The Republic of Iraq, Ministry of Water Resources, Public Survey Directorate, Map of Iraq and Erbil Administrative Governorate, for the year 2019, scale (1/1000000).
Figure 1. The location of Rawanduz district of Erbil and Iraq
Reference: Depending on the digital elevation model (DEM), with distinct accuracy (30 × 30) meters, and the outputs of Arc Map 10.4.1.
Figure 2. Altitude ranges of Rawanduz district
Firstly: Topographic characteristics of Rawanduz District
1. Altitude characteristics of sea level.
Through the analysis of the digital elevation model (DEM) of the search area, as shown in Figure 2 and Table 1, we find that the search area is located within a simple and complex mountainous area, and therefore the surface [13], has been classified into five regions of heights distributed as follows.
Table 1. Elevation areas with the percentage of Rawanduz district
|
Categories of height in meters |
The area is km2 |
percentage |
|
533 - 956.4 |
118.7 |
22.6% |
|
956.5 - 1,380 |
187.9 |
36.0% |
|
1,381 - 1,803 |
133.5 |
25.6% |
|
1,804 - 2,227 |
50.4 |
9.7% |
|
A, 228 - 2,650 |
31.8 |
6.1% |
|
Total |
522.3 |
100% |
|
Source: Based on Figure 2, and Arc Map 10.4.1. |
||
It represents the less elevated lands, as it extends within the northern and northeastern parts of the search area with an area of 118.7 km2, equivalent to 22.6% of the total area.
This region occupies more area than the rest of the regions with an area amounting to (187.9) km2, i.e. 36% of the total area of the region, and extends almost to most parts of the study area.
This region constitutes an area of (133.5) km2, that is, (25.6%) of the total area of the region. It is mainly concentrated in the center and south of the research area, and it is characterized by being more milled than the previous two regions, as there are a number of mountain peaks such as the summit of Jabal Sahri Bay and the summit of Jebel Jayara. Shakan and the summit of Mount Darka, the summit of Mount Gobi Dundee and the summit of Mount Sri Yanawan.
This region constituted a ratio of (9.7%) and an area of (50.4) km2 of the total area, and it is located in the center and southwest of the research area, and it also includes a number of mountain peaks such as the summit of Mount Petrichen and the summit of Mount Sri Daruki.
This region is located in the middle and south of the research area, and this region occupies the least area as it amounted to about (31.8) km2, and by (6.1%). It is the most complex region, and the summit of Mount Hendrin includes the summit of Mount Karukh.
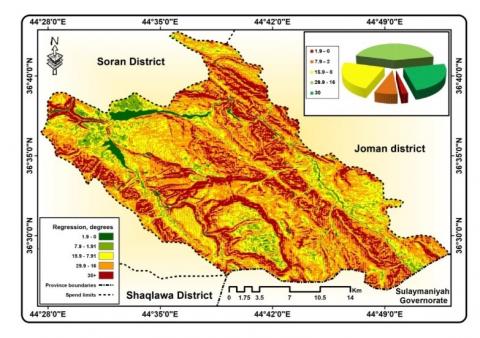
Through Figure 3 and Table 2, the regression categories were divided into five levels, depending on the classification of (Zink), as follows:
A- The first level - flat - flat between (0 - 1.9) degrees
This level represents the smallest area, reaching (11.6) km2, and by (2.2%), and is concentrated mainly in the northern parts and appears in the form of mountainous plains and valleys, and this range is considered one of the most suitable places for human activity.
B- The second level - slight ripple between (2 - 7.9) degrees
This level extends over an area of (7.7%), equivalent to (40.4) km2, as it overlaps with the rest of the levels and is concentrated at the river plains and the foothills and feet of the mountains.
C- The third level - wavy between (8 - 15.9) degrees
This level occupies an area of about (120.8) km2, with a rate of (23.1%), and appears in the form of low hills in different parts of the search area.
D- The fourth level - segmented - disaggregated between (16-29.9) degrees
This level occupies the largest area by about (223.1) km2, and (42.7%) of the total area, as its lands are steep, extending in most parts of the region, as it is noted that there are high hills with steep slope.
E- Fifth level - cut in a high degree between (30 and more) degrees
The lands of this level are characterized as high, rugged, steep mountainous lands that extend throughout the search area, and constitute an area of (126.4) km2, and a percentage (24.3%) of the total area.
Table 2. Regression characteristics of Rawanduz district according to Zinc classification
|
Sprocket shape |
Height classes |
The area is km2 |
|
Flat - flat |
0 – 1.9 |
11.6 |
|
Slight ripple |
2 – 7.9 |
40.4 |
|
crispy |
8 – 15.9 |
120.8 |
|
Chopped - segmented |
16 - 29.9 |
223.1 |
|
Cut to a high degree |
+ 30 |
126.4 |
|
Total |
- |
522.3 |
|
Reference: Ameer Abed Al-Dulaimi, (Geomorphological Analysis of Ground Slopes in Shaqlawa and Its Effect on the Population Activity by the Use of Remote Sensing R.S and Geographic Information System G.I.S), Ph.D. thesis (unpublished), College of Education for Human Sciences, Anbar University, 2018. |
||
Reference: Depending on the digital elevation model (DEM), with an exceptional resolution of (30 × 30) meters, and the outputs of Arc Map 10.3.
Figure 3. The regression characteristics of Rawanduz district according to zinc classification
Reference: Based on the digital elevation model (DEM), with a distinct accuracy of (30 x 30) meters And Arc Map 10.3 program outputs.
Figure 4. Characteristics of the direction of the slope of the district of Rawanduz
It is noticed from Figure 4 and Table 3 that there are nine declining directions. The first value with the surface level was the lowest, as it reached an area of about (8.8) km2, i.e. a rate of (1.7%) While the lands with a northern, northwestern, northern and eastern direction recorded an area of (58.8, 55, 60.3) km2, equivalent to (11.3%, 10.5%, 11.5%) respectively As for the lands with a south, southwest and southeast direction, they recorded an area of (54.4, 73.1, 46.4) km2, and (10.4%, 14% and 8.9%) respectively. Whereas, lands with a western orientation recorded the highest percentages by about (20.2%) and an area of (105.3) km2, while lands with an eastern direction reached (60.2) km2, and by (11.5%) We conclude from this that most of the lands of the research area are located in directions facing the fall of rain, especially the slopes with a southern, eastern and southeastern direction, which receive more water than rain, which helps the growth of natural vegetation at a greater density than other directions.
Table 3. Characteristics of the steepness of the Rawandoz district
|
Slope direction |
The area is 2 km |
percentage |
|
Flat (-1) |
8.8 |
1.7% |
|
North (0-22.5) |
58.8 |
11.3% |
|
Northeast (22.5-67.5) |
60.3 |
11.5% |
|
East (67.5-112.5) |
60.2 |
11.5% |
|
Southeast (112.5-157.5) |
46.4 |
8.9% |
|
South (157.5-202.5) |
54.4 |
10.4% |
|
Southwest (202.5-247.5) |
73.1 |
14.0% |
|
West (247.5-292.5) |
105.3 |
20.2% |
|
Northwest (292.5-337.5) |
55.0 |
10.5% |
|
Total |
522.3 |
100% |
|
Source: Based on Map (4), and Arc Map 10.4.1 |
||
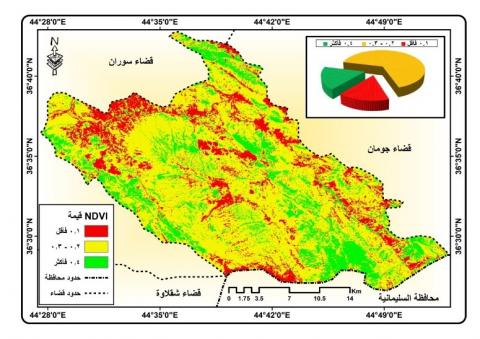
This indicator is used to measure the density of vegetation cover [14], and the degree of greenness, as its value ranges between (-1, +1).
As positive values indicate the presence of vegetation cover, while negative values indicate little or no vegetation cover (1). The vegetative difference index can be calculated based on the following expression [15]:
NDVI = NIR - RED / NIR + RED
NIR = Band 5 of the 8 Landsat satellite.
RED = Band 4 on the 8 Landsat satellite.
Through Figure 5 and Table 4, we find that the NDVI index in the research area is divided into three levels of plant density as follows.
Table 4. The values of the vegetation cover density NDVI for Rawandoz
|
Density type |
NDVI value |
The area is 2 km |
percentage |
|
tenuous |
0.1 or less |
84.3 |
16.1% |
|
Medium density |
0.2 - 0.3 |
344.8 |
66.1% |
|
Dense |
0.4 or more |
93.2 |
17.8% |
|
Total |
- |
522.3 |
100% |
|
Reference: Based on figure (5), and Arc Map 10.4.1 |
|||
Reference: LAND SATLC 8 satellite data, and Arc Map 10.4.1 software
Figure 5. NDVI vegetation density for Rawanduz district
A- The first level - low density 0.1 or less
It occupies the least area among the other levels, as it reached (84.3) km2. And by (16.1%) of the total area. The sparsely populated areas are concentrated in the steep slopes and cliff foothills as well as the mountainous peaks regions that are characterized by their hard rocks and shallow thickness of their soils due to erosion processes.
B- Second level - average density 0.2 - 0.3
The area occupied by this level reached the largest area at about (344.8) km2, equivalent to (66.1%) of the total area. It was characterized by the topological complexity of the surface, which makes it the most suitable area for pastoral activity.
C- The third level - dense 0.4 or more
It is the densest level in vegetation cover, with a rate of (17.8%), and an area of (93.2) km2. As it is noticed through the Figure 5 that the dense vegetation levels were concentrated in the mountainous plains and valleys of the search area, and the reason for this is due to the abundance of water accumulated from the fall of rain and melting snow in those places, as well as the fertility of those soils, due to their regeneration as a result of erosion. The rainy waters of the slope areas, leading to the accumulation of fertile sediments in the mountain plains and valleys.
Secondly - Matching the vegetation index with the topographic factors
By relying on the (Union) tool in the (Toolbox) through the (Arc Map 10.4.1) program, a matching process was carried out between the vegetation coverage index and the area deformation factor, which includes (height, slope, slope direction) in the search area, the following results were found.
5.1 Matching the vegetation coverage index with the height factor
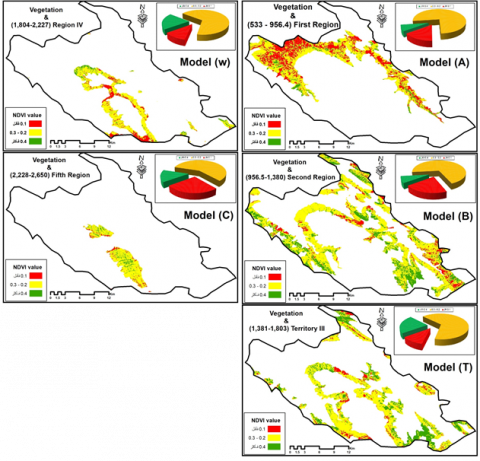
Through the analysis of the cartographic models Figure 6 (6a, b, c, w, and t) and Table 5 it is noticed that the area of vegetation cover varies according to the height factor above sea level, as the least dense category of vegetation is spread over the largest area within the lowest category By about (31.5) km2, and by (26.5%) of the total area of the first category, the area gradually decreases with the increase in the height of the area until it reaches the lowest area in the fifth category.
Table 5. Matching the vegetation coverage index with the height factor for Rawanduz
|
Dense |
Medium density |
Low density |
Categories of height in meters |
|||
|
% |
km2 |
% |
km2 |
% |
is km2 |
|
|
14.9% |
17.6 |
58.6% |
69.6 |
26.5% |
31.5 |
533 - 956.4 |
|
20.6% |
38.8 |
67.6% |
127.1 |
11.8% |
22 |
956.5 - 1,380 |
|
22.5% |
30.1 |
66.2% |
88.3 |
11.3% |
15.1 |
1,381 - 1,803 |
|
8.3% |
4.2 |
70.2% |
35.4 |
21.5% |
10.8 |
1,804 - 2,227 |
|
7.9% |
2.5 |
76.7% |
24.4 |
15.4% |
4.9 |
2,228 - 2,650 |
|
84.3 |
344.8 |
93.2 |
Total |
|||
Reference: Based on cartographic figures (6a, b, c, w, and t), and Arc Map 10.4.1
Reference: Based on figures (2, 5), and Arc Map 10.4.1
Figure 6. Cartographic models (6a, b, c, w, t) matching the vegetation coverage index with the height factor of Rawanduz district
As for the medium-density group of plants, the largest area of spread within the second category of height reached (127.1) km2, a percentage (67.6%) of the area of the second category and the lowest within the highest category as for the densest category of vegetation coverage, it is more widespread in the second category of elevation, with an area of (38.8) km2, equivalent to (20.6%) of the area of the second category, and the least prevalent within the highest category. We conclude from this that there is an inverse relationship between the spread of vegetation cover and the height factor, as the first, second and third categories are more prevalent than the fourth and fifth categories, that is, the higher the height, the less vegetation density and vice versa [16], and the reason for this is due to the shallow thickness of the soils in the regions of the mountain peaks. For strong erosion, snow accumulated most days of the year on high places, which prevented the plants from growing thickly.
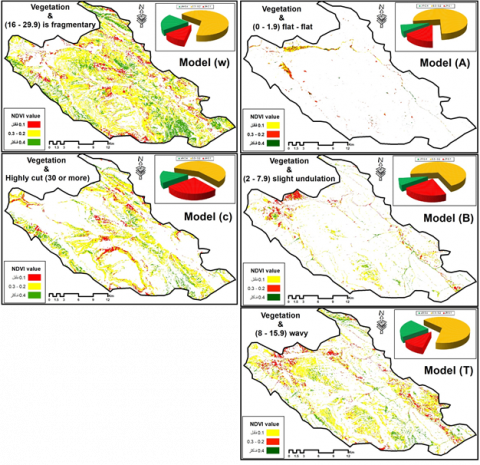
5.2 Matching the vegetation coverage index with the regression factor
When performing the matching process between the vegetation coverage index and the degrees of regression, it was found through the cartographic models Figure 7 (7a, b, c, w, and t) and Table 6 that the area of vegetation cover varies with the different degrees of slope. The largest among the least steeper category, with an area of (4.8) km2. That is, a rate of (41.3%) compared to the area occupied by the first category as for the second category of medium density vegetation coverage, it spread more in the fifth category with (72.8%), that is, an area of (92) km2, of the area of this category. As for the higher density in relation to vegetation coverage, it spread more in the first and second gradients by about (2.5 and 9.8) km2, i.e. a rate of (21.6% and 24.3%) of the total area of each class, respectively.
Based on the above, we conclude that low-slope areas have thicker soil than areas with steep slope, depending on the factors of erosion and erosion that occur to the soil, meaning that the relationship is inverse between the density of vegetation and the degree of land slope despite the high percentage of vegetation cover, especially the middle class. The vegetation cover falls within the regression category (16-29.9) and (+30) due to its large area compared to the rest of the other regression categories.
Reference: Based on figures (3, 5), and Arc Map 10.4.1
Figure 7. Cartographic models (7a, b, c, w, t) matching the vegetation coverage index with the regression factor of the Rawanduz district
Table 6. Matching the vegetation coverage index with the regression factor for Rawandoz
|
Sprocket shape |
Height in meter |
Low density |
Medium density |
Dense |
|||
|
km2 |
% |
km2 |
% |
km2 |
% |
||
|
Flat - flat |
0 – 1.9 |
4.8 |
41.3 |
4.3 |
37.1 |
2.5 |
21.6 |
|
Slight ripple |
2 – 7.9 |
11 |
27.2 |
19.6 |
48.5 |
9.8 |
24.3 |
|
crispy |
8 – 15.9 |
21.7 |
18.0 |
79.8 |
66 |
19.3 |
16.0 |
|
Chopped - segmented |
16 - 29.9 |
28.9 |
13.0 |
149.1 |
66.8 |
45.1 |
20.2 |
|
Cut to a high degree |
+ 30 |
17.9 |
14.1 |
92 |
72.8 |
16.5 |
13.1 |
|
Total |
83.2 |
344.8 |
93.3 |
||||
Reference: Based on cartographic models (7a, b, c, w, and t), and Arc Map 10.4.1.
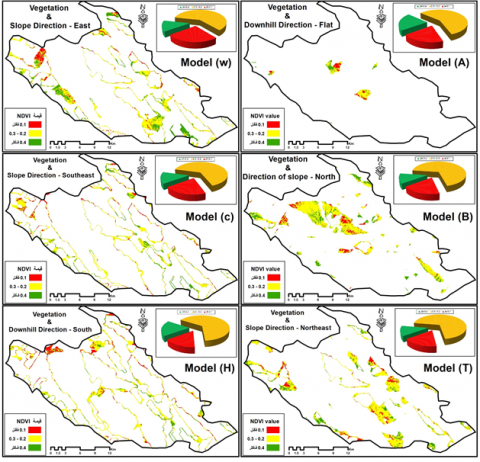
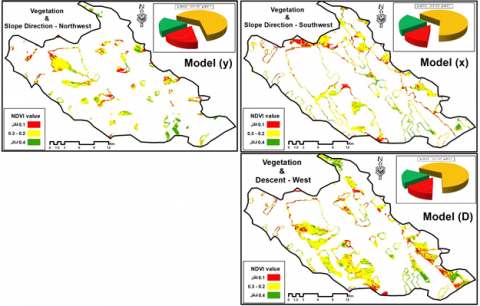
5.3 Matching the vegetation coverage index with the trend factor of the regression
When performing the matching process between the vegetation coverage index and the gradient direction factor of the terrain and according to the area occupied by each species, as shown in the cartographic models Figure 8, 9 (8a, b, c, w, h, t, x, d, y) and Table 7 it is noticed that the category The least dense vegetation cover extends more in the south, southwest and west directions by about (10.4, 14.9, 18.2) km2, and by (19.1%, 20.4% and 17.3%), respectively. As for the medium-density category in its vegetation cover, we find it widely found within all types of slope directions, ranging from its lowest value in flat slope areas by (58%) and its highest value in the areas of the northeastern slope with (70%) of the total area of the class. While the densest category in its vegetation cover is in the eastern and southeastern slopes by about (15.7, 9.7) km2, and by (26.1%, 20.9%) of the total area of each category. Through this, we find the spread of vegetation cover more in the slopes of the eastern and southeastern direction, especially the denser vegetation coverage due to the direct relationship between the amount of rain falling and the increase in the natural plant density on these slopes.
Reference: Based on figures (4, 5), Arc Map 10.4.1.
Figure 8. Cartographic models (8a, b, c, w, t, h) matching the vegetation coverage index with the regression factor of the district of Rawanduz
Table 7. Matching the vegetation coverage index with the regression factor of Rawanduz district
|
Dense |
Medium density |
Low density |
Slope direction |
|||
|
% |
Th km2 |
% |
km2 |
% |
km2 |
|
|
20.5 |
1.8 |
58.0 |
5.1 |
21.5 |
1.9 |
Flat |
|
18.9 |
11.1 |
69.0 |
40.6 |
12.1 |
7.1 |
North |
|
17.4 |
10.5 |
70.0 |
42.2 |
12.6 |
7.6 |
northeast |
|
26.1 |
15.7 |
60.5 |
36.4 |
13.5 |
8.1 |
the East |
|
20.9 |
9.7 |
64.9 |
30.1 |
14.2 |
6.6 |
southeast |
|
16.0 |
8.7 |
64.9 |
35.3 |
19.1 |
10.4 |
the South |
|
13.7 |
10 |
65.9 |
48.2 |
20.4 |
14.9 |
Southwest |
|
14.9 |
15.7 |
67.8 |
71.4 |
17.3 |
18.2 |
the West |
|
18.2 |
10 |
64.5 |
35.5 |
17.3 |
9.5 |
North West |
|
93.2 |
344.8 |
84.3 |
Total |
|||
Reference: Based on cartographic models (86a, b, c, w, c), and Arc Map 10.4.1.
Reference: Based on figures (4, 5), Arc Map 10.4.1.
Figure 9. Cartographic models (x, d, y) matching the vegetation coverage index with the regression factor of the Rawandoz district
1. The research presented an example of the importance of using remote sensing techniques and geographic information systems in detecting the density of vegetation coverage (NDVI(, It turns out that the topographic characteristics of Rawanduz district affect the type and distribution of vegetation density, as the least dense category of vegetation is spread over the largest area within the lowest category By about (31.5) km2, and by (26.5%) of the total area of the first category, the area gradually decreases with the increase in the height of the area until it reaches the lowest area in the fifth category.
2. Classification of the surface into five regions for heights, among which the first region represents the lands of the lowest elevation, and extends over an area of (118.7) km2, equivalent to (22.6%) of the total area.
3. The largest region in area is the second region, and it occupies an area of (187.9) km2, that is, 36% of the total area of the region.
4. The density of vegetation coverage according to (NDVI). I found that the NDVI index in the research area is divided into three levels of plant density. The second level, ie the average density, recorded the largest area at about (344.8) km2, equivalent to (66.1%) of The total area. Which is characterized by the topological complexity of the surface.
1. You must rely on appropriate representation methods and methods consistent with the characteristics of the map that are accurate, clear and easy to classify according to NDVI.
2. The necessity of adequate attention to investing in the direction of the slopes, as it can be invested in the fields of generating solar energy and exploiting it in the agricultural side that suits it.
3. When the direction of the slopes is known, it gives a great possibility to avoid the dangers of the movement of earth materials and mudslides on human settlements and main roads, especially those whose direction is towards city centers and village clusters located in front of the direction of these slopes.
4. Paying attention to the distribution of human uses in a way that suits each class, and the possibility of investing them in human activity that suits them, whether it is human settlements or agricultural or pastoral uses.
[1] Smith, T., Bookhagen, B. (2021). Climatic and biotic controls on topographic asymmetry at the global scale. J. Geophys. Res. Earth Surf., 126(1): e2020JF005692. https://doi.org/10.1029/2020JF005692
[2] Satam, A.T.M., Nahar, Z.J.M., Khalaf, A.M. (2020). Building digital hydrological models for the habbaniyah lake reservoir to calculate area variable. Multicult. Educ., 6(4): 1-8. https://doi.org/10.5281/zenodo.4147322
[3] Fayyad, P.M.M., Kh, A.M. (2018). The effect of the earthen declivities on the human activity in Shaqlawa by the use of RS and GIS. J. Univ. Anbar Humanit., 3(4): 81-105.
[4] Najm, A.B.A., Al-bayati, I.M.A., Sulaiman, S.O. (2021). Improving the cultivated area for the ramadi irrigation project by using water evaluation and planning model (WEAP). Al-Rafidain Engineering Journal (AREJ), 26(1): 105-114. http://dx.doi.org/10.33899/rengj.2020.128248.1063
[5] Fisher, J.P., Estop-Aragonés, C., Thierry, A., Charman, D.J., Wolfe, S.A., Hartley, I.P., Murton, J.B., Williams, M., Phoenix, G.K. (2016). The influence of vegetation and soil characteristics on active‐layer thickness of permafrost soils in boreal forest. Glob. Chang. Biol., 22(9): 3127-3140. https://doi.org/10.1111/gcb.13248
[6] Hammad, M., Khalaf, A.M. (2021). An assessment of the climatic characteristics and their impact on the traffic accidents in the City of Ramadi. Psychol. Educ. J., 58(1): 5088-5095. https://doi.org/10.17762/pae.v58i1.2020
[7] Stylianidis, E., Karanikolas, N., Kaimaris, D. (2012). A gis for urban sustainability indicators in spatial planning. Int. J. Sustain. Dev. Plan., 7(1): 1-13. https://doi.org/10.2495/SDP-V7-N1-1-13
[8] Abdulhameed, I.M., Sulaiman, S.O., Najm, A.B.A. (2021). Reuse wastewater by using water evaluation and planning (WEAP) (Ramadi City–Case Study). In IOP Conference Series: Earth and Environmental Science, 779(1): 012104. IOP Publishing.
[9] Griffith, D.A., Peres-Neto, P.R. (2006). Spatial modeling in ecology: The flexibility of eigenfunction spatial analyses. Ecology, 87(10): 2603-2613. https://doi.org/10.1890/0012-9658(2006)87[2603:SMIETF]2.0.CO;2
[10] Ranaweera, D.K., Hubele, N.F., Papalexopoulos, A.D. (1995). Application of radial basis function neural network model for short-term load forecasting. IEE Proceedings-Generation, Transmission and Distribution, 142(1): 45-50. http://dx.doi.org/10.1049/ip-gtd:19951602
[11] Apuke, O.D. (2007). Quantitative research methods: A synopsis approach. Kuwait Chapter Arab. J. Bus. Manag. Rev., 33(5471): 1-8. http://dx.doi.org/10.12816/0040336
[12] Kairuz, T., Crump, K., O’Brien, A. (2007). Tools for data collection and analysis. Pharmaceutical Journal 278(7445).
[13] Qader, R.M., Syan, S.H.A. (2021). Rock slope stability assessment along rawanduz main road, kurdistan region. Iraqi Geol. J., 54(1): 79-93. https://doi.org/10.46717/igj.54.1B.7Ms-2021-02-25
[14] González‐Alonso, F., Merino‐De‐Miguel, S., Roldán‐Zamarrón, A., García‐Gigorro, S., Cuevas, J.M. (2006). Forest biomass estimation through NDVI composites. The role of remotely sensed data to assess Spanish forests as carbon sinks. Int. J. Remote Sens., 27(24): 5409-5415. https://doi.org/10.1080/01431160600830748
[15] Yang, Z., Willis, P., Mueller, R. (2008). Impact of band-ratio enhanced AWIFS image to crop classification accuracy. in Proc. Pecora, 2008,17(1): 1-11.
[16] Hu, F.S., et al., (2010). Tundra burning in Alaska: linkages to climatic change and sea ice retreat. J. Geophys. Res. Biogeosciences, 115(G4). https://doi.org/10.1029/2009JG001270