Yefsi Malrianti | Anwar Kasim* | Alfi Asben | Edi Syafri | Gustri Yeni | Ahmad Fudholi
© 2021 IIETA. This article is published by IIETA and is licensed under the CC BY 4.0 license (http://creativecommons.org/licenses/by/4.0/).
OPEN ACCESS
This research reports nanoparticles or nanocatechin produced from catechin extracted from gambier and the differences between the properties of the extracted catechin and nanocatechin. The study began with the preparation of >95% pure catechin through successive extraction. The catechin obtained was converted to nanocatechin with a high-speed homogenizer on a 1% suspension of catechin in water at 12,000 rpm for 30, 45, 60, 75 or 90 minutes. Results showed average diameters of the nanocatechin 90-minute homogenized colloids were then dried with a spray dryer so physical and chemical properties could be compared with those of the raw extracted catechin. Catechin content, water content, pH, refractive index, density, molecular weight and rotational angle were unaltered. Appearance, solubility, thermal properties, highest absorbance wavelength and antioxidant activity were measured. Initial degradation temperature and antioxidant activity of nanocatechin were higher than those in the originally extracted catechin.
nanomaterials, nanocatechin, antioxidant activity
Catechin is a secondary metabolite which is naturally produced by plants, such as gambier and tea, and belongs to the flavonoid group [1]. Catechin has better antioxidant properties than ά- tocopherol, butylated hydroxy anisole or butylated hydroxytoluene. Catechins have many benefits. Catechin has medical functions, such as anticancer [2], anti-inflammatory [3], antimutagenic [2] and antidiabetic [4] functions, reduces the risk of tumours, lowers cholesterol levels, prevents hypertension and kills bacteria and fungi [5]. Moreover, catechin strengthens the defense mechanisms of organism and has antibacterial and antioxidative properties [6]. As an antioxidant, catechin prevents the effects of free radicals [7].
Raw gambier is a traditionally processed product of dried gambier produced by growers and has a high catechin composition ranging from 40% to 60%. This extract is produced using a solvent. A product containing up to 80% catechin (pure gambier) can be produced through further extraction [8]. The extraction process has been refined by many researchers. Ethyl acetate was found to be the best solvent for the process [9]. High yields of catechin with a high antioxidant activity were obtained using an ethyl acetate solvent [10]. These studies indicated that ethyl acetate is the best solvent for extracting catechin from gambier. Catechin extraction produces catechin crystals with a particle size larger than 100 nm (nanoparticle size). Nano-sized particles have some chemical and physical properties that are superior to those of micro-sized particles. The rate of absorption of active compounds can be increased by using nanoscale particles, which affect the physical and chemical properties of base materials [11]. Understanding fundamental materials at the nanoscale level can be helpful in utilizing nanomaterials in various applications, such as clean energy, medical equipment and sensors [12]. The area of a particle for contact with other particles increases with decreasing particle size, and thus the dissolution and stability of a compound are affected by particle size [13]. Reduction in particle size can increase the absorption rate and effect of the dissolving process [14]. These properties can be changed by controlling material size, adjusting chemical compositions, modifying surfaces and controlling particle interactions. Various methods for producing nanoparticles have been widely used in various fields. These methods include emulsification [15] polymerization of monomer synthesis and dispersion of synthetic polymers and top-down and bottom processes [16]. Reduction in particle size to a nanoscale level can increase the absorption rate for active compounds but changes material properties [11]. The contact area of a particle increases with decreasing particle size, and thus the solubility and stability of a compound is affected by particle size [17]. Reducing particle size can increase the absorption rate [18]. Recent catechin nanoparticle research includes the development of a β-cyclodextrin nano-encapsulated catechin inclusion complex [19] and investigation on the adsorption of catechin on magnetic hydroxyapatite nanoparticles with synergistic interactions with calcium ions [20]. Recent research has focused on the use of catechin in nanoemulsions; no published research has reported the production of nanoparticles from catechin crystals without the addition of other chemicals. To address this gap, the present research focuses on the production of nanocatechin particles through high-speed homogenization (HSH) at varied homogenization times. The effect of homogenization time on the sizes of resulting catechin particles was investigated, and the differences between the properties of the nanocatechin and source catechin, referred to as extracted catechin, were determined. The aim of research can be determining the effective time required to produce nano-sized catechin particles. By knowing the differences in physical and chemical properties between extracted catechins and nanocatechins, it can provide information on utilization opportunities, so that they can function effectively when applied to the food, cosmetic and pharmaceutical industries.
2.1 Material and equipment
The materials used in this study were gambier granules (raw-ground gambier); gambier paste (non-molded gambier) extracted from leaves and twigs of gambier plants from Batang Kapeh, south Pesisir in Sumatra; ethyl acetate; aquades (Merck); 1,1-diphenyl-2-picryllhydrazil (DPPH) Sigma; and filter paper. Analytical scales, measuring cups (Pyrex), measuring cylinders (Pyrex), conical flasks (Pyrex), ultrasonic bath (Elma), hot plate, furnace (Neycraft JFF2000), porcelain cups, aluminum cups, micropipettes (100–1000 µL), magnetic stirrer, petri dishes, water bath (Memmert), oven (Memmert), desiccator, extractor, a Soxhlet extractor, HD pH meter 2005, spectrophotometer (AUV-1800 Shimadzu), HG-15D homogeniser Daihan Scientific Co., Ltd. from Gangwon-do, Korea, thermogravimetric analysis equipment (TGADTG-60 Shimadzu), SWXG-4 manual polarimeter disc, VascoTM particle size analyser (PSA; Courdoun Technologies) and Abbe refractometer were used.
2.2 Raw material provision and catechin preparation process
Gambier granules with a moisture content of ±16% and gambier paste with a moisture content of ±40% were obtained from the gambier production centre of Batang Kapeh, West Sumatra. The granules were dried under sunlight at 30–50°C until the moisture content reached 14%. The gambier grains and gambier paste were washed repeatedly with water until the remaining filter water was clear. This step was followed by extraction with ethyl acetate. The ratio between gambier and ethyl acetate was 1: 5. The extracted solution was filtered, evaporated using a ± 50°C water bath and washed with water in a ratio of 1:5 until the aroma of ethyl acetate was gone. The solution was dried in an oven at 50°C until the moisture content was ±12%. The extracted catechin was ground until it was able to pass through a 100-mesh filter.
2.3 Nanocatechin preparation
An HSH of HG-15D Daihan Scientific Co., Ltd., Gangwon-do at 12.000 rpm was used on a 1% aqueous suspension of the extracted catechin to reduce the size of the extracted catechin to nanoparticle size. Five homogenization durations: 30, 45, 60, 75 and 90 minutes were used in determining the optimum time needed to reach nanoscale dimensions. Particle size was observed in the colloidal samples in water with a dynamic light scattering instrument. A non-invasive scattering technique was used at a detector angle of 173° and 4 mW (633 nm) with a HeNe laser. This step was performed according to ISO 13 321 and ISO 224. Afterwards, the optimal colloid obtained was dried with a spray dryer with an inlet temperature of 160°C and outlet temperature of 70°C under 6 psi of pressure.
2.4 Characterizations of extracted catechin and nanocatechin solutions
The extracted catechin and nanocatechin were characterized to determine the effect of particle size on pH; molecular weight; density; melting point; UV spectrum; rotational angle; refractive index; solubility in water and ethyl acetate; heat stability through TGA; and antioxidant activity. The samples used in the observation of thermal characteristics weighed 2.5 mg. TGA 701 (Serial no. C30565000570) was used in the characterization from 20°C to 800°C under atmospheric nitrogen (flow rate: 50 mL/min). The heating rate was 20°C/minute. The antioxidant activity of the sample was tested with the IC50 method. Approximately 1 g of sample was dissolved in 10 mL of methanol in a 15 mL test tube and homogenized. Then, 0.1, 0.3, 0.5, 0.7 and 0.9 mL of the samples were then pipetted into 10 mL of methanol, and 1 mL of the resulting solution was added to 2 mL of methanol and 1 mL of DPPH solution and left in the dark room for 15 minutes before observation with a spectrophotometer at a wavelength of 517 nm. The percentage of inhibition was calculated using Eq. (1).
$\%$ Inhibition $=\frac{A \text { Blank-A Sample }}{A \text { Blank }} \times 100 \%$ (1)
A curve showing anti-free-radical activity against concentration for the test solution was created. Linear regression showed a relationship between compound concentration in the test sample (x) and inhibition percentage (y). This relationship was modeled with a linear equation (Eq. (2)).
$\mathrm{Y}=\mathrm{ax}+\mathrm{b}$ (2)
where, a as intercept and b as slope and linear regression coefficient $(\mathrm{r}) \pm 1$, to obtain IC50.
3.1 Gambier characteristics and extracted catechin content
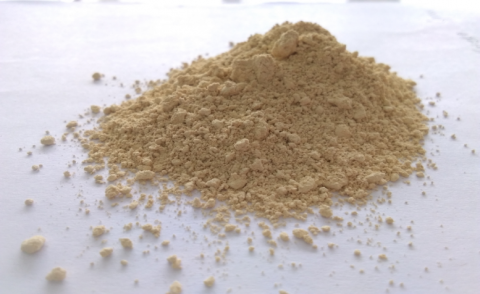
The characteristics of gambier from the production area of Batang Kapeh West Sumatra was tested according to SNI 01-3391-2000. This gambier, the raw material for catechin, comes in the form of granules and paste. Gambier paste produces light-coloured white-yellow catechins compared with gambier granules, as can be seen in Figure 1. Repeated ethyl acetate extraction is necessary in obtaining lighter colours and higher levels of catechins.
The extracted catechin content of granular gambier was $95.25 \% \pm 0.088 \%$ and that of gambier paste was $98.54 \% \pm 0.112 \%$. Gambier paste was selected for this research because of its higher catechin content. The successively extracted gambier residue from South Pesisir dissolved well in ethyl acetate solvent [21]. Ethyl acetate is the best solvent for catechins [9]. Using ethyl acetate solvent in extracting catechins from gambier increases yield and antioxidant activity to a higher degree than that when other solvents are used [10, 22].
(a) Catechin from gambier granules
(b) Catechin from paste
Figure 1. Catechin
3.2 Sizes of nanocatechin particles resulting from five homogenization durations
Homogenization durations under 30 minutes failed to reduce particle size to the desired nanoscale size. The average diameter of the catechin particles from each homogenization duration and polydispersity index is shown in Table 1. The average diameter of the particles decreases with homogenization time.
Table 1. Average diameter of catechin particles and homogenization time
|
Parameter |
Extracted catechin |
Nanocatechin |
|
30 |
1938.64 |
7.3500 |
|
45 |
1106.66 |
3.9130 |
|
60 |
288.46 |
0.2250 |
|
75 |
271.02 |
0.0080 |
|
90 |
230.75 |
0.1590 |
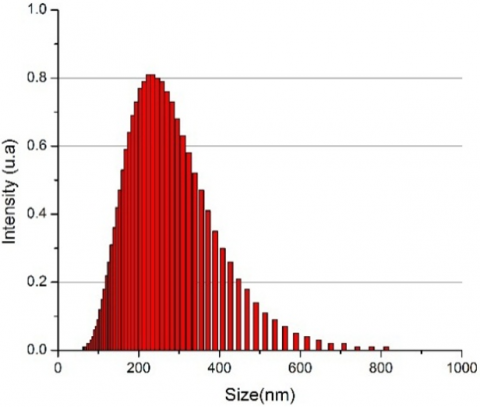
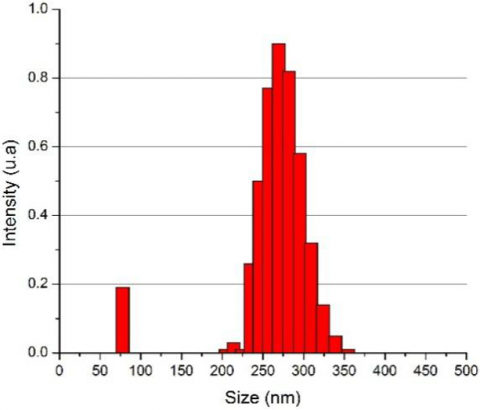
Figure 2a shows the nanocatechin colloids after varied homogenization times, and Figure 2b–2f show the catechin particle diameter distributions measured through PSA. Ultrafine particles are 1–100 nm in diameter, fine particles are 100–2500 nm and coarse particles are 2500–10,000 nm [23]. The definition of nanoparticles differs depending on material, field and application [24]. For the purpose of this research, anything with a size under 300 nm was regarded as nanoparticles. Treatment 1 to Treatment 5 resulted in fine particles with a diameter range of 230.75–1938.64 nm.
The particle size distribution is known as the Polydispersity Index (PdI) of the five homogenization time treatments, as shown in Table 1, and varies significantly from 0.0080 to 7.3500. Particle size uniquely affected the properties of nanoparticles, and the size distribution of nanoparticles fell within a narrow range [19]. PdI is used in describing the uniformity of particle size distribution or heterogeneity index. A PdI value of <0.05 indicates that a sample is monodispersed, whereas a PdI value of >0.7 indicates that a sample has an extremely wide particle size distribution. A PdI value of <0.4 indicates that the particle size distribution is narrow [23].
Homogenization for 75 minutes resulted in an average particle size of 271.02 nm and a PdI value of 0.0080, which was smaller than that for other durations, indicating a more uniform size distribution. However, 90 minutes of homogenization resulted in a PdI value of 0.1590 and a particle size with a range of 51.3–977.5 nm and average of 230.75 nm. The optimal homogenization time was considered to be 90 minutes because the majority of the fine particles produced after that time had nanoscale sizes.
(a) Nanocatechin colloid from 5 homogenization time treatments
(b) Particle distribution with homogenization time of 30 minutes, PdI = 7.3500
(c) Particle distribution with homogenization time of 45 minutes, PdI = 3.9130
(d) Particle distribution with homogenization time of 60 minutes, PdI = 0.2250
(e) Particle distribution with homogenization time of 75 minutes, PdI = 0.0080
(f) Particle distribution with homogenization time of 90 minutes, PdI = 0.1590
Figure 2. Nanocatechin and particle distribution from 5 homogenization time treatments
3.3 Characteristics of nanocatechin compared with extracted catechins
The results of the characterization can be seen in Table 2. The characteristics of the extracted catechin and nanocatechin are shown as well. This research only focuses on the physical and chemical properties (Table 2) of the catechin and nanocatechin extracts. The aim is only to find out whether there is an effect of changes in the particle size of catechins on the physical and chemical properties of these catechins, what are the physical and chemical properties that change after becoming nanocatechins. Catechins as antioxidants can be seen from the antioxidant activity in Table 2. The high content of antioxidants in catechins means that catechins are used in the food, cosmetic and pharmaceutical industries to prevent the effects of free radicals.
Table 2. Characteristics of the extracted catechin and nanocatechin
|
Parameter |
Extracted catechin |
Nanocatechin |
|
Catechin Content (%) |
98.54 ± 0.089 |
98.65 ± 0.101 |
|
Water Content (%) |
12.14 ± 0.254 |
11.88 ± 0.63 |
|
pH |
4 – 5 |
4 - 5 |
|
Refractive index |
1.3755 |
1.3755 |
|
Density |
0.9332 |
0.9332 |
|
Molecular weight (πg/mol) |
290.26 |
290.26 |
|
Rotation angle |
6.4 (+) |
6.4 (+) |
|
Appearance |
whitish yellow |
brownish yellow |
|
Water solubility (%) Ethyl acetate solubility (%) |
43.98 83.31 |
68.38 91.99 |
|
Melting point (oC) |
> 159.73 |
> 253.37 |
|
Wavelength of maximum absorption |
279.5 nm |
280 nm |
|
Antioxidant activity (πg /mol) |
2.42 ± 0.467 |
0.65± 0.141 |
3.4 Similarities in cathecin content, moisture content and pH
The content of catechins indicates the amount of the catechin compound in the sample. From the analysis results obtained, the content of extract catechins and nanocatechins were 98.54% ± 0.089 and 98.65 ± 0.101, respectively. This means that the reduction in catechin particle size does not significantly affect the catechin content because the difference in catechin content based on table 2, is only 0.11% higher in nano size catechin content than extract catechins. Both types of catechin met this requirement [25].
The moisture content of the nanocatechin at equilibrium was 0.26% lower than that of the extracted catechin, as shown in the table. The decrease in moisture content was due to the difference in surface area. Dried nanocatechin had a larger surface area than the extracted catechin because small particles have large relative surface areas and thus allow more interactions in their surfaces. Dry and fine particles have a larger surface area, and the reaction process is also more comprehensive.
The pH values of the nanocatechin and extracted catechin were ranged from 4 to 5, showing that high-speed homogenization did not affect the catechin’s pH. This result implied that high-speed homogenization has no effect on hydroxyl groups contained in catechins.
3.5 Similarities in refractive index, density, molecular weight and rotational angle
Extracted catechin and nanocatechin had the same refractive index, density, molecular weight and polarization rotational angle. The similar refractive index of the two solutions indicated that they had the same density, that is, no change in density occurred after catechin was broken into small particles [26]. Molecular weight and angle of rotation are physical properties of catechins. The extract catechins and nanocatechins showed the same molecular weight and angle of rotation. Because there was no change in value after the conversion process to nanocatechins, it was concluded that the homogenization process did not affect the physical, chemical of catechins properties was not optically active [27].
3.6 Differences between the appearances of nanocatechin and extracted catechin
The brownish yellow nanocatechin appeared to be slightly darker in colour than extracted catechin, which is usually whitish yellow. The possible cause is the release of a small amount of non-catechin compounds from the extracted catechin particles during homogenization. The released compounds may have made the nanocatechin slightly darker and might have been tannins, which are known to be present in gambier. The tannin content in gambier usually ranges from 20% to 55% [1].
3.7 Differences in solubility between extracted catechin and nanocatecin in water and ethyl acetate
Table 2 shows that the nano-sized catechin was more soluble than the micro-sized catechin. The solubility of catechin in water and ethyl acetate improved with decreasing particle size. The extracted catechin suspension was light yellow and had a deep layer of sediment, whereas the nanocatechin suspension was brownish yellow and was in the form of a colloid. The solubility of nanocatechins in water increased by 24.4% compared to the catechin extract. As in Table 2, the solubility of catechin extract was 43.98% and the solubility increased to 63.38% in nanocatechins. The same thing also happened to ethyl acetate solvent where the solubility of catechin extract was 83.31% increased to 91.99% after being converted to nanocatechins. Solvents that have the same level of polarity as the solute have high solubility [28]. Nanocatechin was 8.68% more soluble in ethyl acetate than extracted catechin.
3.8 Thermal properties of the extracted catechin and nanocatechin
Thermographic analysis results of the two compounds are shown in Figure 3. The initial degradation temperature (253.37°C) of nanocatechin was higher than that of the extracted catechin (159.73°C) and the mass loss at this stage was 2.4%. Similar to the result in lignocellulose, a long ultrasonication time resulted in small particle size and high degradation temperatures and vice versa [29].
The first stage of degradation occurs from 0°C to 100°C and was the result of the evaporation of water [29-31]. In the second stage from 250°C to 500°C, the extracted catechin showed 43.16% mass reduction and the nanocatechin was reduced by 40.39%. The fastest mass loss occurred at 310.04–328.59°C for the extracted catechin, resulting in a loss of 6.33%, and at 275.55–285.94°C for the nanocatechin, resulting in a 4% loss. At 800°C, the extracted catechin lost 89.85% of its mass, whereas nanocatechin lost 93.74%. Catechin as a natural material has a high degradation temperature, and thus it was not completely degraded at 800°C. A higher temperature is necessary to achieve a mass loss rate of 100%. The thermogravimetric curve of the catechin and the TGA curves of the extracted catechin and nanocatechin are shown in Figure 3.
Figure 3. TGA curves the extracted catechin and nanocatechin
3.9 Wavelength of maximum absorbance for the extracted catechin and nanocatechin
The wavelengths with maximum absorbance for catechin and nanocatechin were found to be 279.5 and 280 nm, respectively (Figure 4). Both values were within the range previously measured for catechins, indicating that the final product of the homogenization was still catechin. The maximum absorbance values of catechin can be obtained at 279 and 280 nm [32]. The maximum absorbance of standard catechin occurs at 278 nm [33]. In this study, it was found that the maximum absorbance value of catechins and nanocatechins produced was almost the same as that of previous researchers, which was in the range of 279 -280 nm. Nanocatechins have a maximum absorption rate at a longer wavelength of 0.5 nm compared to extract catechins. The values in this study were similar to these values; that is, nanocatechin had a maximum absorption rate at a wavelength that was slightly longer than that needed for a non-homogenized extract.
Figure 4. Absorbance for different wavelengths for (a) catechin crystals (blue curve), (b) nanocatechin (red curve)
3.10 Antioxidant activity of the extracted catechin and nanocatecin
The IC50 values obtained for the extracted catechin and nanocatechin were $2.42 \pm 0.46$ and $0.65 \pm 0.14$ μg/mol, respectively. A 272.3% increase in antioxidant activity was observed in the extracted catechin when it was converted into nanocatechin. A low IC50 value shows an ability to strongly inhibit DPPH radicals. According to [4], an antioxidant can be considered potent if the IC50 value is less than 50 μg/mL. An IC50 value range of 50–100 μg/mL indicates strong antioxidative properties, and a range of 100–150 μg/mL indicates an average level of antioxidative activity. A range of 150–200 μg/mL indicates weak antioxidative activity. The extracted catechin and nanocatechin can be classed as strong antioxidants, as indicated in Figure 5.
(a) Relationship between IC50 concentration and % inhibition for extracted catechin
(b) Relationship between IC50 concentration and % inhibition for nanocatechin
Figure 5. Graph of relationship between IC50 concentration and % inhibition
From the results of the study, it can be concluded that the catechins extracted with ethyl acetate can be converted into nano-sized particles or nanocatechins with a high-speed homogenizer at a rotational speed of 12,000 rpm and homogenization time of 90 minutes. The results of observations on 12 parameters of physical and chemical properties of catechin extracts and nanocatechins obtained the same 7 parameters, namely catechin content, water content, pH, refractive index, density, molecular weight, and angle of rotation and 5 different parameters, namely appearance, solubility properties, initial degradation temperature, wavelength for maximum absorbance value and antioxidant activity. There was a significant increase in the initial degradation temperature and antioxidant activity if the extract catechins were converted to nanocatechins.
Thanks to the Indonesian Ministry of Research, Technology and Higher Education (Ristekdikti) with funding assistance Research Capacity Building (PKR) scheme, Andalas University, Research Number: 034/SP2H/LT/DRM/2020
[1] Achmad, A., Kassim, J., Suan, T.K., Amat, R.C., Seey, T.L. (2012). Equilibrium, kinetic and thermodynamic studies on the adsorption of direct dye onto a novel green adsorbent developed from Uncaria gambir extract. J. Phys. Sci., 23(1): 1-13.
[2] Shukla, A.S., Jha, A.K., Kumari, R., Rawat, K., Syeda, S., Shrivastava, A. (2018). Role of Catechins in Chemosensitization. In book: Role of Nutraceuticals in Chemoresistance to Cancer (pp. 169-198). http://dx.doi.org/10.1016/B978-0-12-812373-7.00009-7
[3] Murakami, Y., Kawata, A., Ito, S., Katayama, T., Fujisawa, S. (2015). Radical-scavenging and anti-inflammatory activity of quercetin and related compounds and their combinations against RAW264.7 cells stimulated with porphyromonas gingivalis fimbriae. relationships between anti-inflammatory activity and quantum chemical par. In Vivo (Brooklyn)., 29(6): 701-710. PMID: 26546527.
[4] Liu, J., Meng, C.G., Yan, Y.H., Shan, Y.N., Kan, J., Jin, C.H. (2016). Structure, physical property and antioxidant activity of catechin grafted Tremella fuciformis polysaccharide. Int. J. Biol. Macromol., 82: 719-724. https://doi.org/10.1016/j.ijbiomac.2015.11.027
[5] Yang, C.S., Wang, H. (2016). Cancer preventive activities of tea catechins. Molecules, 21(12): 1679. https://dx.doi.org/10.3390%2Fmolecules21121679
[6] Ma, Y., Ding, S., Fei, Y., Liu, G., Jang, H., Fang, J. (2019). Antimicrobial activity of anthocyanins and catechins against foodborne pathogens Escherichia coli and Salmonella. Food Control, 106: 106712. https://dx.doi.org/10.1016/j.foodcont.2019.106712
[7] Reygaert, W.C. (2014). The antimicrobial possibilities of green tea. Front. Microbiol., 5: 1-8. https://doi.org/10.3389/fmicb.2014.00434
[8] Muchtar, H., Yeni, G., Hermianti, W., Diza, Y. (2010). The process of making gambier polyphenol concentrate as food antioxidant. J. Ind. Res., 4(2): 71-82.
[9] Pauli, E.D., Malta, G.B., Sanchez, P.M., Moreira, I.C., Scarminio, I.S. (2014). Mixture design analysis of solvent extractor effects on epicatechin, epigallocatechin gallate, epigallocatechin and antioxidant activities of the Camellia sinensis L. leaves. Anal. Chem. Res., 2: 23-29. https://doi.org/10.1016/j.ancr.2014.08.001
[10] Yeni, G., Syamsu, K., Suparno, O., Mardliyati, E., Muchtar, H. (2014). Repeated extraction process of raw gambiers (Uncaria gambier Robx.) for the catechin production as an antioxidant. Int. J. Appl. Eng. Res., 9(24): 24565-24578.
[11] Jeppsson, J., Arndt, T., Wielders, J.P.M., Raymond, F., Whitfield, J.B. (2014). Toward a standardization of carbohydrate-deficient transferrin (CDT) measurements: I. Analyte definition and proposal of a reference method. Clin Chem Lab Med, 4: 559-562. https://doi.org/10.1515/CCLM.2007.107
[12] Hartono, S.B., Hadisoewignyo, L., Antaresti. (2017). Pembuatan, modifikasi dan pemanfaatan material nano-pori. J. Ilm. Widya Tek., 16(2): 106-110.
[13] Bestari, A.N., Sulaiman, T.S., Purnamasari1, D.A. (2017). Pengaruh pengecilan ukuran partikel pada kasus pembuatan pulveres dari tablet ibuprofen terhadap kecepatan dan profil disolusi serta stabilitasnya. Maj. Farm., 13(1): 45-55.
[14] Octavia, M.D., Halim, A., Indriyani, R. (20212). Pengaruh besar ukuran partikel terhadap sifat – sifat tablet metronidazole. J. Farm. Higea, 4(2): 74-92.
[15] Tsai, Y.J., Chen, B.H. (2016). Preparation of catechin extracts and nanoemulsions from green tea leaf waste and their inhibition effect on prostate cancer cell PC-3. Int. J. Nanomedicine, 11: 1907-1926. https://doi.org/10.2147/IJN.S103759
[16] Patravale, V.B., Date, A.A., Kulkarni, R.M. (2004). Nanosuspensions: a promising drug delivery strategy. J. Pharm. Pharmacol., 56(7): 827-840. https://doi.org/10.1211/0022357023691.
[17] Sun, J., Wang, F., Sui, Y., She, Z.N., Zhai, W.J., Wang, W.J., Deng, Y.H. (2012). Effect of particle size on solubility, dissolution rate, and oral bioavailability: Evaluation using coenzyme Q10 as naked nanocrystals. Int. J. Nanomedicine, 7: 5733-5744. https://doi.org/10.2147/IJN.S34365
[18] Giuseppina, S., Bonferoni, M.C., Ferrari, F., Silvia Rossi, A., Caramella, C.M. (2014). The Role of Particle Size in Drug Release and Absorption. in Particulate Products: Tailoring Properties for Optimal Performance, 11th ed., vol. 19, H.G. Merkus and G.M.H. Meesters (eds.), Ed. Switzerland: Springer International Publishing Switzerland 2014, pp. 253-272.
[19] Yeni, G., Silfia, S., Diza, Y.H. (2019). Effect of solvent type and homogenizer speed on particle characteristics of gambier catechins. J. Litbang Ind., 9(1): 9-14. https://doi.org/10.24960/JLI.V9I1.5227.9-14
[20] Yusoff, A.H.M., Salimi, M.N., Gopinath, S.C.B., Abdullah, M.M.A., Samsudin, E.M. (2020). Catechin adsorption on magnetic hydroxyapatite nanoparticles: A synergistic interaction with calcium ions. Mater. Chem. Phys., 241: 122337. https://doi.org/10.1016/j.matchemphys.2019.122337
[21] Kasim, A., Malrianti, Y., Derosya, V., Syukri, D. (2019). GC-MS screening of valuable volatile compounds in the waste of uncaria gambir. Ann. Biol., 35(2): 242-245.
[22] Row, K.H., Jin, Y. (2006). Recovery of catechin compounds from Korean tea by solvent extraction. Bioresour. Technol., 97(5): 790-793. https://doi.org/10.1016/j.biortech.2005.04.001
[23] Danaei, M., Dehghankhold, M., Ataei, S., Davarani, H.F., Javanmard, R., Dokhani, A., Khorasani, S., Mozafari, M.R. (2018). Impact of particle size and polydispersity index on the clinical applications of lipidic nanocarrier systems. Pharmaceutics, 10(2): 1-17. https://doi.org/10.3390/pharmaceutics10020057
[24] Yokoyama, T., et al. (2018). Basic properties and measuring methods of nanoparticles. in Nanoparticle Technology Handbook, 3rd ed., Elsevier, 3-47. https://doi.org/10.1016/B978-0-444-64110-6.00001-9
[25] Ministry of Health. (2008). Director General of Pharmaceutical Services and Medical Devices. Indonesian herbal pharmacopoeia. no. Edisi I, 2008, pp. 17-20.
[26] Wiederseiner, S., Andreini, N., Epely-Chauvin, G., Ancey, C. (2011). Refractive-index and density matching in concentrated particle suspensions: A review. Exp. Fluids, 50(5): 1183-1206. https://doi.org/10.1007/s00348-010-0996-8
[27] Kasim, A., Asben, A., Mutiar, S. (2015). The study of Gambir quality and its relationship with characteristics of tanned leather. Maj. Kulit, Karet dan Plast., 31(1): 55-64. https://doi.org/10.20543/mkkp.v31i1.220
[28] Pinelo, M., Rubilar, M., Jerez, M., Sineiro, J., Núñez, M.J. (2005). Effect of solvent, temperature, and solvent-to-solid ratio on the total phenolic content and antiradical activity of extracts from different components of grape pomace. J. Agric. Food Chem., 53(6): 2111-2117. https://doi.org/10.1021/jf0488110
[29] Asrofi, M., Abral, H., Kasim, A., Pratoto, A., Mahardika, M., Hafizulhaq, F. (2018). Characterization of the sonicated yam bean starch bionanocomposites reinforced by nanocellulose water hyacinth fiber (WHF): The effect of various fiber loading. J. Eng. Sci. Technol., 13(9): 2700-2715.
[30] Abral, H., Putra, G.J., Asrofi, M., Park, J.W., Kim, H.J. (2018). Effect of vibration duration of high ultrasound applied to bio-composite while gelatinized on its properties. Ultrason. Sonochem., 40: 697-702. https://doi.org/10.1016/j.ultsonch.2017.08.019
[31] Syafri, E., Kasim, A., Abral, H., Asben, A. (2017). Effect of precipitated calcium carbonate on physical, mechanical and thermal properties of cassava starch bioplastic composites. International Journal on Advanced Science Engineering and Information Technology, 7(5): 1950. http://dx.doi.org/10.18517/ijaseit.7.5.1292
[32] Chen, J., Thilakarathna, W.P.D.W., Astatkie, T., Rupasinghe, H.P.V. (2020). Optimization of catechin and proanthocyanidin recovery from grape seeds using microwave-assisted extraction. Biomolecules, 10(2): 243. https://doi.org/10.3390/biom10020243
[33] Vandeputte, O.M., Kiendrebeogo, M., Rajaonson, S., Diallo, B., Mol, A., El Jaziri, M., Baucher, M. (2010). Identification of catechin as one of the flavonoids from combretum albiflorum bark extract that reduces the production of quorum-sensing-controlled virulence factors in pseudomonas aeruginosa PAQ1. Appl. Environ. Microbiol., 76(1): 243-253. https://doi.org/10.1128/aem.01059-09