Yuto Sato![]() | Tomohiro Fukui*
| Tomohiro Fukui*![]()
© 2025 The authors. This article is published by IIETA and is licensed under the CC BY 4.0 license (http://creativecommons.org/licenses/by/4.0/).
OPEN ACCESS
Atherosclerosis is a major risk factor for cardiovascular diseases, and its diagnosis is crucial at an early stage. carotid ultrasonography is the current primary diagnostic method for atherosclerosis. However, carotid ultrasonography has problems in the early detection and evaluation of the mechanical properties of the arterial wall. To address these issues, waveform analysis focusing on pulse wave propagation has garnered attention. Despite its potential, few studies have performed pulse wave separation in an environment where pulse waves interfere with each other, as in vivo, and evaluated the reflected waveforms using three-dimensional fluid–structure interaction (FSI) analysis. In this study, pulse wave propagation was reproduced to investigate the relationship between local changes in the mechanical properties of the arterial wall and the reflected waveforms. Using a three-dimensional cylindrical model, coupled FSI analysis was performed with commercial codes by Altair. The results showed that an increase in Young’s modulus amplified the reflected wave amplitudes and elongated the wavelengths. The results also showed trends similar to the theoretical reflection coefficients, particularly for larger changes in Young’s modulus, which closely aligned with the theoretical values. These findings indicate that evaluating reflected waves can lead to estimating the local mechanical properties of the arterial walls.
atherosclerosis, fluid–structure interaction, wave form analysis, wave separation, pulse wave propagation, wave reflection, large blood vessels, arterial wall stiffness
From the perspective of mechanical engineering, atherosclerosis is characterized by the thickening of the tunica media caused by the infiltration of lipids between the intima and media based on the low shear stress hypothesis [1]. This process leads to geometric and mechanical changes in the arterial wall, which are observed as local thickening, stenosis, or stiffening. Atherosclerosis is a crucial risk factor for cardiovascular diseases, such as myocardial infarction and stroke. Atherosclerosis often presents with few noticeable symptoms; thus, diagnosis at an early stage is crucial.
Atherosclerosis develops in specific local sites, particularly the carotid artery [2]. The current primary diagnostic method for atherosclerosis leverages carotid ultrasonography [3]. However, carotid ultrasonography poses limitations in early detection and mechanical evaluation. Early detection is hindered because individuals rarely seek medical attention if they are without symptoms, leading to delays in the diagnosis of atherosclerosis with few noticeable symptoms. Therefore, an affordable and user-friendly diagnostic approach that facilitates routine monitoring at home without requiring hospital visits is essential. From a mechanical perspective, ultrasonography and other imaging modalities [4, 5] focus mainly on geometric changes, which renders evaluation of mechanical properties such as arterial stiffness challenging. For example, an ultrasound-based diagnostic technique has been proposed to estimate tissue stiffness by applying a certain stress to the tissue and evaluating displacement and strain using two-dimensional ultrasound image correlation [6]. However, since the stress distribution is not known clearly, Young’s modulus cannot be quantitatively determined, and it is difficult to evaluate localized mechanical properties. Because atherosclerosis affects mechanical characteristics, assessments must incorporate geometric and mechanical perspectives.
Waveform analysis of pulse waves, which are vibrations of the arterial wall induced by cardiac contraction, shows promise in addressing these issues. The propagation of the pulse waves toward the periphery is referred to as the pulse wave propagation phenomenon. Pulse wave measurements can be easily performed by attaching cuffs to the upper arm and ankle. Similar to blood pressure measurement, this is a simple and non-invasive method that can be easily conducted at home. Moreover, the pressure waveforms derived from these measurements contain mechanical responses, suggesting that waveform analysis has the potential to enable quantitative assessment of arterial stiffness. Furthermore, previous studies have indicated that the phase inversion of reflected pressure waveforms differs between aneurysms and stenotic regions [7], implying that waveform analysis can provide insights into not only mechanical properties but also geometric changes in the artery. Therefore, waveform analysis is regarded as a diagnostic method of atherosclerosis from a mechanical perspective.
Pulse waves naturally separate into transmitted (forward-traveling) and reflected (backward-traveling) waves at mechanical or geometric discontinuities. Atherosclerosis, which develops in local areas, serves as a point of discontinuity. Consequently, the waveforms of the reflected waves are thought to indicate the mechanical (stiffness) and geometric (stenosis, thickening, or aneurysms) characteristics of the artery. Evaluating the reflected wave components may thus facilitate the identification of the location, severity, and mechanical properties of atherosclerotic lesions.
Given the complex environment of the in vivo vasculature, which includes numerous discontinuities such as bifurcations and tapering, forward and backward wave components co-exist. Therefore, to evaluate the reflected wave alone, the pulse wave should be separated into forward and backward components. Parker and Jones [8] proposed a method of separating pulse waveforms into forward and backward components using one-dimensional analysis. Fukui et al. [7] conducted three-dimensional pulse wave propagation analyses and confirmed that the reflected waves from stenoses and aneurysms have different phases. Despite extensive studies on pulse wave propagation [9-11], very few studies have employed three-dimensional fluid–structure interaction (FSI) analyses to separate pulse waves and evaluate reflected waveforms. Additionally, only a limited number of studies have investigated the effects of fluid viscosity and non-oscillatory components, which cannot be considered in one-dimensional analysis, on pulse waveforms. These aspects remain largely unexplored. Thus, in the present study, we performed pulse wave propagation analysis using three-dimensional FSI and investigated the relationship between the local changes in the mechanical properties of the arterial wall and the reflected waveforms. Furthermore, this study aimed to establish evaluation indices that can estimate the degree of atherosclerosis.
2.1 Computational model
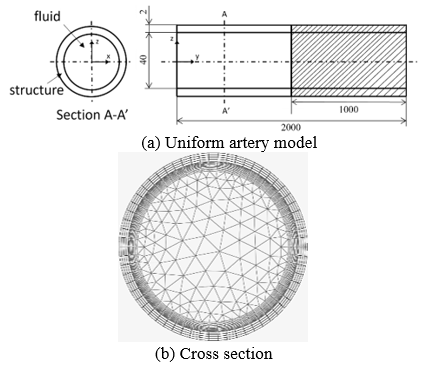
To simulate the localized changes in the mechanical properties of the arterial wall, a three-dimensional straight cylindrical model was adopted (Figure 1).
The target artery was the aorta, with a wall thickness of 2 mm and an internal radius of 20 mm. The cross-section of the computational model was defined in the z-x plane, with the y-axis aligned with the longitudinal direction. In the region 0 mm ≤ y ≤ 1,000 mm, Young’s modulus was set to E=0.5 MPa, whereas in the region 1,000 mm ≤ y ≤ 2,000 mm, three models with E = 1.0, 2.0, and 3.0 MPa were used. Varying Young’s modulus locally reproduces the changes in the mechanical properties characteristic of atherosclerosis. The total length of the model (L = 2,000 mm) prevented interference between the reflected waves generated at the outlet boundary and the discontinuity at 1,000 mm. In addition, the arterial wall in the computational model was assumed to be a linear elastic material with a Poisson’s ratio of ν = 0.45. Blood viscosity was set to μ = 4.0 × 10⁻³ Pa.s and the density to ρ = 1,000 kg/m3, and pseudocompressibility was introduced to stabilize the computations [12], with the sound speed set to c = 100 m/s. The fluid and solid regions had 1,002 for the fluid region and 248 elements in the cross-section, respectively. The longitudinal resolution was set at 5-mm intervals, resulting in a total of 325,402 elements, including the inlet and outlet cross-sections.
Figure 1. Computational model
2.2 Governing equations
To solve the FSI using the arbitrary Lagrangian–Eulerian method, commercial software from Altair Engineering Inc. (fluid, AcuSolve; structure, OptiStruct) was employed. The equilibrium equation for the structure was solved using the generalized-α method Eqs. (1)-(3).
ft+αΔtext=M((1−αm)at+Δt+αmat)+Cut+Δt+ft+αΔtint (1)
ut+Δts=uts+Δt((1−γ)at+γat+Δt) (2)
xt+Δt=xts+Δtuts+12Δt2((1−2β)at+2βat+Δt) (3)
For the fluid, the Navier–Stokes equation Eq. (4) and the continuity equation Eq. (5) with pseudo-compressibility were employed.
ρ∂→u∂t+(ρ→u⋅∇)→u=−∇p+∇⋅τ (4)
βT∂p∂t+∇⋅→u=0,βT=1ρc2 (5)
2.3 Boundary conditions
The ends of the arterial wall were fixed, and no-slip conditions were applied to the wall Eqs. (6) and (7).
us=ωs=0 (6)
xf=xs (7)
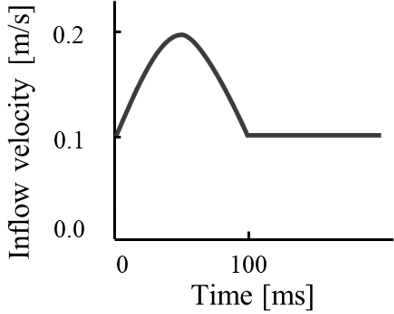
At the inlet, a steady uniform flow with a velocity of 0.1 m/s perpendicular to the cross-section was imposed as the base flow, upon which a single half-sine wave with a period of 0.1 s was superimposed (Figure 2). The amplitude of the half-sine wave was 0.1 m/s, and the simulation time was set to 0.6 s. The cross-sectional mean values of the velocity and pressure were sampled at 10-mm intervals along the longitudinal direction, with a sampling frequency of 10,000 Hz to draw the waveforms.
Figure 2. Inlet boundary condition
2.4 Separation of the pulse waves
Based on the characteristic equations of one-dimensional analysis assuming a homogeneous, inviscid, and incompressible fluid flow in an elastic tube, Parker and Jones [8] proposed a method to separate pulse waves into forward and backward components, this separation method was employed in this study. Four patterns exist for the relationship between pressure and velocity (Table 1). The velocity is determined by whether the pressure is higher or lower than the reference pressure (compression or expansion) and whether the pressure wave is forward or backward. For example, a forward compression wave increases the velocity. The phase of the pressure wave is determined by the acoustic impedance changes at discontinuities [13]. Pressure waves exhibit phase inversion in aneurysms, whereas their phase remains unchanged in stenotic regions [7, 14]. In these cases, the pressure and velocity waves become antiphase. Assuming a one-dimensional analysis, the pressure and velocity waveforms can be expressed as the sum and difference of the forward and backward components. This makes it possible to separate the waves into their forward and backward components. In this study, the characteristic impedance Z=ρc was employed, and the pressure and velocity were separated into forward and backward components using Eqs. (8)-(11):
P+=P+ZU2 (8)
U+=U+PZ2 (9)
P−=P−ZU2 (10)
U−=U−PZ2 (11)
Table 1. Relation between the pressure wave and flow velocity
|
|
Forward |
Backward |
|
Compression |
Velocity increases |
Velocity decreases |
|
Expansion |
Velocity decreases |
Velocity increases |
Notes: This table indicates increases or decreases in the velocity. A forward-traveling compression wave increases the velocity, whereas a backward-traveling expansion wave similarly increases the velocity.
In addition, the pulse wave velocity (PWV) [15] was determined using the PU loop method [16, 17]. However, in one-dimensional analysis, the arterial wall is assumed to be homogeneous, whereas in actual arteries, atherosclerosis occurs locally. Additionally, the pressure and velocity are assumed to be uniform across the cross-section, significantly simplifying the analysis. In contrast, three-dimensional analysis accounts for fluid viscosity, leading to non-uniform distributions of pressure and velocity across the cross-section. Moreover, the attenuation and dispersion of waves due to decreased velocity near the wall, caused by fluid viscosity, are typically neglected in one-dimensional analysis. As a result, discrepancies between the theoretical values obtained from the one-dimensional method and the waveform observed in three-dimensional analysis are expected.
2.5 PU loop method
The PWV was calculated from the slope of the pressure–velocity relationship during the early phase of contraction using Eq. (12). The foot-to-foot method and the cross-correlation method are susceptible to variations in waveform due to wave superposition beyond the 800 mm position, where incident and reflected waves coexist. In contrast, the PU loop method estimates PWV based on the slope of pressure and velocity in the early phase of contraction, making it less affected by waveform alterations due to wave superposition. Additionally, previous experiments using canine arteries [18] have demonstrated the preference for the PU loop method in PWV estimation, supporting its adoption in this study.
c=±dP±ρdU+ (12)
2.6 Evaluation indices
This study focused on the waveform characteristics to compare the reflected waves for varying Young’s modulus. The evaluation considered the attenuation and dispersion of the waveform, normalized by the inlet waveform. Attenuation was assessed using the amplitude ratio of each waveform. For this evaluation, the peak amplitude ratio of each waveform was employed. The theoretical reflection coefficient Rt for the amplitude ratio of the incident and reflected pressure waves was estimated using Eq. (13) [19], where c0 and c1 are the PWVs in the regions 0 mm ≤ y ≤ 1,000 mm and 1,000 mm ≤ y ≤ 2,000 mm, respectively. These velocities were calculated using the Moens–Korteweg [20] in Eq. (14), which describes the PWV in ideal elastic tubes.
Rt=c1−c0c1+c0 (13)
c0,1=√Eh2ρr (14)
Dispersion was evaluated using the wavelength ratio, which was defined as the time difference at the extrema adjacent to the peak of the waveform.
3.1 Validation
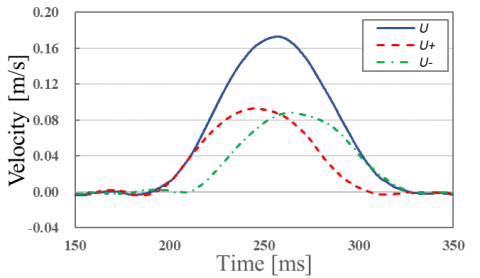
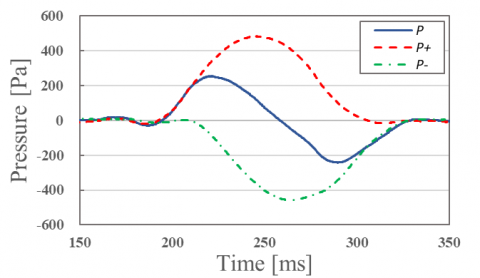
The physical phenomena reproduced in the three-dimensional straight cylindrical model used in this study were validated. The validation employed homogeneous cylindrical models measuring 1,000 mm long with wall thicknesses h = 2, 3, and 4 mm, focusing on single-pulse wave propagation and the amplitude of reflected waves generated at the outlet boundary. Figure 3 shows the separated forward and backward components of the pulse wave at 950 mm near the outlet. The measured pulse wave is represented by a solid line, whereas the separated wave components are shown with dashed lines. In Figure 3(a) and 3(b), the pressure and velocity waveforms closely matched their forward components until the reflected wave (backward component) appeared. In addition, the phase inversion between the pressure and velocity reflected waves indicates the applicability of the one-dimensional separation method to three-dimensional analysis.
(a) Separation of the flow pulse wave at 950 mm
(b) Separation of the pressure pulse wave at 950 mm
Figure 3. Separation of the pulse waves near the outlet boundary
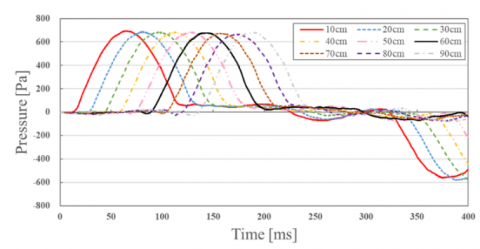
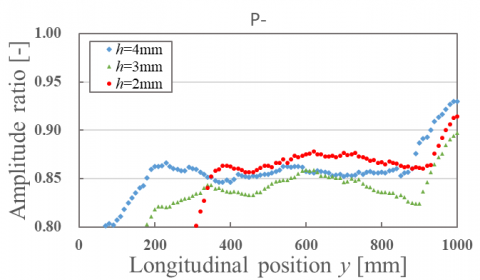
Figure 4(a) presents the time variations in forward pressure wave components at various longitudinal positions, whereas Figure 4(b) shows the backward components. Figures 5(a) and 5(b) show the amplitude ratios of the forward and backward pressure waves at the outlet boundary for varying wall thicknesses, respectively.
The results in Figure 4(a) confirm the propagation of the pressure pulse waves from the inlet to the periphery. Figure 4(b) demonstrates the generation of the reflected waves at the outlet boundary, accompanied by phase inversion. As shown in Figure 5(a), considering the linear elasticity of the arterial wall, the fluid viscosity predominantly governs the waveform attenuation. However, no significant differences were observed with changes in the wall thickness, indicating that the fluid viscosity does not affect waveform evaluation. Similar trends were observed for the reflected waves at the outlet boundary (Figure 5(b)). These findings confirm that the pulse wave propagation phenomena were successfully reproduced, and this validated the physical accuracy of the analysis.
(a) Forward pressure wave at each point in the y direction
(b) Backward pressure wave at each point in the y direction
Figure 4. Separation of the pressure waves
(a) Amplitude ratio of the forward pressure wave at each point in the y direction
(b) Amplitude ratio of the backward pressure wave at each point in the y direction
Figure 5. Amplitude ratio of the pressure waves
3.2 Evaluation of reflected waves induced by mechanical property changes
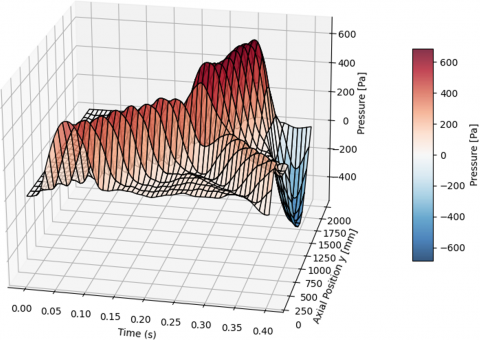
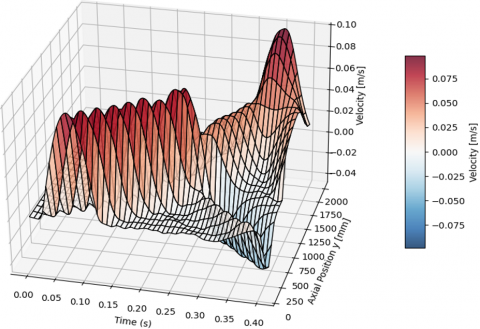
The effects of local changes in the mechanical properties on the amplitude and wavelength of the reflected waves were investigated. Figure 6 illustrates the propagation of reflected waves along the arterial wall due to changes in the mechanical properties. The figure also shows the results of changing the Young’s modulus from E = 0.5 MPa to 3.0 MPa and represents the waveforms at various positions along the y-axis. In addition, Figure 6(a) depicts the cross-sectional average pressure, whereas Figure 6(b) represents the color-coded distribution of the cross-sectional average velocity along the y-axis. At mechanical discontinuities characterized by increased Young’s modulus, positive reflection of the pressure waves and negative reflection of the velocity waves were observed.
(a) Reflection of the pressure pulse waves
(b) Reflection of the velocity pulse waves
Figure 6. Reflection of pulse waves at mechanical discontinuities
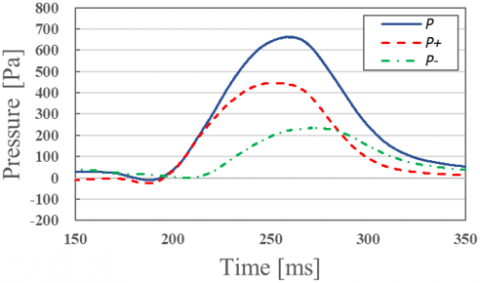
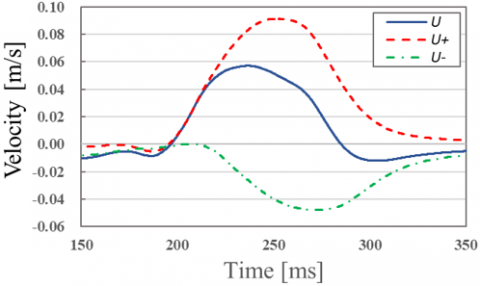
Figure 7 shows the separated pulse wave components at 950 mm for a model with E = 0.5 MPa in 0 mm ≤ y ≤ 1,000 mm and E = 3.0 MPa in 1,000 mm ≤ y ≤ 2,000 mm. Figure 7(a) demonstrates the positive phase of the backward pressure wave components at discontinuities with increased Young’s modulus, consistent with the theoretical reflection coefficient Rt. Figure 7(b) indicates the negative phase of the backward velocity wave components, aligning with the concept that backward compression waves reduce velocity (Table 1). The agreement between the forward components and the slopes of the pressure and velocity waveforms before reflection confirms the separability of the pulse waves into the forward and backward components.
(a) Separation of the pressure pulse waves at the 950 mm position
(b) Separation of velocity pulse waves at the 950 mm position
Figure 7. Separation of pulse waves near mechanical discontinuities
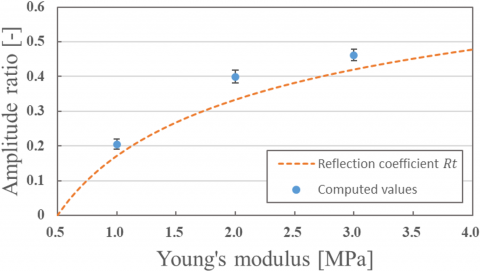
Figure 8 presents the relationship between changes in Young’s modulus and the amplitude of the reflected waves. An increase in Young’s modulus led to higher reflected wave amplitudes, as this can be attributed to increased larger acoustic impedance differences. Figure 9 compares numerical results with theoretical values, showing similar trends. The computed values represent the average amplitude ratio of the reflected waves in the region 0 mm ≤ y ≤ 1,000 mm, the error bars indicate the standard deviation, and the dashed line represents the theoretical reflection coefficient. The slightly higher numerical values can be attributed to the three-dimensional analysis, which accounts for arterial wall elasticity and nonlinear effects, in contrast to the theoretical one-dimensional analysis. These findings propose that the measured pulse waves in practical settings may also exhibit slightly higher values than the theoretical predictions.
Figure 8. Amplitude ratio of backward pressure waves associated with changes in Young’s modulus
Table 2 confirms that changes in Young’s modulus from 0.5 to 3.0 MPa yield results closer to the theoretical values. However, small reflected waves are more susceptible to influences such as no oscillatory components and boundary conditions. Therefore, for small changes in Young’s modulus, the discrepancies with the theoretical values increased in the present results.
Figure 9. Comparison of the amplitude ratio of the reflected waves with theoretical values
Table 2. Error rate compared with the theoretical values
|
|
E=1.0 MPa |
E=2.0 MPa |
E=3.0 MPa |
|
Reflection coefficient Rt |
0.1716 |
0.3333 |
0.4202 |
|
Amplitude ratio |
0.2049 |
0.3997 |
0.4616 |
|
Error rate |
19.40% |
19.92% |
9.86% |
Notes: We calculated the error rate by comparing the computed average to the theoretical value and then dividing the difference by the theoretical value.
Finally, Figure 10 illustrates the relationship between the changes in Young’s modulus and the wavelength of the reflected waves. Similar to the amplitude ratios, the wavelength ratios increased with higher Young’s modulus. This can be attributed to the increased PWVs resulting from the higher Young’s modulus, which elongates the wavelengths. However, for small changes in Young’s modulus, nonoscillatory components interfere with the reflected waves. This makes accurate wavelength estimation more challenging, emphasizing the need for alternative indices or refined definitions of the wavelength to evaluate waveform dispersion effectively.
Figure 10. Wavelength ratio of backward pressure waves associated with changes in Young’s modulus
These results demonstrate that the reflected waveforms contain information about changes in the mechanical properties of the arterial wall. Evaluating reflected waves is a promising approach for estimating the mechanical characteristics of the arterial wall.
In this study, we reproduced single-pulse wave propagation phenomena in a three-dimensional straight cylindrical model and investigated the relationship between the local changes in the mechanical properties of the arterial wall and the reflected waveforms at discontinuities. The results showed that larger increases in Young’s modulus corresponded to greater reflected wave amplitudes and longer wavelengths, likely due to larger impedance differences. The numerical results exhibited trends similar to the theoretical reflection coefficients, with smaller discrepancies for larger changes in Young’s modulus.
Conversely, small changes in Young’s modulus resulted in a greater relative influence of nonoscillatory components and boundary conditions on the reflected waveforms. Such interference makes it more difficult to estimate the wavelength precisely. These findings suggest that reflected wave analysis is a viable method for estimating the mechanical properties of arterial walls. However, additional indices or refined methods for determining the wavelength are necessary for evaluating dispersion accurately.
This work was supported by Altair Engineering Inc. through the use of HyperWorks provided as part of the Altair Research Support Program (ARSP).
|
a |
acceleration, m.s-2 |
|
c |
pulse wave velocity |
|
cs |
speed of sound, m.s-1 |
|
C |
viscous damping, kg.s-1 |
|
E |
Young’s modulus, Pa |
|
f |
total load, N |
|
h |
wall thickness of the blood vessel wall, m |
|
K |
stiffness matrix, N.m-1 |
|
L |
axial length of the model, m |
|
M |
mass, kg |
|
p |
pressure, Pa |
|
P |
pressure wave, Pa |
|
r |
inner radius of the blood vessel wall, m |
|
Rt |
dimensionless reflection coefficient |
|
t |
time, s |
|
Δt |
time step width, s |
|
u |
velocity, m.s-1 |
|
→u |
flow velocity, m.s-1 |
|
U |
velocity wave, m.s-1 |
|
x |
displacement, m |
|
Z |
characteristic impedance, kg.m-1.s-1 |
|
Greek symbols |
|
|
ρ |
density, kg.m-3 |
|
v |
Poisson’s ratio |
|
μ |
blood viscosity, Pa.s |
|
αm |
dimensionless mass approximation parameter |
|
β |
dimensionless newmark beta parameter |
|
βT |
pseudo-compressibility coefficient, Pa-1 |
|
γ |
dimensionless newmark gamma parameter |
|
τ |
viscous stress tensor, Pa |
|
Subscripts |
|
|
t |
previous time when displacement increment is solved |
|
t+h |
current time |
|
ext |
external force |
|
int |
internal force |
|
s |
structure |
|
f |
Fluid |
|
+ |
Forward |
|
- |
backward |
|
0 |
0 mm≤y≤1,000 mm |
|
1 |
1,000 mm≤y≤2,000 mm |
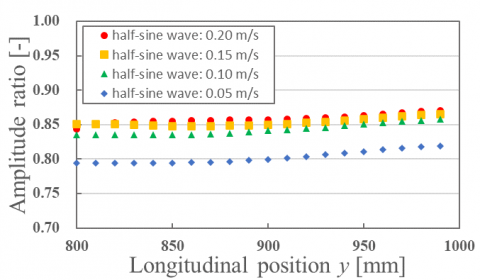
The effect of the amplitude of the half-sine wave on the results was examined in the three-dimensional straight cylindrical model employed in this study. For this verification, a homogeneous straight cylindrical model with a length of 1000 mm and a wall thickness of h=2 mm was adopted, as in Section 3.1. The analysis focused on the propagation of a single pulse wave and the amplitude of the reflected wave generated at the outlet boundary. The amplitude of the half-sine wave was varied in four conditions, including those used in the main text (0.10 m/s), with values of 0.05, 0.15, and 0.20 m/s. Figure A1 illustrates the amplitude of the reflected wave in the region 800 mm ≤ y ≤ 1,000 mm near the outlet for each inlet velocity condition. As shown in Figure A1, the amplitude ratio increased with increasing inlet velocity. However, no significant difference was observed for amplitudes of 0.10 m/s or higher. Given that the maximum blood flow velocity in the human aorta generally exceeds 0.10 m/s and is unlikely to be as low as 0.05 m/s, the variation in amplitude is considered to have minimal influence on the results presented in Section 3.2.
Figure A1. The effect of the amplitude of the half-sine wave on the amplitude of the reflected wave
[1] Caro, C.G., Fitz-Gerald, J.M., Schroter, R.C. (1971). Atheroma and arterial wall shear - Observation, correlation and proposal of a shear dependent mass transfer mechanism for atherogenesis. Proceedings of the Royal Society of London. Series B. Biological Sciences, 177(1046): 109-159. https://doi.org/10.1098/rspb.1971.0019
[2] DeBakey, M.E., Lawrie, G.M., Glaeser, D.H. (1985). Patterns of atherosclerosis and their surgical significance. Annals of Surgery, 201(2): 132. https://doi.org/10.1097/00000658-198502000-00001
[3] Stein, J.H., Korcarz, C.E., Hurst, R.T., Lonn, E., et al. (2008). Use of carotid ultrasound to identify subclinical vascular disease and evaluate cardiovascular disease risk: A consensus statement from the American Society of Echocardiography Carotid Intima-Media Thickness Task Force. Endorsed by the Society for Vascular Medicine. Journal of the American Society of Echocardiography, 21: 93-111. https://doi.org/10.1016/j.echo.2007.11.011
[4] Agatston, A.S., Janowitz, W.R., Hildner, F.J., Zusmer, N.R., Viamonte, M., Detrano, R. (1990). Quantification of coronary artery calcium using ultrafast computed tomography. Journal of the American College of Cardiology, 15(4): 827-832. https://doi.org/10.1016/0735-1097(90)90282-T
[5] Fayad, Z.A., Fuster, V. (2001). Clinical imaging of the high-risk or vulnerable atherosclerotic plaque. Circulation Research, 89(4): 305-316. https://doi.org/10.1161/hh1601.095596
[6] Gennisson, J.L., Deffieux, T., Fink, M., and Tanter, M. (2013). Ultrasound elastography: Principles and techniques. Diagnostic and Interventional Imaging, 94(5): 487-495. https://doi.org/10.1016/j.diii.2013.01.022
[7] Fukui, T., Parker, K.H., Tsubota, K., Wada, S., et al. (2007). Differentiation of stenosed and aneurysmal arteries by pulse wave propagation analysis based on a fluid-solid interaction computational method. Technology and Health Care, 15(2): 79-90. https://doi.org/10.3233/THC-2007-15202
[8] Parker, K.H., Jones, C.J. (1990). Forward and backward running waves in the arteries: Analysis using the method of characteristics. Journal of Biomechanical Engineering, 112(3): 322-326. https://doi.org/10.1115/1.2891191
[9] Parker K.H. (2009). An introduction to wave intensity analysis. Medical & Biological Engineering & Computing, 47(2): 175-188. https://doi.org/10.1007/s11517-009-0439-y
[10] Wang, K.L., Cheng, H.M., Sung, S.H., Chuang, S.Y., et al. (2010). Wave reflection and arterial stiffness in the prediction of 15-year all-cause and cardiovascular mortalities: A community-based study. Hypertension, 55(3): 799-805. https://doi.org/10.1161/HYPERTENSIONAHA.109.139964
[11] Laurent, S., Boutouyrie, P., Asmar, R., Gautier, I., et al. (2001). Aortic stiffness is an independent predictor of all-cause and cardiovascular mortality in hypertensive patients. Hypertension, 37(5): 1236-1241. https://doi.org/10.1161/01.HYP.37.5.1236
[12] Fukui, T., Parker, K.H., Yamaguchi, T. (2012). Pulse wave propagation in large blood vessels based on fluid- solid interactions methods. Single and Two-Phase Flows on Chemical and Biomedical Engineering, 12: 460-471. http://doi.org/10.2174/978160805295011201010460
[13] Ku, D.N. (1997). Blood flow in arteries. Annual Review of Fluid Mechanics, 29(1): 399-434. https://doi.org/10.1146/annurev.fluid.29.1.399
[14] Hacham, W.S., Khir, A.W. (2019). The speed, reflection and intensity of waves propagating in flexible tubes with aneurysm and stenosis: Experimental investigation. Proceedings of the Institution of Mechanical Engineers, Part H: Journal of Engineering in Medicine, 233(10): 979-988. https://doi.org/10.1177/0954411919859994
[15] Kim, H., Kim, S. (2019). Pulse wave velocity in atherosclerosis. Frontiers in Cardiovascular Medicine, 6: 41. https://doi.org/10.3389/fcvm.2019.00041
[16] Khir, A.W., O'Brien, A., Gibbs, J.S., Parker, K.H. (2001). Determination of wave speed and wave separation in the arteries. Journal of Biomechanics, 34(9): 1145-1155. https://doi.org/10.1016/S0021-9290(01)00076-8
[17] Khir, A.W., Parker, K.H. (2002). Measurements of wave speed and reflected waves in elastic tubes and bifurcations. Journal of Biomechanics, 35(6): 775-783. https://doi.org/10.1016/S0021-9290(02)00025-8
[18] Khir, A.W. (2000). The hemodynamic effects of aortic clamping. Ph.D. Thesis, University of London (London). https://spiral.imperial.ac.uk/entities/publication/ed6b8f46-ae41-42ec-b2e8-45bea9148fe5.
[19] Li, Y., Parker, K.H., Khir, A.W., (2016). Using wave intensity analysis to determine local reflection coefficient in flexible tubes. Journal of Biomechanics, 49(13): 2709-2717. https://doi.org/10.1016/j.jbiomech.2016.06.004
[20] Bramwell, J.C., Hill, A.V. (1922). The velocity of the pulse wave in man. Proceedings of the Royal Society of London. Series B, Containing Papers of a Biological Character, 93(652): 298-306. https://doi.org/10.1098/rspb.1922.0022