Khalid H. Ibrahim | Nourhan R. Korany | Saber M. Saleh*
© 2021 IIETA. This article is published by IIETA and is licensed under the CC BY 4.0 license (http://creativecommons.org/licenses/by/4.0/).
OPEN ACCESS
The electric power transformer is an essential part of an electrical power system since it is used to step up or down voltage levels to maintain the system performance as well as possible. Frequency response analysis (FRA) is one of the most widely used techniques for detecting various types of mechanical damage in transformers. The equivalent circuit of the transformer will be represented by a complex network of R, L, and C elements in the FRA technique. For transformer faults diagnosis, various calculation techniques and diagnostic techniques may be used, such as acoustic emission analysis, thermal images of electromagnetic radiation, transformer temperature, and humidity analysis. SFRA test is one of these techniques that could be used to determine the fault type based on its response over a wide frequency range. The main challenge of the SFRA test is that the functional interpretation requirement for this test is not universally accepted Also statistical features are defined for this SFRA response to be used in fault detection and classification. In this paper, the effect of the transformer rating on the fault diagnosis techniques using SFRA is tested. Also, the effect of the transformer VA rating on the statistical parameters and the classification rules of fault diagnosis is discussed. Finally, the features used in fault diagnosis are ranked according to its independence of the transformer rating resulting in a more accurate matching fault diagnosis technique.
SFRA, statistical parameters, VA rating, fault diagnosis, features
Power transformers are critical assets in power networks, and their state determines the transmission and distribution network’s reliability. Due to its higher cost and because it is a key component in providing an adequate operation, transformer is one of the most important elements of power systems [1]. We can assume that they would have varying frequency responses with different types of transformers since the frequency response of the transformer is significantly affected by the magnetic circuit and the configuration of the winding. The fault can occur at an unforeseeable time of activity of the transformer. The result of the fault can be a power loss for a short or long time. The calculated values of the transforming parameters must be analyzed, also for monitoring purposes. This is then important on the basis of knowledge of sensitivity to negative effects of energetic effects, such as short-circuit currents, over currents or over voltages. The achievement of these objectives through the use of adequate diagnostics can help to identify the negative effects of short-circuit and recommend new measurement procedures. In addition, it is possible to identify the actual failure to transform. Except for winding faults (inter-turn short circuit, short time connection to the tank) the tank could be damaged by the arc pressure [2]. The Frequency Response Analysis (FRA) approach is known as Impulse Frequency Response Analysis (IFRA) and Sweep Frequency Response Analysis (SFRA). In both approaches, the frequency response of the power transformer is related to the actual reference measurement. The IFRA uses, as the name suggests, an impulse in the time domain, while the SFRA evaluates a frequency sweep. As the IFRA is more sensitive to noise [3]. SFRA is a tool that can indicate if a transformer's core or winding is moving. it's a relatively simple test with very powerful diagnostic techniques. However, considerable care should be exercised in both applying the test to accepted standards and interpreting the test findings in order to derive value from the tests themselves. Comparison with other diagnostic techniques, the primary advantages of FRA are its established sensitivity to a variety of winding problems and a lesser dependency on previous reference measurements, although an objective and systematic interpretation methodology is required [4]. As can be observed, modern SFRA test instruments and suitable software can provide accurate SFRA measurement even under harsh conditions and help to improve the condition evaluation of the power transformer [5]. The best way to deal with the sensitivity and effect of different types of faults, the effects of localized faults on circuit parameters, and diagnostic techniques is to use an accurate transformer model. Modelling and simulation of transformers will also enable better understanding and interpretation of the results [6]. In the present research the SFRA test is simulated for each fault type with different transformer ratings 0.1,10 and 40 MVA. The SFRA response for each fault is analyzed through the statistical parameters of the SFRA response for each fault and hence effect of the transformer rating on the fault diagnosis technique using
SFRA test could be estimated. finally, the most robust features could be ranked in the fault diagnosis rules using SFRA test resulting in more accurate matching. Also, the fault diagnosis rules could be adapted based the dependency between the statistical features of SFRA test and transformer rating.
The principle of frequency response analysis (FRA) was built on the basis of the fact that a complex network of distributed resistive, capacitive, inductive, and conductance parameters between high voltage (HV) and low voltage (LV) windings can describe all transformer components, including winding, core, and insulation device, as shown in Figure 1. Percentage estimating the parameters of a transformer high frequency model for accurate FRA studies was not given much attention [7]. A widely used high-frequency equivalent circuit of two winding ferrite transformer is shown in Figure 1. In order to facilitate the analysis, the model is divided into four blocks [8]:
P: Primary block
T: Ideal transformer block
M: Mutual block S: Secondary block.
Figure 1. High-frequency equivalent circuit of power transformer for one disc
All the parameter including basic and parasitic parameters are illustrated in Table 1.
Table 1. Transformer parameters illustration
|
Parameter |
Description |
|
LP |
Primary inductance of transformer |
|
LS |
Secondary inductance of transformer |
|
LP-Leak |
Leakage inductance in primary side of transformer |
|
LS-Leak |
Leakage inductance in secondary side of transformer |
|
N |
Turns ratio of transformer |
|
CP |
Inter turn capacitance in primary side of transformer |
|
CS |
Inter turn capacitance in secondary side of transformer |
|
RP |
Primary winding resistance |
|
RS |
secondary winding resistance |
|
CPS |
Mutual capacitance of primary and secondary turns |
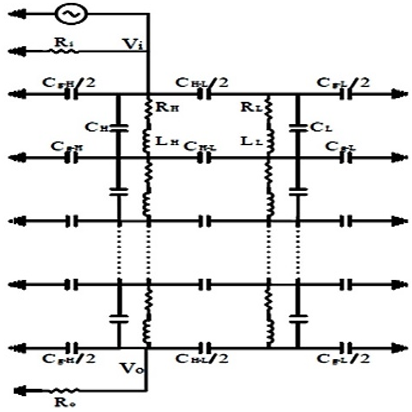
Figure 2. High frequency equivalent circuit of power transformer with n discs for SFRA test
where,
RH, RL: Resistance of HV and LV windings respectively.
LH, LL: Inductance of HV and LV windings respectively.
Cg-H, Cg-L: Capacitance of HV and LV to Earth respectively.
CH, CL: shunt Capacitances of the HV and LV respectively.
CHL: Capacitance between HV and LV winding.
The transformer can be specifically modelled as a distributed R-L-C circuit in a high-frequency model. The single-winding transformer is divided into cascaded pi-networks consisting of self-inductance, resistance, series / shunt capacitance, and dielectric shunting conductivity. It is implied that joint inductances are packed into series inductances for convenience, and some studies also neglect the effect of dielectric conductivity as shown in Figure 2 [9].
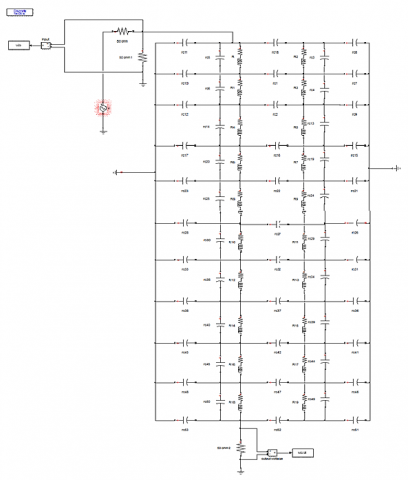
Figure 3. MATLAB Simulink model of SFRA test of the tested power transformer 10 discs
Figure 3 shows the simulation of the transformer model in. The MATLAB Simulink model consists of 10 HV winding discs and 10 LV winding discs at one end of the HV winding, using a low voltage sinusoidal signal with an amplitude determined from the other end of the same winding. The frequency response is derived from the following Eq. (1) [10]:
$T F=20 \log _{10}\left(\frac{V_{o u t}}{V_{i n}}\right)$ (1)
And the frequency response is graphically displayed by graphing the logarithmic amplitude in decibels against the frequency. Transformer parameters used to simulate the model.
The simulation was done on the HV and LV sides. We run on the HV side of the three models. We only function on the LV side of a basic model. To research the effect of different ratings on different faults, we adjust the rating of the transformer.
3.1 Simulation of transformers parameter
Simulation of three power transformers and they have the following ratings and parameters:
Transformer 1: 10 kVA, 11.55/0.238 kV, 3-phase, 50 Hz. The equivalent circuit parameters are given in Table 2. where the winding consists of 6 discs [11].
Transformer 2: 10 MVA, 132/33 kV, 3-phase, 50 Hz. The equivalent circuit parameters are given in Table 2. where the winding consists of 10 discs [6].
Transformer 3: 40 MVA, 66/11 kV, 3-phase, 50 Hz. The equivalent circuit parameters are given in Table 2, where the winding consists of 10 discs [11].
Table 2. Simulated transformers parameter
|
Transformer parameters |
10 kVA |
10 MVA |
40 MVA |
|||
|
HV |
LV |
HV |
LV |
HV |
LV |
|
|
R(Ω) |
1 |
0.5 |
5.294 |
0.022 |
1 |
0.25 |
|
L(µH) |
40 |
20 |
262000 |
1638 |
10 |
10.5 |
|
Csh(ƤF) |
2.35 |
37.27 |
31144.4 |
3212 |
393.4 |
127.67 |
|
Cg(ƤF) |
20 |
718 |
2000 |
5514 |
61.192 |
115.53 |
|
CH-L(ƤF) |
50 |
3000 |
89.283 |
|||
Simulation of Transformer Failures in the Transformer Model, simulation of Transformer Failures by changing particular parameters that are affected by the type of defect, then comparison of the Defect Signal with the Reference Signal (healthy Transformer Response) to determine the effect of the fault on the FRA signature.
3.2 Faults of power transformer
In this paper, simulation for three different power transformers (10 kVA, 10 MVA, 40 MVA) using MATLAB simulation. the Basic model 10 discs for (10 MVA, 40 MVA), 6 discs for (10 kVA), in the present research the SFRA test is simulated for each faults type with different transformer ratings 0.1,10 & 40 MVA. The SFRA response for each fault is analyzed thought the statistical parameters of the SFRA response for each fault and fence effect of the transformer rating on the fault diagnosis technique using SFRA test could be estimated. finally, the most robust features could be ranked in the fault diagnosis rules using SFRA test resulting in more accurate matching. Also, the fault diagnosis rules could be adapted based the dependency between the statistical features of SFRA test and transformer rating.
3.2.1 Turn to turn short circuit at HV side
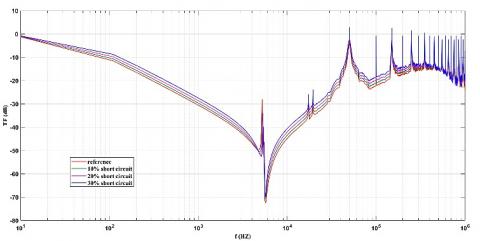
The 10 kVA transformers are tested at 16%, 33% and 50% SC levels, while the 10 MVA and 40 MVA transformers are at 10%, 20% and 30% SC levels to show the SFRA signature under this fault. For the 10 MVA and 40 MVA, the measurement is done by short-circuiting the 1st disc (10%) then short circuiting the 1st and 2nd discs (20%) and eventually short-circuiting the 1st, 2nd and 3rd discs (30%). The same evaluation conditions are applied to the 10 kVA transformer. Figure 4 shows the response of HV winding of 10 kVA transformer using 6 discs under SC fault at HV side, Figure 5 shows the response of HV winding of 10 MVA transformer 10 discs using 10 discs under SC fault at HV side. and Figure 6 shows the response of HV winding of 40 MVA transformer 10 discs using 10 discs under SC fault at HV side.
Figure 4. SC fault over HV winding of 10 kVA transformer 6 discs
Figure 5. SC fault over HV winding of 10 MVA transformer 10 discs
Figure 6. SC fault over HV winding of 40 MVA transformer 10 discs
Turn-to-turn short circuit fault, it is clear that response of 10 MVA and 40 MVA are almost similar and have the same variation tendency with little differences specially in low frequency zone (F˂104 Hz) however for (F˃105 Hz) zones some oscillations appear. For 10 MVA transformer, it differs completely than that of 10 MVA. Also, considerable shifts appear levels in 10 kVA case than that of 10 MVA.
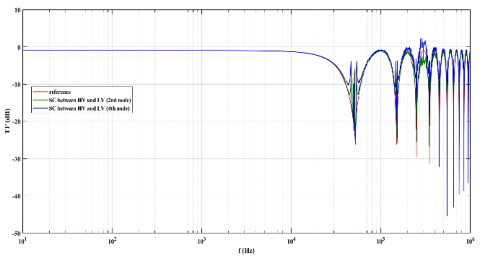
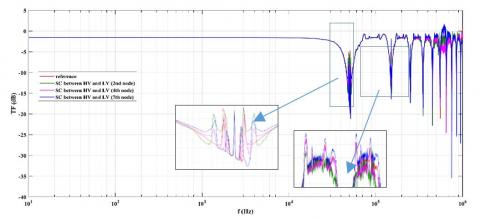
3.2.2 Short circuit fault between the HV and LV windings measured from HV side
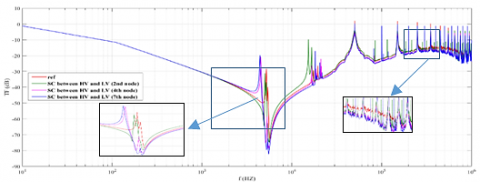
A short circuit is made between the HV and LV windings at nodes 2, 4 of the 10 kVA, 10 MVA and 40 MVA transformers. The response from the HV side is measured. Figure 7 shows the SFRA response of HV and LV winding of 10 kVA transformer using 6 discs under SC fault measured from HV side, Figure 8 shows the SFRA response of HV and LV winding of 10 MVA transformer 10 discs using 10 discs under SC fault measured from HV side .and Figure 9 shows the SFRA response of HV and LV winding of 40 MVA transformer 10 discs using 10 discs under SC fault measured from HV side.
Figure 7. SC fault between HV and LV windings measured from HV side for the 10 kVA transformer 6 discs
Figure 8. SC fault between HV and LV windings measured from HV side for the 10 MVA transformer 10 discs
Figure 9. SC fault between HV and LV windings measured from HV side for the 40 MVA transformer 10 discs
Short circuit fault between the HV and LV windings, both of 10 MVA case and 40 MVA are almost similar as in turn-to-turn short circuit fault with some spikes and oscillations in the high frequency zone (F˃ 104 Hz), however in 10 kVA case, its response is completely different than that of 10 kVA case. Over all the range of frequency.
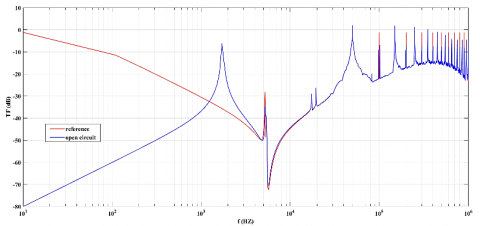
3.2.3 Open circuit fault at HV side
This fault is simulated by the formation of an open circuit (cut) between the transformer discs. the open circuit is made between disc 2 and disc 3 on both sides of the three transformers. Figure 10 shows the SFRA response of 10 kVA transformer using 6 discs under OC fault measured from HV side, Figure 11. shows the SFRA response of 10 MVA transformer 10 discs using 10 discs under OC fault measured from HV side. and Figure 12 shows the SFRA response of 40 MVA transformer 10 discs using 10 discs under OC fault measured from HV side.
Figure 10. HV Winding open circuit fault of the 10 kVA transformer 6 discs
Figure 11. HV winding open circuit fault of the 10 MVA transformer 10 discs
Figure 12. HV Winding open circuit fault of the 40 MVA transformer 10 discs
In Open circuit fault at HV side, both of 10 MVA and 40 MVA have the same pattern with vertical shift, however the variation tendency is the same later in the statistical features calculation. All features, standard deviation, skewness and kurtosis will be nearly the same, however the difference appears in the mean. For 10 KVA case, the response is completely difference than that of 10 MVA. Also, for 10 kVA case the reference and faulty responses for high frequency (F˃ 104 Hz) are identical in contrast to both 10 MVA and 40 MVA cases the faulty and healthy responses are different.
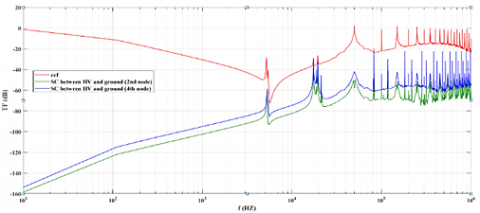
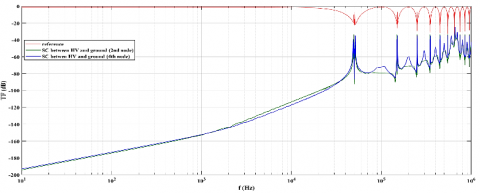
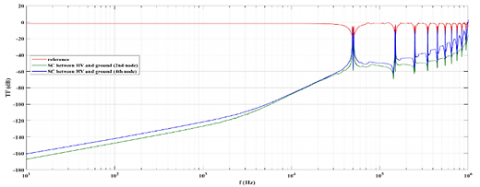
3.2.4 Short circuit between HV winding and ground
This fault is made on the three HV winding transformers. Usually, the fault is caused by node 2 and node 4 of the windings. Figure 13 shows the SFRA response of 10 kVA transformer using 6 discs under short circuit to ground fault for HV winding, Figure 14 shows the SFRA response of 10 MVA transformer 10 discs using 10 discs under short circuit to ground fault for HV winding. and Figure 15 shows the SFRA response of 40 MVA transformer 10 discs using 10 discs under short circuit to ground fault for HV winding.
Figure 13. Short circuit to ground fault at HV winding of the 10 kVA transformer 6 discs
Figure 14. Short circuit to ground fault at HV winding of the 10 MVA transformer 10 discs
Figure 15. Short circuit to ground fault at HV winding of the 40 MVA transformer 10 discs
In short circuit between HV winding and core, both of 10 MVA and 40 MVA responses are approximately the same with considerable vertical shift existing are the whole range. This fault is similar to the short circuit fault between the HV and LV windings, however for 10 kVA response is completely different than that of 10 MVA case.
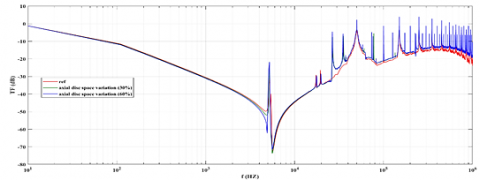
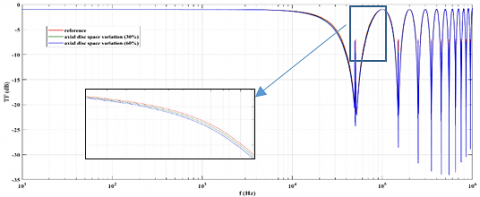
3.2.5 Disc space variation at HV winding
Figure 16. Space variation at HV winding of the 10 kVA transformer 6 discs
This fault is simulated on the HV winding of the three transformers. The series capacitance (Csh) and the self-inductance of the 5th disc increased by 30% and 60%. Figure 16 shows the SFRA response of 10 kVA transformer using 6 discs under Disc space variation at HV winding, Figure 17 shows the SFRA response of 10 MVA transformer 10 discs using 10 discs under Disc space variation at HV winding. And Figure 18 shows the SFRA response of 40 MVA transformer 10 discs using 10 discs under Disc space variation at HV winding.
Figure 17. Space variation at HV side of the 10 MVA transformer 10 discs
Figure 18. Space variation at HV side of the 40 MVA transformer 10 discs
In disc space variation in HV side, also as in other fault types both of 10 MVA and 40 MVA responses are approximately the same only some oscillation exists in high frequency region (F˃ 104 Hz), however for 10 KVA case is different completely than that of 10 MVA.
The whole frequency range (10 Hz -1 MHz) is divided into 4 ranges for the analysis of SFRA responses: range 1 (10 Hz-1 kHz), range 2 (1 kHz-10 kHz), range 3 (10 kHz-100 kHz) and range 4 (100 kHz-1 MHz). There are four statistical parameters determined for each frequency range and they are mean, standard deviation (SD), skewness (SKEW) and kurtosis (KURT). The mean is a qualitative variable center calculation that is derived from an Eq. (2) [12]. The SD is a dispersion measure and is determined using Eq. (3) [12].
The skewness in the data is a measure of asymmetry and is determined using Eq. (4). If skewness is equal to zero, it means that the distribution of data is symmetric to the mean value. Positive skewness means that the data is skewed to the highest value (the positive side of the highest lies in the long tail). Negative skewness, however, suggests that the data is skewed to the highest value (the long tail is on the negative side of the peak) [13]. Compared to the normal distribution (bell shaped), kurtosis characterizes the relative weakness or flatness of a distribution and is determined from Eq. (5) [13].
$\bar{x}=\frac{1}{N} \sum_{i=1}^{N} x_{i}$ (2)
$S D=\sqrt{\frac{1}{N-1} \sum_{i=1}^{N}\left(x_{i}-\bar{x}\right)^{2}}$ (3)
$S K E W=\frac{\frac{1}{N} \sum_{i=1}^{N}\left(x_{i}-\bar{x}\right)^{3}}{\left(\sqrt{\frac{1}{N} \sum_{i=1}^{N}\left(x_{i}-\bar{x}\right)^{2}}\right)^{3}}$ (4)
$S K U R T=\frac{\frac{1}{N} \sum_{i=1}^{N}\left(x_{i}-\bar{x}\right)^{4}}{\left(\frac{1}{N} \sum_{i=1}^{N}\left(x_{i}-\bar{x}\right)^{2}\right)^{2}}$ (5)
where:
$\bar{\chi}:$: the mean value
N: the number of data points (the mean value)
The percentage change between the statistical parameters of the reference response and the fault response is calculated from the following Eq. (6):
$\% \text { change in statistical parameters } = \frac{\text { reference value }-\text { fault value }}{\text { reference value }} \times 100 \% $ (6)
Table 3 shows the statistical parameters for healthy case for the three VA ratings. Results show that the most independent parameters of the transformer rating are the skewness in region 2. However, for parameters: standard deviation in region 1, skewness in region .1, kurtosis in region 1, skewness in region 2 and kurtosis in region 2 and mean in region 2 are almost the same for 10 MVA and 40 MVA. The remaining parameters are randomly changes without clear rules.
Table 4 shows the statistical parameters for turn to turn fault for the three VA ratings. The most of parameters are approximately identical for 10 MVA and 40 MVA ratings specially for mean 1 standard deviation in region .1 and kurtosis in region 1.
Table 5 shows the derivations of parameters given in Table 4 from their corresponding references shown in Table 3.
Table 6 shows the relative values of statistical for HV-LV short circuit fault. Also results show that the most of parameters are nearly the same for 10 MVA and 40 MVA, however 10 KVA case has different values than that of 10 MVA case.
Table 7 shows the statistical parameters of the three cases for open circuit fault. Results show that that the most of these parameters in all frequency zones are approximate identical for 10 MVA and 40 MVA cases except for the mean as expected before in the discussion.
Results of HV to ground fault shown in Table 8 are similar to results of Table 7, all parameters are nearly the same for both 10 MVA and 40 MVA cases however the parameters of 10kVA are different than those of 10 MVA case.
Results of disc space variation are shown in Table 9, results show that the most of parameter for 40 MVA are the more near to parameters for 10 MVA case than that of 10 kVA case.
Table 3. Healthy case of three transformers
|
Region 4 (100 kHz: 1 MHz) |
Region 3 (10 kHz: 100 kHz) |
Region 2 (1 kHz: 10 kHz) |
Region 1 (10 Hz: 1 kHz) |
Rating |
||||||||||||
|
KURT |
SKEW |
SD |
Mean |
KURT |
SKEW |
SD |
Mean |
KURT |
SKEW |
SD |
Mean |
KURT |
SKEW |
SD |
Mean |
|
|
5.8060 |
1.0078 |
3.3705 |
-16.4682 |
3.3751 |
-.03629 |
8.1046 |
-23.047 |
3.6394 |
-0.5530 |
8.9990 |
-47.4975 |
3.4923 |
1.1818 |
8.9592 |
-21.816 |
10 KVA |
|
4.5511 |
-1.4763 |
5.5375 |
-5.5908 |
3.4572 |
-1.1928 |
5.3654 |
-6.0495 |
2.0698 |
-0.5604 |
0.0959 |
-1.103295717 |
2.1742 |
-0.6770 |
0.0011 |
-0.9855 |
10 MVA |
|
9.1612 |
-2.4504 |
3.4238 |
-3.3723 |
7.4788 |
-2.1994 |
3.6476 |
-3.7673 |
2.0962 |
-0.5824 |
0.0145 |
-1.60149725 |
2.1254 |
-0.6628 |
0.0002 |
-1.5838 |
40 MVA |
Table 4. Statistical parameters of the HV winding faults of the 10 kVA & 10 MVA & 40 MVA transformer for turn-to-turn SC fault
|
Region 2 (1 kHz: 10 kHz) |
Region 1 (10 Hz: 1 kHz) |
rating |
Faults type |
||||||
|
KURT |
SKEW |
SD |
Mean |
KURT |
SKEW |
SD |
Mean |
||
|
3.6441 |
-0.5714 |
8.6030 |
-46.6478 |
3.36258 |
1.13640 |
8.777 |
-20.9873 |
10 KVA |
Turn to turn short circuit 10% |
|
1.2998 |
-0.3545 |
0.04243 |
-0.5712 |
1.3363 |
-04121 |
0.0005 |
-0.5179 |
10 MVA |
|
|
2.0959 |
-0.5836 |
0.0122 |
-1.4526 |
2.1187 |
-0.6648 |
0.0001 |
-1.4378 |
40 MVA |
|
|
2.2273 |
-0.2954 |
5.2310 |
-26.9886 |
1.7927 |
0.5959 |
5.0243 |
-11.1438 |
10 KVA |
Turn to turn short circuit 20% |
|
3.6537 |
-0.5002 |
8.4371 |
-45.6681 |
.2171 |
1.0843 |
8.5687 |
-20.0639 |
10 MVA |
|
|
3.8675 |
-0.5386 |
8.2954 |
-44.4928 |
3.0534 |
1.0239 |
8.3260 |
-19.0226 |
40 MVA |
|
|
2.00664 |
-0.3204 |
5.2256 |
-23.9622 |
1.45572 |
0.4573 |
4.3438 |
-8.8513 |
10 KVA |
Turn to turn short -circuit 30% |
|
2.1019 |
-0.5867 |
0.0100 |
-1.3014 |
2.1258 |
-0.6629 |
0.0001 |
-1.2893 |
10 MVA |
|
|
2.1179 |
-0.5938 |
0.0080 |
-1.1478 |
2.1394 |
-0.6584 |
0.0001 |
-1.1382 |
40 MVA |
|
|
Region 4 (100 kHz: 1 MHz) |
Region 3 (10 kHz: 100 kHz) |
rating |
Faults type |
||||||
|
KURT |
SKEW |
SD |
Mean |
KURT |
SKEW |
SD |
Mean |
||
|
5.2222 |
1.0200 |
3.5282 |
-15.9802 |
3.3705 |
-0.3693 |
8.0032 |
-21.923 |
10 KVA |
Turn to turn short circuit 10% |
|
3.2685 |
-1.0405 |
3.3147 |
-3.1207 |
2.4693 |
-.8455 |
3.1751 |
-3.3297 |
10 MVA |
|
|
9.8020 |
-2.5365 |
3.3244 |
-3.1397 |
8.1622 |
-2.3216 |
3.5587 |
-3.4661 |
40 MVA |
|
|
2.6449 |
0.6125 |
2.5075 |
-8.9108 |
2.0943 |
-0.2692 |
4.7655 |
-11.363 |
10 KVA |
Turn to turn short circuit 20% |
|
4.8942 |
1.0223 |
3.6817 |
-15.4559 |
3.3629 |
-0.3816 |
7.8993 |
-20.767 |
10 MVA |
|
|
4.6047 |
1.0238 |
3.8274 |
-14.8820 |
3.3532 |
-0.4005 |
7.7832 |
-19.5547 |
40 MVA |
|
|
2.00874 |
.464160 |
2.6979 |
-7.7241 |
2.01756 |
-0.3096 |
4.3083 |
-9.0678 |
10 KVA |
Turn to turn short -circuit 30% |
|
10.4947 |
-2.6358 |
3.2340 |
-2.8905 |
9. 2562 |
-2.5071 |
3.5027 |
-3.1600 |
10 MVA |
|
|
11.0088 |
-2.7003 |
3. 1355 |
-2.6196 |
10.5216 |
-2.7054 |
3.4397 |
-2.8445 |
40 MVA |
|
Table 5. The change of Statistical parameters of the HV winding faults of the10 kVA&10 MVA&40 MVA transformer for turn-to-turn SC fault
|
The change of Region 2 |
The change of Region 1 |
rating |
Faults type |
||||||
|
KURT |
SKEW |
SD |
Mean |
KURT |
SKEW |
SD |
Mean |
||
|
-0.13% |
-3.33% |
4.40% |
1.79% |
3.72% |
3.84% |
2.03% |
3.80% |
10 KVA |
Turn to turn short circuit 10% |
|
-0.29375% |
-0.7625% |
17.075% |
11.00625% |
1.03125% |
1.625% |
17.9% |
9.94375% |
10 MVA |
|
|
-0.01% |
-0.21% |
16.06% |
9.30% |
0.31% |
-0.30% |
15.59% |
9.22% |
40 MVA |
|
|
-0.39% |
9.55% |
6.24% |
3.85% |
7.88% |
8.25% |
4.36% |
8.03% |
10 KVA |
Turn to turn short -circuit 20% |
|
-1.2411% |
30.2117% |
20.1176% |
1.1470% |
10.505% |
1.564% |
30.8647% |
18.8882% |
10 MVA |
|
|
-0.27% |
-0.74% |
31.19% |
18.74% |
-0.02% |
-0.02% |
31.29% |
18.60% |
40 MVA |
|
|
-6.27% |
2.60% |
7.82% |
6.33% |
12.57% |
13.36% |
7.07% |
12.81% |
10 KVA |
Turn to turn short -circuit 30% |
|
-1.992% |
42.834% |
31.02% |
1.35% |
18.312% |
2.04% |
43.338% |
29.166% |
10 MVA |
|
|
-1.03% |
-1.97% |
45.18% |
28.33% |
-0.66% |
0.67% |
45.88% |
28.14% |
40 MVA |
|
|
The change of Region 4 |
The change of Region 3 |
rating |
Faults type |
||||||
|
KURT |
SKEW |
SD |
Mean |
KURT |
SKEW |
SD |
Mean |
||
|
6.88% |
-1.21% |
-4.68% |
2.96% |
0.14% |
-1.75% |
1.25% |
4.87% |
10 KVA |
Turn to turn short circuit 10% |
|
4% |
-7.91875% |
2.6375% |
6.68125% |
-9.2625% |
-8.3875% |
3.325% |
7.8625% |
10 MVA |
|
|
-7.00% |
-3.51% |
2.90% |
6.90% |
9.14% |
-5.56% |
2.44% |
8.00% |
40 MVA |
|
|
12.73% |
-1.44% |
-9.24% |
6.15% |
0.36% |
-5.16% |
2.53% |
9.89% |
10 KVA |
Turn to turn short -circuit 20% |
|
-22.147% |
-17.852% |
5.082% |
13.247% |
-19.9882% |
-18.2117% |
5.952% |
15.076% |
10 MVA |
|
|
14.56% |
-7.57% |
5.54% |
14.29% |
23.77% |
-13.99% |
3.97% |
16.12% |
40 MVA |
|
|
17.89% |
-1.59% |
-13.56% |
9.63% |
0.65% |
-10.35% |
3.97% |
15.15% |
10 KVA |
Turn to turn short -circuit 30% |
|
-39.504% |
-29.88% |
10.44% |
22.35% |
-38.118% |
-32.712% |
9.948% |
24.21% |
10 MVA |
|
|
20.17% |
-10.20% |
8.42% |
22.32% |
40.69% |
-23.01% |
5.70% |
24.50% |
40 MVA |
|
Table 6. The change of Statistical parameters of the HV winding faults of the 10 kVA&10 MVA&40MVA transformer for HV-LV SC fault
|
The change of Region 2 |
The change of Region 1 |
rating |
Faults type |
||||||
|
KURT |
SKEW |
SD |
Mean |
KURT |
SKEW |
SD |
Mean |
||
|
0.05% |
-23.97% |
-1.65% |
0.09% |
0.17% |
0.25% |
-0.14% |
-0.07% |
10 KVA |
HV-LV SC at 2nd node |
|
-0.11% |
-0.16% |
-0.15% |
-0.01% |
-0.01% |
-0.01% |
-0.13% |
0.00% |
10 MVA |
|
|
0.03% |
0.03% |
-1.10% |
-0.01% |
-0.10% |
-0.02% |
-1.01% |
0.00.% |
40 MVA |
|
|
-0.06% |
-0.08% |
0.07% |
0.00% |
0.01% |
0.01% |
0.09% |
0.00% |
10 KVA |
HV-LV SC at 4nd node |
|
12.54% |
-16.03% |
32.76% |
-3.13% |
-0.20% |
-0.30% |
0.16% |
-0.12% |
10 MVA |
|
|
-0.07% |
-0.10% |
0.64% |
0.01% |
0.09% |
-0.02% |
0.73% |
0.00% |
40 MVA |
|
|
The change of Region 4 |
The change of Region 3 |
rating |
Faults type |
||||||
|
KURT |
SKEW |
SD |
Mean |
KURT |
SKEW |
SD |
Mean |
||
|
-1.43% |
-38.66% |
-6.98% |
-4.80% |
-1.31% |
58.58% |
7.45% |
2.92% |
10 KVA |
HV-LV SC at 2nd node |
|
-17.67% |
-0.61% |
-4.88% |
-18.46% |
-2.42% |
-2.71% |
-5.41% |
-2.73% |
10 MVA |
|
|
8.75% |
9.23% |
13.25% |
-0.82% |
-2.48% |
1.09% |
6.43% |
1.86% |
40 MVA |
|
|
-10.26% |
-11.47% |
-2.37% |
-24.18% |
-8.65% |
-8.03% |
-5.67% |
-2.53% |
10 KVA |
HV-LV SC at 4nd node |
|
-3.25% |
-31.22% |
-3.66% |
-10.43% |
-3.57% |
2.13% |
1.39% |
-4.31% |
10 MVA |
|
|
2.30% |
-6.56% |
-2.97% |
-12.99% |
-3.47% |
-0.92% |
1.29% |
0.44% |
40 MVA |
|
Table 7. The change of Statistical parameters of the HV winding faults of the 10 kVA & 10 MVA & 40 MVA transformer for open circuit fault
|
The change of Region 2 |
The change of Region 1 |
Rating |
Open circuit |
||||||
|
KURT |
SKEW |
SD |
Mean |
KURT |
SKEW |
SD |
Mean |
||
|
-17.41% |
198.09% |
-26.16% |
-5.00% |
-36.05% |
-230.81% |
-38.72% |
-123.32% |
10 KVA |
|
|
-25.87% |
-31.82% |
-5533.60% |
-9026.92% |
-138.67% |
-154.39% |
-1035391.53% |
-12491.20% |
10 MVA |
|
|
-25.86% |
-30.29% |
-3651.84% |
-3862.72% |
-148.10% |
-163.64% |
-7122889.94% |
-5380.09% |
40 MVA |
|
|
The change of Region 4 |
The change of Region 3 |
Rating |
Open circuit |
||||||
|
KURT |
SKEW |
SD |
Mean |
KURT |
SKEW |
SD |
Mean |
||
|
2.90% |
1.12% |
1.42% |
-0.08% |
1.15% |
0.68% |
0.90% |
-0.21% |
10 KVA |
|
|
48.56% |
98.25% |
-80.26% |
-785.44% |
-38.66% |
141.50% |
113.50% |
-1045.04% |
10 MVA |
|
|
69.71% |
74.94% |
-94.24% |
-474.94% |
49.84% |
115.77% |
-158.60% |
-868.81% |
40 MVA |
|
Table 8. The change of Statistical parameters of the HV winding faults of the 10 kVA &10 MVA & 40 MVA transformer for HV-ground SC fault
|
The change of Region 2 |
The change of Region 1 |
Rating |
Types of fault |
||||||
|
KURT |
SKEW |
SD |
Mean |
KURT |
SKEW |
SD |
Mean |
||
|
4.765% |
0.301% |
6.0371% |
-88.7139% |
6.8253% |
-2.2003% |
16.0026% |
-113.7072% |
10 KVA |
HV-Ground SC at 2nd node |
|
-15.25% |
-15.25% |
-21.57% |
-111158.31% |
-11432.00% |
-130.15% |
-144.00% |
-108258.82% |
10 MVA |
|
|
-1.34% |
21.47% |
-75604.01% |
-6344.00% |
-140.22% |
154.72% |
-7170709.37% |
-8547.17% |
40 MVA |
|
|
-9.09% |
-4.95% |
10048.58% |
-11680.81% |
-134.55% |
-148.88% |
-1066522.16% |
-16399.27% |
10 KVA |
HV-Ground SC at 4nd node |
|
4.3451% |
0.1104% |
5.9894% |
-81.9894% |
6.9765% |
-2.2441% |
16.7906% |
-106.6370% |
10 MVA |
|
|
The change of Region 4 |
The change of Region 3 |
Rating |
Types of fault |
||||||
|
KURT |
SKEW |
SD |
Mean |
KURT |
SKEW |
SD |
Mean |
||
|
5.4582% |
1.2069% |
5.1172% |
-64.7123% |
4.480% |
0.7985% |
6.6938% |
-66.9232% |
10 KVA |
HV-Ground SC at 2nd node |
|
-46.85% |
-99.90% |
-106.48% |
-950.76% |
-22.54% |
83.77% |
-119.75% |
-1274.09% |
10 MVA |
|
|
69.00% |
-20.48% |
-175.62% |
-1137.80% |
-42.60% |
69.83% |
-181.10% |
-1444.90% |
40 MVA |
|
|
38.60% |
110.99% |
-104.46% |
-922.46% |
3.17% |
62.25% |
-163.46% |
-1250.73% |
10 KVA |
HV-Ground SC at 4nd node |
|
9.3206% |
1.8104% |
4.0637% |
-55.2053% |
4.720% |
0.6341% |
6.7286% |
-58.4889% |
10 MVA |
|
|
-69.00% |
-120.48% |
-175.62% |
-1137.0% |
-42.60% |
69.83% |
181.10% |
-1444.90% |
40 MVA |
|
Table 9. The change of Statistical parameters of the HV winding faults of the 10 kVA &10 MVA & 40 MVA transformer for disc space variation fault
|
The change of Region 2 |
The change of Region 1 |
Rating |
Types of fault |
||||||
|
KURT |
SKEW |
SD |
Mean |
KURT |
SKEW |
SD |
Mean |
||
|
-5.96% |
33.85% |
-2.21% |
-0.93% |
-1.07% |
-1.05% |
-0.68% |
-1.09% |
10 KVA |
Axial disc space variation 2nd disc 30% |
|
0.16% |
0.40% |
-9.92% |
-1.08% |
-1.00% |
-1.49% |
-10.76% |
-0.01% |
10 MVA |
|
|
0.01% |
0.08% |
-6.15% |
-0.07% |
-0.12% |
0.06% |
-6.08% |
0.00% |
40 MVA |
|
|
3.77% |
75.61% |
-2.57% |
-0.55% |
-2.10% |
-2.06% |
-1.35% |
-2.15% |
10 KVA |
Axial disc space variation 2nd disc 60% |
|
-0.33% |
0.86% |
-20.24% |
-2.21% |
-2.18% |
-3.37% |
-22.20% |
-0.02% |
10 MVA |
|
|
-0.01% |
0.09% |
-12.51% |
-0.14% |
-0.21% |
-0.22% |
-12.23% |
0.00% |
40 MVA |
|
|
The change of Region 4 |
The change of Region 3 |
Rating |
Types of fault |
||||||
|
KURT |
SKEW |
SD |
Mean |
KURT |
SKEW |
SD |
Mean |
||
|
-20.59% |
-22.73% |
12.49% |
11.78% |
-1.34% |
-50.22% |
-4.37% |
5.75% |
10 KVA |
Axial disc space variation 2nd disc 30% |
|
1.68% |
2.37% |
-1.94% |
-3.33% |
2.98% |
3.27% |
-2.05% |
-3.45% |
10 MVA |
|
|
4.20% |
2.65% |
-0.31% |
-1.20% |
5.60% |
3.29% |
-0.30% |
-1.45% |
40 MVA |
|
|
-18.70% |
-22.99% |
11.69% |
11.98% |
-1.35% |
-47.65% |
-4.01% |
6.23% |
10 KVA |
Axial disc space variation 2nd disc 60% |
|
3.65% |
4.60% |
-3.91% |
-6.64% |
3.78% |
4.97% |
-4.48% |
-6.97% |
10 MVA |
|
|
3.39% |
2.66% |
-2.37% |
-2.67% |
7.74% |
4.62% |
-2.03% |
-3.35% |
40 MVA |
|
The impact of transformer rating on fault diagnosis using SFRA is studied. The impact of the transformer VA rating on statistical parameters and fault diagnosis classification methods is also discussed. The SFRA test is simulated for three different transformers; 10 kVA, 10 MVA and 40 MVA cases. Generally, the SFRA test is used to determine the fault type of power transformer based on the statistical parameters calculated from the SFRA response over the specified frequency zones.
Results show the most of parameters for 10 MVA and 40 MVA are nearly the same at all fault conditions however the parameters of 10 kVA are widely deviated from those of 10 MVA case.
Hence the fault diagnosis techniques based SFRA test are robust and the least of statistical parameters are affected by the medium change in VA rating however for wide variation of VA rating the fault diagnosis techniques of transformer may need compensation in some parameters.
In future the statistical parameters of SFRA test could compensated and correction factors may be estimated based artificial intelligence techniques to maintain better matching accuracy of the transformer fault diagnosis algorithm regardless to the VA Rating.
[1] Senobari, R.K., Sadeh, J., Borsi, H. (2018). Frequency response analysis (FRA) of transformers as a tool for fault detection and location: A review. Electric Power Systems Research, 155: 172-183. https://doi.org/10.1016/j.epsr.2017.10.014
[2] Korenciak, D., Gutten, M. (2020). Fault diagnostics of transformer winding in time and frequency domain. Diagnostyka, 21(3): 49-54. https://doi.org/10.29354/diag/125310
[3] Raedler, M., Uhrig, S., Velasquez Contreras, J.L. (2017). Electrical interferences in SFRA measurements. Transformers Magazine, 4(2): 60-70.
[4] Alsuhaibani, S., Khan, Y., Beroual, A., Malik, N.H. (2016). A review of frequency response analysis methods for power transformer diagnostics. Energies, 9(11): 879. https://doi.org/10.3390/en9110879
[5] Radler, M., Uhrig, S., Velasquez, J. (2017). Electrical interferences in SFRA measurements–How to overcome undesirable effects. OMICRON electronics GmbH.
[6] Chaouche, M.S., Moulahoum, S., Houassine, H. (2018). Low and high frequency model of three phase transformer by frequency response analysis measurement. Open Physics, 16(1): 117-122. https://doi.org/10.1515/phys-2018-0019
[7] Abu-Siada, A., Mosaad, M.I., Kim, D., El-Naggar, M.F. (2019). Estimating power transformer high frequency model parameters using frequency response analysis. IEEE Transactions on Power Delivery, 35(3): 1267-1277. https://doi.org/10.1109/TPWRD.2019.2938020
[8] Lou, J., Bhobe, A., Shu, Y., Yu, J. (2018). Analytical calculation of transformer parameters by S-parameters. 2018 IEEE International Symposium on Electromagnetic Compatibility and 2018 IEEE Asia-Pacific Symposium on Electromagnetic Compatibility (EMC/APEMC), Suntec City, Singapore, pp. 1310-1313. https://doi.org/10.1109/ISEMC.2018.8394001
[9] Yoon, Y., Son, Y., Cho, J., Jang, S., Kim, Y.G., Choi, S. (2021). High-frequency modeling of a three-winding power transformer using sweep frequency response analysis. Energies, 14(13): 4009. https://doi.org/10.3390/en14134009
[10] Shaban, A.E., Ibrahim, K.H., Barakat, T.M. (2019). Modeling, simulation and classification of power transformer faults based on FRA test. 2019 21st International Middle East Power Systems Conference (MEPCON), Cairo, Egypt, pp. 908-913. https://doi.org/10.1109/MEPCON47431.2019.9007984
[11] Aljohani, O., Abu-Siada, A. (2016). Application of digital image processing to detect short-circuit turns in power transformers using frequency response analysis. IEEE Transactions on Industrial Informatics, 12(6): 2062-2073. https://doi.org/10.1109/TII.2016.2594773
[12] Montgomery, D.C., Runger, G.C. (2018). Applied statistics and probability for engineers (p. 720). Hoboken, NJ: Wiley.
[13] Xue, D., Chen, Y. (2018). Scientific Computing with MATLAB®. Chapman and Hall/CRC.