Yadong Sun* | Shirong Ru
© 2022 IIETA. This article is published by IIETA and is licensed under the CC BY 4.0 license (http://creativecommons.org/licenses/by/4.0/).
OPEN ACCESS
Most reservoirs built in earlier years in China generally have major safety issues and leakage is a common problem with them. Nowadays as the technology of Non-Destructive Testing (NDT) has developed and matured greatly, it has been widely used in detecting internal seepage channels, voids, cracks of the dam body and is showing obvious advantages in these aspects. This paper employed a method integrating geological radar (geo-radar) with ultrasonic detection to conduct safety test on the dam body of the Xidachuan Reservoir located in the Linjiang City of Jilin Province of China. The NDT discovered main leakage risk positions of the dam, gave a safety evaluation of the dam body, and proposed targeted treatment measures. NDT can quickly and accurately inspect the quality problems with the dam without causing damages to the structure and it can provide reliable guarantees for the quality of dam projects.
non-destructive testing (NDT), geological radar (geo-radar), ultrasonic detection, quality inspection
For any country in the world, water conservancy projects are a key link in the national infrastructure construction, and the building of dams is an important part of it. The quality of dams is closely related to national economy; however, the quality problem is a common issue for many dam projects during the construction process, therefore relevant tests are needed to find and solve the potential quality problems. NDT is a technology that can complete the testing jobs without damaging the structure and it is a reliable means of quality assurance, therefore performing NDT on water conservancy projects is no doubt a meaningful and crucial work. Now in China, during the quality inspection process of water conservancy projects, it’s found after numerous comparisons between NDT and the conventional testing methods that the NDT has important roles and advantages in water conservancy engineering.
The geo-radar non-destructive testing (GNDT) is now a common testing method that has received wide attention in academic circle and engineering application. There’re a bunch of studies on the influencing factors of its usage since the last century. For instance, in 1933, scholar Smith-Rose [1] introduced an experimental method for measuring the electrical parameters of soil, and finally discovered an important law that when the conductivity increases, the dielectric constant decreases accordingly. As science and technology are developing and their applications in the human society have proposed various requirements, in 1933, Scholar Wensink [2] found in an experiment when measuring a variety of media under different frequencies that when the frequency was higher than 25MHz, the dielectric constant rose with the increase of water content; but when the water reached the critical value, the experimental result was the opposite; when the frequency was higher than 1GHz, the dielectric constant was only related to salinity, and as the frequency dropped to 1MHz, the correlation became more significant. After that, based on the research findings of previous scholars, Sternberg and Levitskaya [3] when applying Ground Penetrating Radar (GPR) to assess the moisture content of building materials, dif- ferent medium properties, dimensions, interfaces and other unknown influences may require specific strategies to achieve useful results [4]. Ground-penetrating radar (GPR) has been widely used in the condition assessment of reinforced concrete structures and it provides completely non-destructive results in real-time [5]. Various geological disasters can easily occur in tunnels that pass through a limestone stratum [6]. The GPR data were displaced using 3D imaging to define the horizontal and vertical extent of the pipe [7]. Picking rebars manually in the data from ground penetrating radar (GPR) surveys of concrete bridge decks is time consuming and labor intensive [8]. The occurrence of two ground collapses affecting a busy street, linked to ill-filled cellars, motivated this survey [9]. Examples of the application of microgravity method for the detection of potentially hazardous (empty) underground cavities caused by the collapse of coal mines are presented [10]. The deep-seated landslide near the Nanheng town, located in eastern China, is exhibited by the limestone at its bottom [11]. In civil engineering, roadway structure evaluation is an important application which can be carried out by ground penetrating radar [12]. Three-dimensional ground penetrating radar data are often ambiguous and complex to interpret when attempting to detect only underground cavities because ground penetrating radar reflections from various underground objects can appear like those from cavities [13]. Ground-penetrating radar is a typical sensor system for analyzing underground facilities such as pipelines and rebars [14]. Groundpenetrating radar (GPR) has potential to accurately image the subterranean profile [15]. Periodic interference is one of the most common interference sources in tunnel seismic prediction (TSP) [16]. In Brazil, the public lighting sector is a responsibility of the municipal government and typically represents around 4% of the electricity consumed by cities [17]. Convolutional neural networks (CNNs) have achieved remarkable success in various computer vision tasks, which are extremely powerful to deal withmassive training data by using tens of millions of parameters [18]. The success of deep learning in computer vision is based on the availability of large annotated datasets [19]. Vehicle-borne GPR method has become the main railway subgrade detection technology with its advantages of rapidness and nondestructiveness [20].
Measured media such as rock, asphalt, and concrete, and finally determined that there’s a close relationship between the selection of the center frequency of geo-radar and the electrical parameters of the measured medium. In recent years, some researchers also studied the electrical parameters of various materials made of mixed media.
Xidachuan Reservoir is located in the lower reaches of Heixiaozigou Stream in the south of Xidachuan Village, Huashu Town, Linjiang City, Jilin Province. The target reservoir is about 4.5 km to the south of the Huashu Town, and about 1.2 km away from the Provincial Highway 204, and it’s built across the Xigouli River, a branch of Shitouhe River, which is one of the largest tributaries of the Songhuajiang River. The dam site is located at 125.30 degrees east longitude and 43.88 degrees north latitude. The designed flood level of the reservoir area is 810.99 m, the checked flood level is 811.41 m, the total storage capacity of the reservoir is 318,800 m3, and the controlled basin area of the upper stream of the dam site is 13.3 km2, the target reservoir is a small-scaled one. According to the actual conditions of the dam project, a method integrating geo-radar and ultrasonic detection was adopted to carry out NDT on the dam body, analyze the main leakage risk positions, give safety evaluation, and propose targeted treatment measures.
2.1 Principle of geo-radar
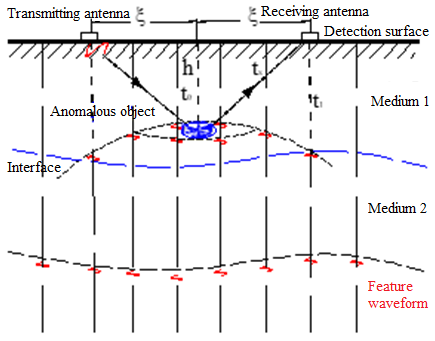
Figure 1. A schematic diagram of the detection principle of geo-radar
Geo-radar is a geophysical exploration technology often applied in engineering practice based on the electrical difference of underground media, it transmits high-frequency electromagnetic waves to the subsurface, and then receives the electromagnetic waves reflected by underground media for processing, analysis, and interpretation. When the wave speeds of the underground media are known, the position and burial depth of the target object can be determined according to the measured travel time (see Figure 1 for detection principle). Then, according to the waveform and intensity of the reflected wave group, the features of the underground media and their underground structure could be studied via event tracking, then the geological meaning of the reflected wave group could be determined, and the distribution of the target object on the site could be understood through the detection of multiple survey lines.
In this study, the model Python-3 geo-radar produced by Latvian company and 100MHz antenna were adopted in the detection. This radar model has a few merits including lightweight, highly automated, steady signal, fast detection speed, and high resolution, etc., it can connect to antennas with various frequencies, display the detected profile in real time, and perform data post-processing and interpretation on the computer workstation; moreover, it integrates data collection and processing, and gives color images.
2.2 Principle of ultrasonic detection
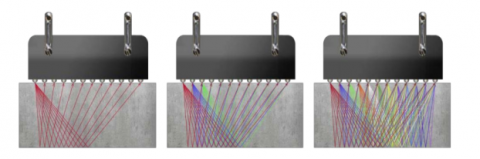
In this study, the model A1040 MIRA concrete ultrasonic fault detector was used. The instrument applied a combined detection method integrating Synthetic Aperture Focusing Technique (SAFT) with the array ultrasonic detection to realize focusing on each point in the half space (see Figure 2). Through the measurement of the antenna array of the tomography scanner, the collected information was converted into data array and finally turned into cross-sectional views of the object being detected, and the different reflection intensities were shown in different colors (colors are determined by the selected color palette). The probe consists of a 4×12 dry-point transducer array and a control unit. The transducer is a signal transmitting and receiving device that can transmit periodic pulses within the 25-85 kHz frequency range. The control unit in the probe can activate one row of transducers as signal transmitting terminals and the other rows of transducers can act as signal receiving terminals. As shown in Figure 3, transducers in the first row emit signals, and the others receive signals. Thereafter, transducers in the next row emit signals, and the transducers to their right receive signals. This process is repeated in cycles until all transducers in the first 11 rows have transmitted and received signals.
The model A1040 MIRA concrete ultrasonic tomography detector can completely automatically perform tomography processing on the collected data. The measurement unit consists of an antenna matrix containing 48 low-frequency broadband transducers (12 rows, 4 in each row) that transmit shear waves in a dry-point contact manner. The transducer probe is wrapped by abrasion-resistant ceramics; thus, it can work on rough surfaces for a long time. Each transducer is equipped with a separate spring suspension so that it can perform detection jobs on unsmooth surfaces. Because the antenna array consists of dry-point contact sensors, so the testing can be performed without liquid coupling. The main frequency of the antenna is 50 kHz.
Figure 2. The signal array and the focusing process
Figure 3. The defect speculation method
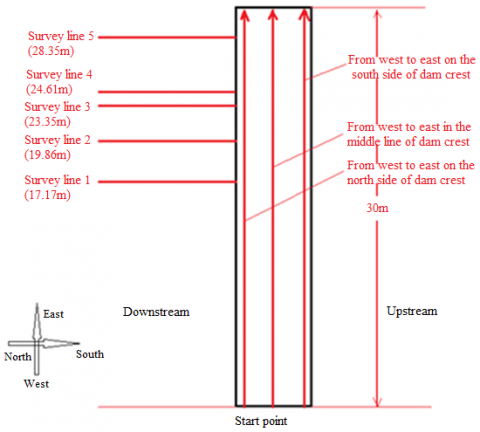
Figure 4. Layout of geo-radar survey lines
According to the requirements of the detection task and the actual conditions, geo-radar and ultrasonic detection were adopted as the NDT method, model Python-3 geo-radar, 100MHz antenna, and model A1040 MIRA concrete ultrasonic fault detector were used in the detection task. In order to get the features of the seepage channels of the dam body, geo-radar survey lines were arranged shaped like a tic-tack-toe, three survey lines were set along the dam crest direction, and five survey lines were set on the surface of the slope opposite to the incoming-water (the downstream face), and the total length of the survey lines was about 120 meters. The survey lines were numbered as dam crest 1, dam crest 2, dam crest 3, vertical 1, vertical 2, vertical 3, vertical 4 and vertical 5, respectively. Their positions are shown in Figure 4.
For leakage points on the downstream face of the dam, the array ultrasonic detection method was adopted to detect the distribution law of seepage channels near the water leakage points. Two ultrasound detector areas were set, containing a total of 68 survey points, and the positions of the survey areas are shown in Figure 5.
Figure 5. Layout of survey points of the ultrasonic detection method
4.1 Analysis of geo-radar detection results
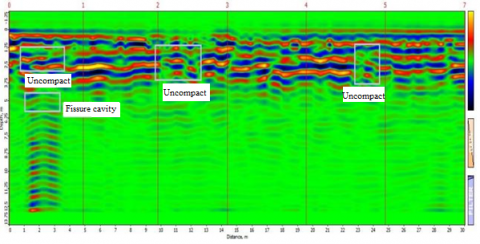
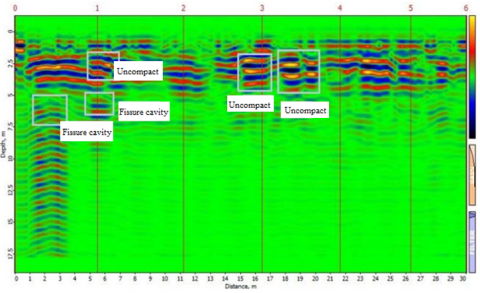
Figure 6. Waveform map of survey lines on south side of dam crest (from west to east)
Figure 7. Waveform map of survey lines in the middle line of dam crest (from west to east)
Figure 8. Waveform map of survey lines on north side of dam crest (from west to east)
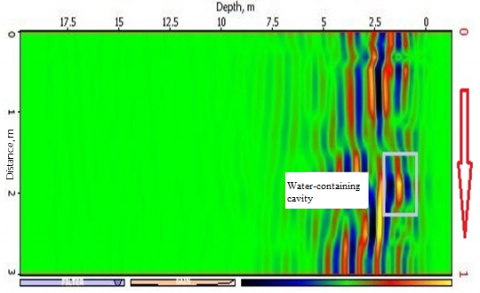
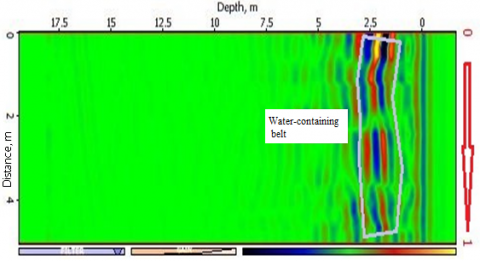
Figure 9. Waveform map of vertical survey line 1
Figure 10. Waveform map of vertical survey line 2
Figure 11. Waveform map of vertical survey line 3
Figure 12. Waveform map of vertical survey line 4
Figure 13. Waveform map of vertical survey line 5
From the survey site, 3 radar waveform maps along the dam axis direction were collected, and 5 radar waveform maps vertical to the dam axis direction on the downstream face of the dam body were collected. After the collected original waveform maps were subjected to a series of processing steps including vertical bandpass filtering, start time shifting, background removal, linear gain, and smooth gain, etc., several waveform maps along the dam axis direction were attained, as shown in Figures 6-8; and the attained waveform maps of the vertical survey lines are shown in Figures 9-13.
As can be seen from Figures 6-8, the area within 1-4m on the east side of the dam (close to the spillway) shows the significant feature of high amplitude wave resistance, and it’s inferred that there’re obvious cavities in this area, judging from the depth distribution, on the downstream side of the dam, the cavity depth shows an increasing trend as it approaches the dam body (cavity depth of survey lines on the south side is 1.5-4 m, cavity depth of survey lines in the middle is 5-6m, cavity depth of survey lines on the north side is 5.5-7.5m), indicating that there’s a tilted seepage channel from the upstream face to the downstream face of the dam, therefore it’s suggested to grout to seal the channel within this area. In addition, there’re several uncompact areas in different parts of the dam, such as the areas 10-12m and 23-24m in southern survey lines, 8-11m, 13-15m and 23-27m in the middle survey lines, and 5-7m and 15-20m in northern survey lines, etc., and the other parts of the dam body are compact. The uncompact areas above-mentioned are concentrated between the depth range of 2-5m below the dam crest, analyzing based on the leakage positions of the survey lines on the north side, these two abnormal areas are leakage positions on the downstream face of the dam.
Because the slope of downstream face of the dam in the survey area is quite steep, the depth direction of vertical survey lines was close to the vertical direction of the inside of the dam body, from the layout of the vertical survey lines (Figure 4) we can see that, the vertical survey line 5 was very close to the spillway. According to Figure 13, within the 5-6m range of this survey line, there’s water concentrated in the cavities in the vertical direction of the dam, and this situation is consistent with the seepage channel near the spillway showing in the middle line of the dam crest. Moreover, according to Figures 10-12, there’s a lot of cavity water in the areas of the vertical survey lines 2-4, and the dam body in these areas is not compact, and these positions are basically in line with the uncompact areas shown in the waveform maps of these areas and the dam crest.
4.2 Analysis of ultrasonic detection results
4.2.1 Data interpretation of survey area 1
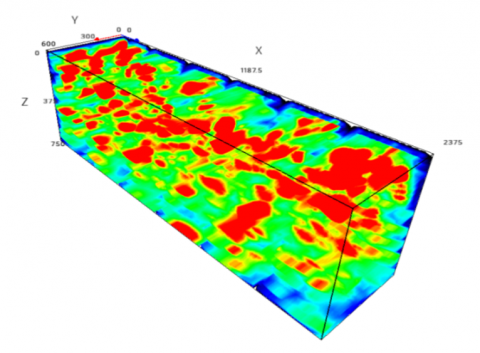
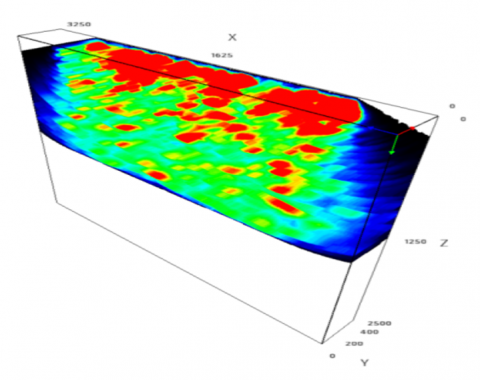
The data collected by the ultrasonic detector were imported into the software IntroView Concrete, after subjected to light projection rendering, color band adjustment, threshold setting, and gain setting, and other process steps, an 3D array image was generated, as shown in Figure 14.
The detection started from the 0 point of the 3D coordinate, survey points were set along the XY plane, and the detection depth direction was along the Z-axis direction. In the figure, the different colors represent different reflection intensities. The red color represents strong reflection in the area, suggesting that the object to be detected in this area is compact; the blue color represents weak reflection in the area, and there might be cavities or water-containing bodies in the area, or it might suggest that the surface of the object to be detected is not smooth (such as the right side of the above figure). In order to show diseases such as seepage and loose in the survey area, the above image was sliced along different directions.
For slices of different depths along the Y-axis, at 100 mm and 200 mm positions in the Y-axis direction, the waveform didn’t change much, suggesting the overall compactness is relatively good; then starting from the 300 mm position, strong reflection decreased obviously; at the 500 mm position, weak reflection area increased gradually, suggesting there might be an obvious seepage channel in this area, and the specific position is within the 1.5-1.8m range above the dam bottom of the survey area.
For slices of different depths along the Z-axis, the waveform differed significantly along the detection depth direction. At the depth of 200 mm (near the downstream face), although there’s a weak reflection area, the strong reflection area is larger; at 200-550mm depth, the weak reflection area increased but was not obvious; then starting from 550 mm, the weak reflection area increased significantly; at 730 mm, there’s almost no strong reflection area, suggesting water be may concentrated in this area. Comprehensive analysis shows that, the greater the depth in the Z-axis direction (closer to the upstream face), the more obvious the water seepage channel.
For slices of different depths along the X-axis, with the increase of distance in the X-axis direction (the detection direction moved to the spillway direction, so greater distance in the X-axis direction means closer to the spillway), the weak reflection area increased significantly. Within 700 mm in the X-axis direction, there’s no obvious change in the waveform; when it reached 1600 mm, the weak reflection area increased significantly, and there’re blue areas suggesting possible local leakage points; when the distance reached 2200 mm, weak reflection appeared in large area in the survey area, suggesting possible water concentration and potential leakage risks. Based on the above analysis, it’s concluded that in the X-axis direction in the survey area, the closer to the spillway, the greater the water content inside the dam body.
Figure 14. The processed 3D data image
4.2.2 Data interpretation of survey area 2
Figure 15. The processed 3D data image
The data were also imported into the software, and subjected to light projection rendering, color band adjustment, threshold setting, gain setting, and other processing, after that, the attained processed 3D image is shown in Figure 15.
The data processing method of survey area 2 was the same as that of survey area 1. As can be seen from the figures, there’s not much difference in the 3D images at different distances in the Y-axis direction, that is, within a height of 40mm of the survey area, there’s no difference in terms of the integrity of the dam body. In the Z-axis direction, along the detection depth direction, there’s no obvious waveform difference. At the 150mm depth, the waveform map shows a large strong reflection area; however, starting from 400-500 mm, the strong reflection area decreased significantly, and basically disappeared at 800 mm, but no obvious seepage channel was observed, so analysis suggests poor integrity of the damn body in this area, and there’s a possibility of loose or leakage. In the X-axis direction, there’s no obvious change in the waveform until the depth reached 2100 mm, it only shows a trend of an increase in the weak reflection area after 2600mm, and no obvious seepage channel is observed, indicating that in the survey area, there’s no obvious change in the homogeneity of the dam body, but in fringe of the survey area (in the direction away from the spillway), a relative loose feature is seen.
In this study, geo-radar and ultrasonic detection were integrated and adopted to perform NDT on the Xidachuan Reservoir in Linjiang City. Referring to known information of the study area, the collected data were processed and analyzed, the attained conclusions are:
(1) According to comprehensive interpretation results of geo-radar and ultrasonic detection, radar results show water-containing or water-concentrated waveform of the target dam body within the 1-4m range away from the spillway, and in the water-concentrated area, from the upstream face to the downstream face, the depth of water-concentrated cavities exhibits a law of increasing; the ultrasonic detection also shows an obvious seepage channel, which is the main leakage risk area, and it’s suggested to grout in this area to block the water.
(2) In the middle part of the dam body that is 2-5 m from the dam crest, the interpretation results of radar data collected from multiple positions are chaotic (mainly at positions 10-12m and 23-24m in southern survey lines, 8-11m, 13-15m and 23-27m in the middle survey lines, and 5-7m and 15-20m in northern survey lines), exhibiting as loose dam body, and ultrasonic detection also suggests poor integrity of the dam body. Comprehensive analysis suggests that the dam body in this area is loose, which may provide channels for the water seepage of the reservoir, and reinforcement treatment could be considered.
(3) The integrity of the dam body in areas that are farther away from the spillway is good, only the radar results of two survey lines display water-concentrated areas, it’s speculated that minor leakage may occur in the water-rich period and slight glazed ice may appear during winter.
[1] Smith-Rose, R.L. (1933). The electrical properties of soil for alternating currents at radio frequencies. Proceedings of the Royal Society of London. Series A, Containing Papers of a Mathematical and Physical Character, 140(841): 359-377. https://doi.org/10.1098/rspa.1933.0074
[2] Wensink, J.B. (2007). U.S. Patent No. 7,183,996. Washington, DC: U.S. Patent and Trademark Office.
[3] Sternberg, B.K., Levitskaya, T.M. (2001). Electrical parameters of soils in the frequency range from 1 kHz to 1 GHz, using lumped-circuit methods. Radio Science, 36(4): 709-719.
[4] Klewe, T., Strangfeld, C., Kruschwitz, S. (2021). Review of moisture measurements in civil engineering with ground penetrating radar-applied methods and signal features. Construction and Building Materials, 278: 122250. https://doi.org/10.1016/j.conbuildmat.2021.122250
[5] Tešić, K., Baričević, A., Serdar, M. (2021). Non-destructive corrosion inspection of reinforced concrete using ground-penetrating radar: A review. Materials, 14(4): 975. https://doi.org/10.3390/ma14040975
[6] Su, M., Zhao, Y., Xue, Y., Wang, P., Xia, T., Zhang, K., Li, C. (2021). Progressive fine integrated geophysical method for karst detection during subway construction. Pure and Applied Geophysics, 178(1): 91-106. https://doi.org/10.1007/s00024-020-02636-4
[7] Abueladas, A.R., Akawwi, E. (2020). Ground-penetrating radar inspection of subsurface historical structures at the baptism (El-Maghtas) site, Jordan. Geoscientific Instrumentation, Methods and Data Systems, 9(2): 491-497. https://doi.org/10.5194/gi-9-491-2020
[8] Dinh, K., Gucunski, N., Duong, T.H. (2018). An algorithm for automatic localization and detection of rebars from GPR data of concrete bridge decks. Automation in Construction, 89: 292-298. https://doi.org/10.1016/j.autcon.2018.02.017
[9] Jacob, T., Pannet, P., Beaubois, F., Baltassat, J.M., Hannion, Y. (2020). Cavity detection using microgravity in a highly urbanized setting: A case study from Reims, France. Journal of Applied Geophysics, 179: 104113. https://doi.org/10.1016/j.jappgeo.2020.104113
[10] Zahorec, P., Pašteka, R., Papčo, J., Putiška, R., Mojzeš, A., Kušnirák, D., Plakinger, M. (2021). Mapping hazardous cavities over collapsed coal mines: Case study experiences using the microgravity method. Near Surface Geophysics, 19(3): 353-364.
[11] Gan, J., Zhang, Y.X., Liu, X. (2020). An application of the high-density electrical resistivity method for detecting slide zones in deep-seated landslides in limestone areas. Journal of Applied Geophysics, 177: 104013. https://doi.org/10.1016/j.jappgeo.2020.104013
[12] Sun, M., Le Bastard, C., Pinel, N., Wang, Y., Li, J., Pan, J., Yu, Z. (2017). Estimation of time delay and interface roughness by GPR using modified MUSIC. Signal Processing, 132: 272-283. https://doi.org/10.1016/j.sigpro.2016.05.029
[13] Kang, M.S., Kim, N., Lee, J.J., An, Y.K. (2020). Deep learning-based automated underground cavity detection using three-dimensional ground penetrating radar. Structural Health Monitoring, 19(1): 173-185. https://doi.org/10.1177/1475921719838
[14] Khudoyarov, S., Kim, N., Lee, J.J. (2020). Three-dimensional convolutional neural network–based underground object classification using three-dimensional ground penetrating radar data. Structural Health Monitoring, 19(6): 1884-1893. https://doi.org/10.1177/1475921720902700
[15] Jin, Y., Duan, Y. (2020). A new method for abnormal underground rocks identification using ground penetrating radar. Measurement, 149: 106988. https://doi.org/10.1016/j.measurement.2019.106988
[16] Yue, Y., Jiang, T., Han, C., Wang, J., Chao, Y., Zhou, Q. (2019). Suppression of periodic interference during tunnel seismic predictions via the Hankel-SVD-ICA method. Journal of Applied Geophysics, 168: 107-117. https://doi.org/10.1016/j.jappgeo.2019.06.003
[17] Salvia, A.L., Brandli, L.L., Leal Filho, W., Kalil, R.M.L. (2019). An analysis of the applications of Analytic Hierarchy Process (AHP) for selection of energy efficiency practices in public lighting in a sample of Brazilian cities. Energy Policy, 132: 854-864. https://doi.org/10.1016/j.enpol.2019.06.021
[18] Lin, S., Ji, R., Chen, C., Tao, D., Luo, J. (2018). Holistic cnn compression via low-rank decomposition with knowledge transfer. IEEE Transactions on Pattern Analysis and Machine Intelligence, 41(12): 2889-2905. https://doi.org/10.1109/TPAMI.2018.2873305
[19] Abu Alhaija, H., Mustikovela, S.K., Mescheder, L., Geiger, A., Rother, C. (2018). Augmented reality meets computer vision: Efficient data generation for urban driving scenes. International Journal of Computer Vision, 126(9): 961-972. https://doi.org/10.1007/s11263-018-1070-x
[20] Xu, X., Lei, Y., Yang, F. (2018). Railway subgrade defect automatic recognition method based on improved faster R-CNN. Scientific Programming, 2018: 4832972. https://doi.org/10.1155/2018/4832972