Chinenye J. Anazoba* | Ishaq S. Eneji | Rufus Sha’Ato
OPEN ACCESS
The goal of this study is to assess the concentrations of selected heavy metals (Pb, Cd, As, Cr, Hg) in the water and fish of the artificial lakes in Heipang (Latitude 9o 41’ N and Longitude 8o 51’ E) and Rayfield (Latitude 9o 50’ N and Longitude 8o 55’ E). Two methods namely: Atomic Absorption Spectroscopy (AAS) and Energy Dispersive X-Ray Fluorescence Spectroscopy (EDXRF) were used to determine the level of heavy metals in Tilapia zilli from the lake at Heipang and Clarias gariepinus from the lake at Rayfield. Determination of heavy metals in water was carried using AAS. The result show that Pb, As and Hg were above the limit of Nigerian Standard for drinking water quality. Percentage composition of heavy metals in the fish organs were muscle 40.6 %, intestine 35.4 % and gills 20.0 for Tilapia zilli, while Clarias gariepinus contained muscle 39.8 %, gills 33.5 % and intestine 26.7 %. The study revealed the bioaccumulation factors of 339, 302, 20.0, 2.30 and 0.320 for Cr, Cd, As, Hg and Pb respectively in Clarias gariepinus. While Tilapia zilli had 142, 137, 1.70, 1.03 and 0.690 for Cr, Cd, As, Hg and Pb, respectively. This study concludes that the two lakes were contaminated with Pb.
lake, warter quality, heavy metal, bioaccumulation, toxic
Water is very important to life, making up about 70% of adult human body, with some lower and aquatic animals containing as high as 95 % to 98 % [1]. It is widely distributed throughout the ecosystem and its quality is an issue of great concern to scientists and policy makers. Lake water is part of the 3 % of global fresh water supply. Less than 1 % of the earth’s water resources are accessible to humans as fresh water, in the form of either surface or ground water [2]. Water quality is often an indicator of environmental quality because of the importance of water in sustaining human health and ecosystem [3].
On the Plateau in the Middle Belt of Nigeria, artificial lakes are a major source of municipal water supply and irrigation farming. Most of the lakes were inadvertently created as a result of mining activities during the colonial era. On the fields adjoining the lakes farming activities take place every year, which means leaching of agrochemicals into the lakes is expected. Illegal mining activities still take place around some of these locations leading to heavy metals contamination [4, 5], yet not much literature exist of the heavy metals status of these lakes [6]. Lakes are susceptible to anthropogenic contamination without manifesting obvious signs [7], except in situation of eutrophication. Unlike rivers they tend to accumulate more sediments as records of past changes in climate and environment [8]. Heavy metals are among the most toxic and persistent contaminants that accumulate in aquatic habitats and their concentration increases through biomagnification [9-10]. Industrial and agricultural activities located at the catchment area are the main sources of lake water pollution, in addition to natural sources [11]. Human activities have increased the level of metal ions in natural water system [12]. Sources such as mine drainage, industrial (paints, leather, textile, fertilizer, pharmaceuticals), domestic wastes and agricultural runoff have all contributed to increase metal load in natural water bodies, being ultimately incorporated into aquatic sediments [13]. In the aquatic environment the heavy metals bioaccumulate in aquatic organisms, migrate through the food chain to humans. They are found even in the biological systems of most people. Factors that determine their toxicity include chemical species, dose, and route of exposure; also, the nutritional status, genetics, age, and gender of exposed individuals [14]. Heavy metals with most carcinogenic effects are Cr, Ni, Pb, Cd, and As. Cr (VI), Ni and Cd; As and Cd are also teratogenic, while Pb has been reported to have neurological impairment and malfunctioning of the central nervous system [15].
Heavy metals occur naturally throughout the earth’s crust, however most environmental contamination and human exposure occur as a result of anthropogenic activities involving metal ores mining and processing operations, industrial production and use, and domestic and agricultural use of metals and metal-containing compounds [16]. Metal-based activities, such as, mining, foundries and smelters are most responsible for point source pollutions [17]. Other sources of heavy metal contamination include metal corrosion, atmospheric deposition, soil erosion of metal ions and leaching of heavy metals, sediment re-suspension and metal evaporation from water resources to soil and ground water [18]. As society continues to advance technologically, heavy metal contamination is likely to increase correspondingly.
The lake in Barkin Ladi Local Government Area is located at Heipang, around latitude 9o 41’ N and Longitude 8o 51’ E. By the side of the lake is a beneficiation plant involved in mineral processing, mainly size reduction of calcium carbonate, barite, Kaolin, sometimes graphite and other minerals. Wet and dry seasoning farming is carried around the lake, which is used for irrigation. Barkin Ladi Local Government Area has an area of 1,032 km2, and had a population of 175,267 according to the 2006 population census. The lake in Rayfield area of Jos South, located at around latitude 9o 25’ N and longitude 8o 54’ E, is used for recreation and industrial purposes. Of late mining activities have resumed around the lake area but runoffs from the mine are channelled away from the lake. Jos South has an area of 5,104 km2 and a population of 306,716, according to the 2006 census, but this must have doubled by now due to mass migration from the North East, which has been experiencing conflict.
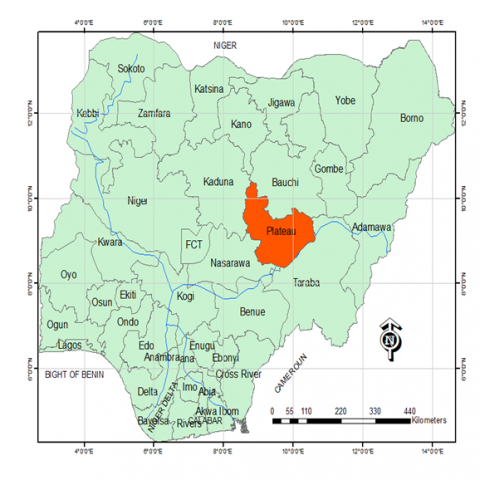
Figure 1. Map of Nigeria showing plateau state
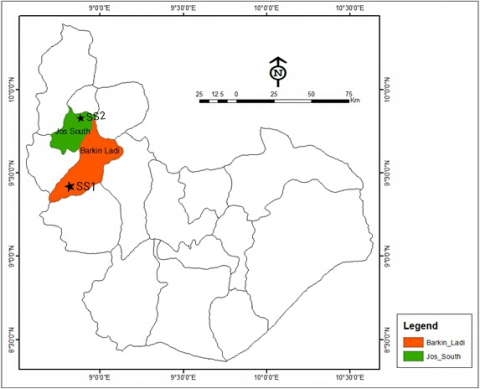
Figure 2. Map of Barkin Ladi (Heipang Lake) and Jos South (Rayfield) showing sampling stations
3.1 Sample collection
Samples were collected from each of the two lakes at Sampling Stations as shown on Figure 2. Heipang Lake was designated as sample station 1 coded SS1 while Rayfield Lake was designated as sample station 2 coded SS2. At each lake five samples were collected from the four corners of the lake – north, south, east, west and the middle, 10 – 20 cm below the water surface and pooled for a composite sample. Samples were collected with 500 mL glass bottles, acidified with conc. HNO3 and transferred into glass bottles with lids. The samples were then stored in icebox and transported to the laboratory and stored in freezer until analysis within 2 days.
Two matured fish samples of Tilapia zilli (average weight 83.34 ± 0.2 g and average length 16 ± 2 cm) were caught from the lake at Heipang, Barkin Ladi Local Government Area using a hook and line. They were transported home alive and stored in a freezer to maintain their freshness. The gills, intestines and muscles were dissected and the samples were oven-dried to a constant weight at 105 ℃. Separate samples (gills, intestine and muscles) were milled with mortar and pestle to fine sizes, then they were stored in labelled plastic containers in a desiccator. Two mature fish samples of Clarias gariepinus (average weight and average length) were equally caught from the Rayfield Resort Lake and prepared as described above. About 5.0 g of each of the samples were kept aside for an alternative method of analysis, Energy Dispersive X-RAY Fluorescence Spectrometry (ED XRFS).
3.2 Sample analysis
About 100 mL of acidified water sample was measured in a 250 mL conical flask. Exactly 5 mL of conc. HNO3 was added to the conical flask and covered with watch glass. The flask was heated on hot plate at 60 °C for 20 minutes until the solution appeared light colour, and then cooled to 45 °C. Flask and watch glass were rinsed with distilled water and filtered into a clean conical flask. And the filter was rinsed with 3 mL distilled water. Filtrate was transferred to a 100 mL volumetric flask, and the conical flask was rinsed with 5 mL distilled water into the volumetric flask. The sample was made up to 100 mL mark with distilled water, agitated to mix thoroughly and stored for analysis.
About 5 g of the milled sample was weighed into a round bottom flask and 10 mL conc. HNO3 and 2 mL HClO4 added. The sample was digested at 65 – 70 °C. The residue was filtered, dissolved and diluted with 0.2% (v/v) HNO3 to 20 mL. Digest were stored in pre-cleaned polyethylene bottles until AAS analysis.
3.2.1 Atomic absorption spectrometer
The heavy metal concentrations were determined using FS240AA Agilent Atomic Absorption Spectrometer. The standard was run for the working curves, followed by the blank to overcome instrument drift. After thoroughly mixing the sample by shaking, 100 mL of the sample was transferred into 250 ml beaker. The sample was aspirated into the machine equipped with mono-elemental hollow cathode lamps. The metal concentrations were read in ppm from the extracted standard calibration curve. The analyses were conducted in triplicate for each element and the average values calculated.
3.2.2 Energy disperse x-ray fluorescence spectrometer
After initial size reduction of samples as described above, the samples were further ground to a fine powder that passed through 250 mesh sieve. The samples were then dried in oven at 105 °C for 1 hour and cooled in a desiccator. The samples were then mixed with binder in the ratio of 5:1 (5.0 g sample to 1.0 g cellulose, w/w) and pelletized at a pressure of 10 – 15 tons/inch2 in a pelletizing machine. The ED XRFS machine was switched on and allowed to warm for 2 hours. Appropriate programmes for the various elements were employed to analyse the sample material.
The results of heavy metals concentration in fish tissues and water, and heavy metals bioaccumulation are presented in Table 1 below. Trend of heavy metal concentration is presented in Tables 2 and 3.
Table 1. Bioaccumulation factor of heavy metals in fish species in SS1 and SS2
|
Heavy Metal (ppm) |
Tilapia zilli |
SS1 H20 |
BF |
Clarias gariepinus |
SS2 H20 |
BF |
||||
|
Muscle |
Gills |
Intestine |
Muscle |
Gills |
Intestine |
|||||
|
Pb |
0.698 |
0.783 |
0.938 |
3.52 |
0.32 |
1.04 |
0.695 |
0.087 |
5.63 |
0.69 |
|
Cd |
0.098 |
0.098 |
0.077 |
0.00 |
302 |
0.091 |
0.105 |
0.412 |
0.002 |
137 |
|
As |
0.193 |
0.112 |
0.105 |
0.241 |
19.8 |
0.112 |
0.072 |
0.112 |
0.015 |
1.70 |
|
Cr |
0.162 |
0.142 |
0.122 |
0.003 |
339 |
0.122 |
0.145 |
0.142 |
0.001 |
142 |
|
Hg |
0.766 |
0.000 |
0.428 |
0.189 |
2.27 |
0.218 |
0.313 |
0.307 |
0.369 |
1.03 |
|
Lake |
Trend of Heavy Metals |
|
SS1Water |
Pb > As > Hg > Cr > Cd |
|
SS2 Water |
Pb > Hg > As > Cd > Cr |
Table 3. Trend of heavy metals in fish organs from SS1 and SS2
|
Fish Organ |
Trend of Heavy Metals |
|
SS1 Muscle |
Pb > As > Hg > Cr > Cd |
|
SS1 Gill |
Pb > Cr > As > Cd > Hg |
|
SS1 Intestine |
Pb > Hg > Cr > As > Cd |
|
SS2 Muscle |
Pb > Hg > Cr > As > Cd |
|
SS2 Gill |
Pb > Hg > Cr > Cd > As |
|
SS2 Intestine |
Cd > Hg> Cr > As > Pb |
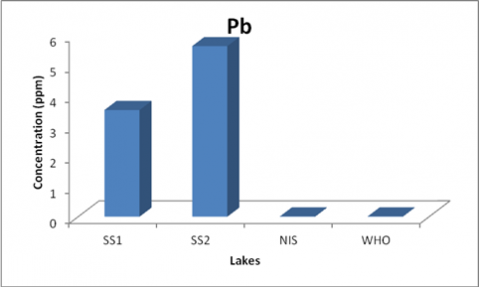
Figure 3. Concentration (ppm) of Pb in water samples using AAS
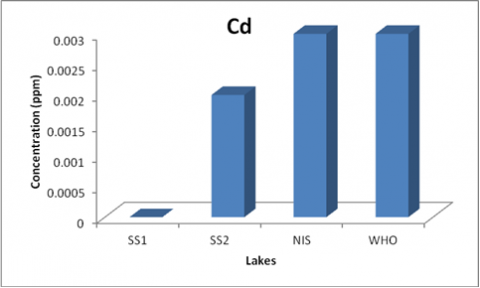
Figure 4. Concentration (ppm) of Cd in water samples using AAS
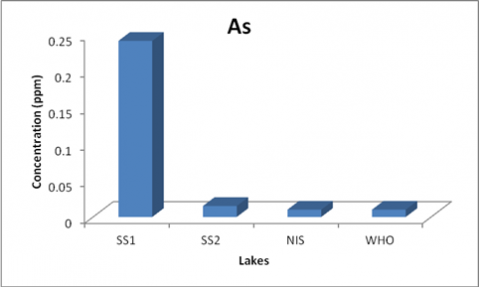
Figure 5. Concentration (ppm) of As in water samples using AAS
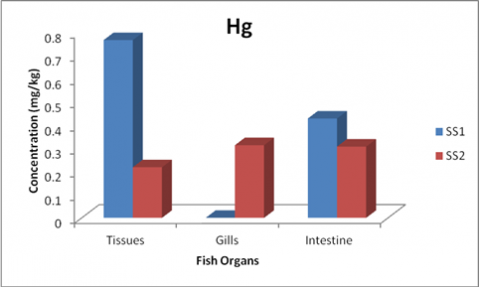
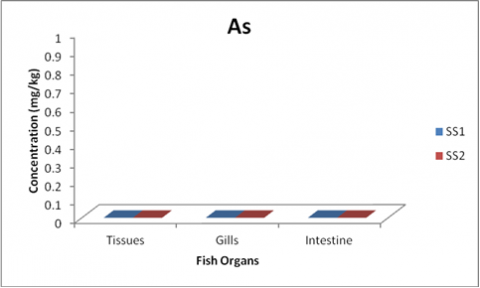
Quality (0.001 mg/L) and WHO (0.006 mg/L). The presence of Hg points to the likelihood of methylation. Difference in concentration of accumulated heavy metal in various fish organs was observed. According to [14], the level of accumulation in different organs of the fish is attributed to differences in physiological role of each organ, and factors such as regulatory ability, behaviour and feeding habits. The five metals (Pb, Cd, As, Cr and Hg) are some of the most toxic heavy metals. All these metals were detected in all the fish organs except the gills of Tilapia zilli, which showed no trace of Hg. Pb conc was highest in all the fish organs studied in both SS1 and SS2, which is consistent with Pb conc in water.
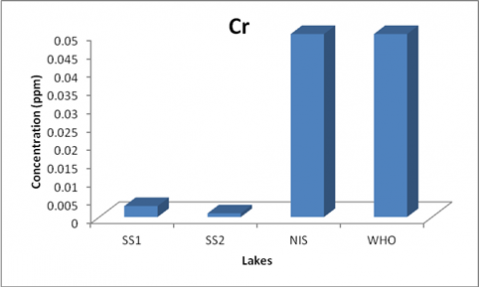
Figure 6. Concentration (ppm) of Cr in water samples using AAS
Figure 7. Concentration (ppm) of Hg in water samples using AAS
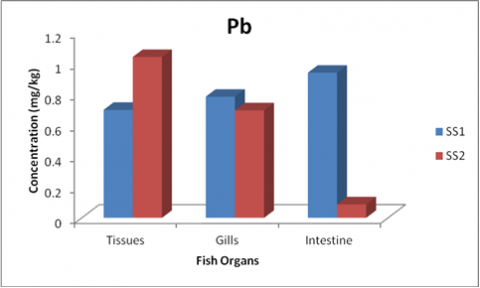
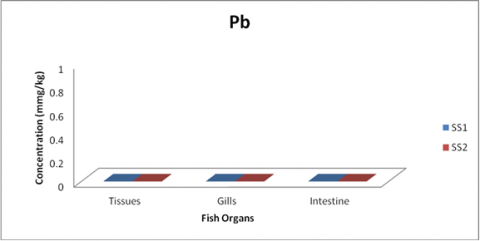
Figure 8. Concentration (mg/kg) of Pb in fish organs using AAS
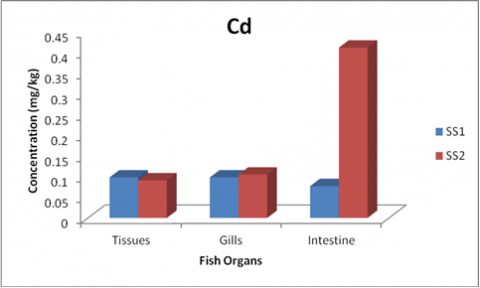
Figure 9. Concentration (mg/kg) of Cd in fish organs using AAS
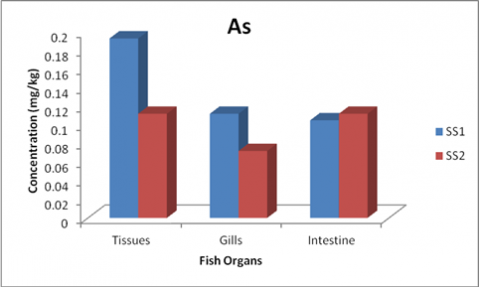
Figure 10. Concentration (mg/kg) of As in fish organs using AAS
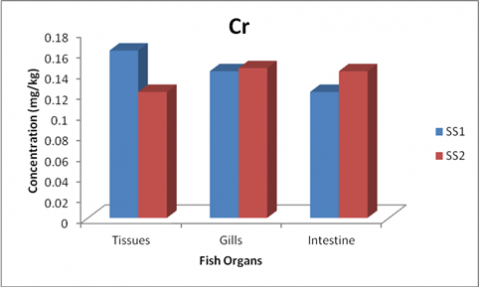
Figure 11. Concentration (mg/kg) of Cr in fish organs using AAS
Figure 12. Concentration (mg/kg) of Hg in fish organs using AAS
Figure 13. Concentration (mg/kg) of Pb in fish organs using XRFS
Figure 14. Concentration (mg/kg) of Cd in fish organs using XRFS
Figure 15. Concentration (mg/kg) of As in fish organs using XRFS
Figure 16. Concentration (mg/kg) of Cr in fish organs using XRFS
Figure 17. Concentration (mg/kg) of Hg in fish organs using XRFS
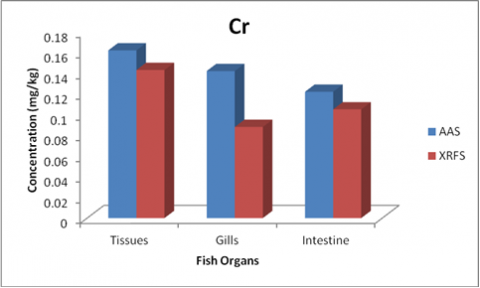
Figure 18. Concentration (mg/kg) of Cr in fish organs from SS1
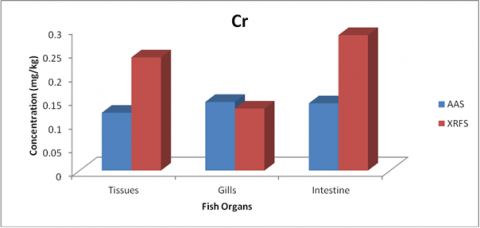
Figure 19. Concentration (mg/kg) of Cr in fish organs from SS2
Heavy metal concentration in the organs of Tilapia zilli from SS1 Lake showed consistent pattern of accumulation, with Pb as the most accumulated in the three organs: muscle - Pb > As > Hg > Cr > Cd, gills - Pb > Cr > As > Cd > Hg, intestine - Pb > Hg > Cr > As > Cd. The concentration of heavy metals in Clarias gariepinus from SS2 was similar to SS1 except for the intestine, which showed the concentration of Cd to be highest and concentration of Pb lowest. The concentrations of heavy metals in the fish organs were found to be consistent with the concentrations in the waters except for concentration of Cd in in intestine of Clarias gariepinus and SS2 water. The highest bioaccumulation factor of 339 for Cr was reported for Clarias gariepinus from SS2. Cd showed the next highest bioaccumulation factor of 301.5, while Pb had the least bioaccumulation factor, even though Pb concentration in both water and fish was the highest. In SS1 the heavy metal with highest BAF was Cr (142) in Tilapia zilli and Pb was similarly the least at 0.687. Like in SS2, BAF of Cd was second highest. However the fish species from both lakes were different. The results from the two sampling stations (with Cr having the highest BAF) are consistent with what has been reported for a study at River Benue [19]. However, the concentrations of Pb and as in the muscle reported in this work was at variance with the findings of [20], who found heavy metal concentrations lowest in the muscle in Lake Geriyo, Adamawa State, Nigeria.
Cr and Cd were observed to be within acceptable limits set by WHO and Nigerian Standard for Drinking Water Quality, while Pb, As and Hg were much higher than the recommended limits. The levels of Pb in SS1 (3.52 mg/kg) and SS2 (5.63 mg/kg) indicate active contamination of the lakes, which might be due to illegal mining activities within the areas. Two methods were used to determine the levels of bioaccumulation of heavy metal in the fish sample – Atomic Absorption Spectrometry (AAS) and Energy Dispersive X-Ray Fluorescence Spectrometry (ED XRFS). The AAS proved to be a better method than ED XRFS in the determination of heavy metals in the tissues of fish because it detected trace amounts in samples that ED XRFS could not. In both SS1 and SS2 the concentrations of Cd, As, Cr and Hg in the fish were higher than the concentrations in the water medium. Concentrations of Pb in the two lakes were higher in the water than in the fish. However, Pb concentration in the fish was still higher than the other elements, which means that Pb is the highest contaminant in the two lakes. Based on the procedures described in 3.2.1 and 3.2.2, AAS technique was a better method of determining heavy metals in the fish samples than XRFS. Thus, this study concludes that there was heavy metal contamination of the two lakes, Tilapia zilli and Clarias gariepinus are good bio-indicators for monitoring heavy metals contamination at Heipang and Rayfield lakes respectively, and AAS is a better method than ED XRFS in determining heavy metals in fish tissues.
The authors are grateful to Springboard Laboratory, Awka, Kofa Services, Jos, National Metallurgical Development Centre, Jos, Grand Cereals Limited, Jos, Nigeria, and all those whose facilities were used for sampling and sample preparation.
|
AAS |
Atomic absorption spectroscopy |
|
As |
Arsenic |
|
BAF |
Bioaccumulation factor |
|
Cd |
Cadmium |
|
Cr |
Chromium |
|
ED XRFS |
Energy dispersive X-ray fluorescence spectroscopy |
|
FAO |
Food and Agricultural Organisation |
|
Hg |
Mercury |
|
Pb |
Lead |
|
ppm |
Part per million |
|
SS1 |
Sampling station 1 |
|
SS2 |
Sampling station 2 |
|
WHO |
World Health Organisation |
[1] Gordalla, B., Müller, M.B., Frimmel, F.H. (2007). The physicochemical properties of water and their relevance for Life. Global change: enough water for all.
[2] Makarigakis, A.K., Jimenez-Cisneros, B.E. (2019). UNESCO’s contribution to face global water challenges. Water, 11(2): 388-404. https://doi.org/10.3390/w11020388
[3] Venkatesan, T., Eswaramoorthy, R., Devarajan, N., Afzal, A., Kannan, K. (2014). Hydro chemical analysis of lake water quality at Salem District, Tamil Nadu, India. Chem Sci Rev Lett., 3(10): 148-155.
[4] Egila, J.N., Daniel, V.N. (2011). Trace metal accumulation in freshwater and sediment insects of Liberty Dam, Plateau State, Nigeria. International Journal of Basic and Applied Sciences, 11(6): 128-140.
[5] Nigeria, A. (2017). Plateau Government converts mining ponds to reservoirs for irrigation farming. AgroNigeria, Lagos.
[6] Akueshi, E.U., Omoreghe, E., Ocheakiti, N., Okunsebor, S. (2003). Levels of some metals in fish from Mining Lakes on the Jos Plateau, Nigeria: African Journal of Natural Sciences, 6: 161-167.
[7] Moore, F., Forghani, G., Qishlaqi, A. (2009). Assessment of heavy metal contamination in water and surface sediments of the Maharlu Saline Lake, SW Iran. Iranian Journal of Science and Technology, Transaction A, 33(A1): 43-55.
[8] Raulinaitis, M., Ignatavièius, G., Sinkevièius, S., Oškinis, V. (2012). Assessment of heavy metal contamination and spatial distribution in surface and subsurface sediment layers in the northern part of Lake Babrukas. Ekologija, 58(1): 33-43. https://doi.org/10.6001/ekologija.v58i1.2348
[9] Kishe, M.A., Machwa, J.F. (2003). Distribution of heavy metals in sediments of Mwanza Gulf of Lake Victoria, Tanzania. Environ Int., 28: 619-625. https://doi.org/10.1016/S0160-4120(02)00099-5
[10] Anna, F., János, S., András, S., István, V. (2001). Metal pollution and health indicator of lake ecosystems. International Journal of Occupational Medicine and Environmental Health, 14(2): 163-170. https://doi.org/10.1002/app.29865
[11] Ehiator, O.A., Jimoh, O.I. (2015). Evaluation of raw water quality of Bosso Lake in North-Central Nigeria. Journal of Civil Engineering and Construction Technology, 6(5): 80-85. https://doi.org/10.5897/JCECT2014.0309.
[12] Dhanakumar, S., Solaraj, G., Mohanraj, R. (2015). Heavy metals partitioning in sediments and bioaccumulation in commmercial fish species of three major reservoirs of River Cauvery Delta Region, India. Ecotoxicol. Environ, Saf., 113: 145-151. https://doi.org/10.1016/j.ecoenv.2014.11.032
[13] Tchounwou, P.B., Yedjou, C.G., Patlolla, A.K., Sutton, D.J. (2014). Heavy metals toxicity and the environment. US National Library of Medicine, National Institute of Health.
[14] Petrovic, Z., Teodrorovic, V., Dimitrijevic, M., Borozan, S., Beukovic, M., Milicevic, D. (2013). Environmental Cd and Zn concentration in liver and kidney of Erupean hare from different Serbian Regions: Age and tissue difference. Bull. Environ. Contamin. Toxicol. 90: 203-207. https://doi.org/10.1007/s00128-012-0901-7
[15] Authman, M.M.M., Abbas, H.H., Abbas, W.T. (2013). Assessment of metal status in drainage canal water and their bioaccumulation in Oreochromis niloticus fish in relation to human health. Environ Monit. Assess, 185: 891-907. https://doi.org/10.1007/s10661-012-2599-8
[16] Lottermoser, B. (2012). Characterisation, treatment and environmental impacts, Springer; New York, 400.
[17] He, Z.L., Yang, X.E., Stoffella, P.J. (2005). Trace elements in Agro ecosystems and impacts on the environment. J Trace Elem Med Biol; 19(2-3): 125-140. https://doi.org/10.1016/j.jtemb.2005.02.010
[18] Duffus, J.H. (2002). Heavy metals-a meaningless term? Pure Appl Chem., 74(5): 793–807. http://dx.doi.org/10.1351/pac200274050793.
[19] Eneji, I.S., Sha’Ato, R., Annune, A. (2012). An assessment of heavy metals loading in River Benue in Makurdi Metropolitan Area in Central Nigeria. Environmental Monitoring and Assessment, 184(1): 201-207. https://doi.org/10.1007/s10661-011-1959-0
[20] Bawuro, A.A., Voegborlo, R.B., Adimado, A.A. (2018). Bioaccumulation of heavy metals in some tissues of fish in Lake Geriyo, Adamawa State, Nigeria, Journal of environmental and Public Health, 2018: 7. https://doi.org/10.1155/2018/1854892