Kissar Selma* | Khemmoudj Kaddour | Adel Dihia
OPEN ACCESS
The vulnerability pollution of groundwater resources in Boulimat is a study carried out by several methods developed for the assessment of the vulnerability of aquifers. In all these methods, DRASTIC remains the most widely used in the world. The study of groundwater vulnerability pollution by the DRASTIC method has the advantage of combining the following seven parameters: the Depth of the water table (D), the effective Recharge (R), the Lithology of the aquifer (A), Soil type (S), Topography (T), Impact of the vadose zone (I) and aquifer Conductivity (C). The superposition of the seven maps gives us the vulnerability map this method, applied to the Boulimat alluvia surficiall aquifer, takes out four zones with vulnerability: a zone with low vulnerability with an index 102 , a medium-vulnerability area with an index 144, a high-vulnerability area with an index of 174, and a very high vulnerability area with an index of 196. Exploitation of the vulnerability map for the sustainable protection of natural resources. The projection of pollution resources on the vulnerability map gave us the Risk Map this is the aim of this research.
Algeria, aquifer, area, Boulimat, DRASTIC, pollution, risk map, vulnerability
Groundwater is considered one of the most important sources, for drinking water supply due to their high capacity to be stored and low exposure to pollutants as opposed to surface water. Groundwater is subject to multifaceted pollution that weakens the environment. Essentially fed by surface water but also by the infiltration of the waters of the waders crossing the basin and communicating permanently with the alluvial water table. Groundwater resources are increasingly being sought to meet growing water needs in the industrial, agricultural and drinking water sectors [1].
The problems associated with groundwater pollution are currently a source of concern which requires a universal interest. These waters are threatened by certain sources of pollution from anthropogenic, agricultural activities, uncontrolled landfills, uncontrolled sanitation systems, sewage and industrial waters. Pollution from anthropogenic activities reaches critical levels and poses a serious public health hazard, which is called risk.
As a result, good management of groundwater quality seems necessary to conserve these resources. For example, the development of vulnerability and sensitivity maps of aquifers to pollution has been necessary in recent decades, as they have been used in the management, prevention and protection of groundwater [2].
In order to safeguard these resources, it is necessary to provide for means of protection. Faced with the difficulties associated with pollution control techniques and the cost of them, protection requires preventive measures in the first place. These require mapping the areas of the aquifer that are likely to be affected by pollutants that will be described as vulnerable.
The notion of groundwater vulnerability was originally introduced by Margat in the 1960 [3-4]. And it is retained by the French National Committee of Hydrological Sciences as a term introduced by a lack of protection or natural defense of groundwater against threats of pollution, depending on local hydrogeological conditions.
Given the complexity of the mechanisms governing the transfer of a pollutant, the multitude and variability of the factors involved, various approaches have been proposed. Some authors have defined vulnerability as an intrinsic property of aquifers. Others believe it is related to the specific properties of the contaminant. However, other authors associate it with human activities and the nature of soils. [5-6].
Several studies have been carried out at international level: (Albinet 1970; Castany 1982; Aller et al., 1987; Suais and Durbar 1993; Lallemand and Barrès 1994; Vrba and Zaporozec 1994;Bézélgues and al. 2002; Murat et al., 2003; Kouam et al., 2007; Dibi et al., 2013; Kazmierczac et al., 2016; Anantha Rao et al., 2018; Shobharam ahirwar and Shukla 2018) [3-14].
And at national level: (Kherici et al., 2004; Chaffai et al., 2006; Khemmoudj 2009; khemmoudj et al., 2014; Charikh 2015; Bouguetit and Benhamida, 2015; Boulabaiz et al., 2017; Saadali and kherici 2018) [15-22].
And at the local level: (Derguini and Adrar 2004; Bedhouche and Barkani 2005; Djellout and Djellas 2006; Ait Hmoudi 2010; Belkebir and Debbou 2015; Ben Hamiche 2015; Djadi and Traore 2016; khemmoudj et al., 2018) [23-30].
In order to define an adaptation strategy, it is necessary to understand not only the potential impacts on resources and their uses, but also to analyze the vulnerability factors of the territories. The Vulnerability Study identifies the points of vigilance in a given territory and highlights areas where it is becoming urgent to implement management measures that promote adaptation to climate change.
The objective of this study is to assess the vulnerability of groundwater pollution to aquifers in the region. Several methods have been developed for the assessment of the vulnerability of aquifers. In all these methods, DRASTIC remains the most used.
This study was undertaken with the aim of identifying area of high risk of contamination regardless of the type of pollutant by DRASTIC (vulnerability) method and to know the effect of pollution on sustainable development of agricultural and tourism in the district and we will purpose some solicitations for this problem.
2.1 Study area
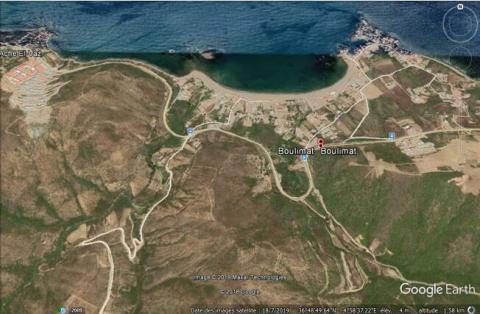
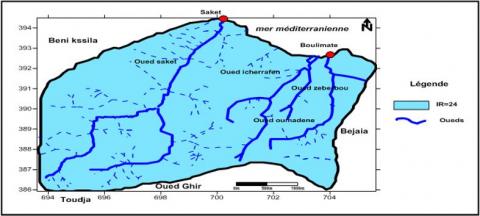
Boulimat is a tourist village in Algeria, part of Gouraya National Park located in the wilaya of Bejaia. Boulimat district has an area of around 45 km².Its nature, beaches, and crystal clear waters contribute to its appeal. Off Boulimat lies a rocky island called Pisan Island [31].
Boulimat benefits from a strategic location of the wilaya of Bejaia, directly connected to the RN 24. It enjoys a very good accessibility. Of regional renown. Boulimat beach carries important flows [31].
Limited to the North by the Mediterranean Sea, to the South by Toudja and Oued Ghir, To the east by Bejaia and to the west by Beni Kssila (Figure 1).
Figure 1. Location map of the study area
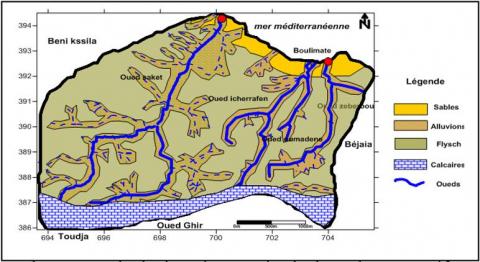
2.2 Geology
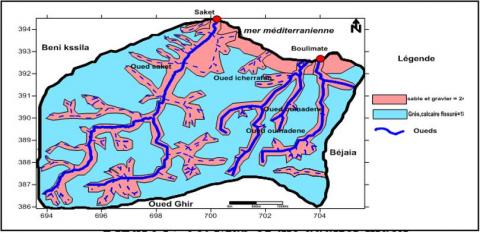
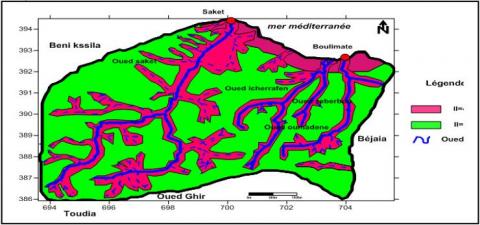
The geology of the Boulimat region is provided by three major sets (Figure 2):
Aboriginal formations, non-native formations and the high Berber background.
-Aboriginal Trainings:
Are characterized by the presence of alluvial along waders and clays of Miocene.
-Non-native formations:
The clays and riggings of the flysch tablecloth and the conglomerates that occupy the virtually all of the land.
-The high Berber background:
It is characterized by the presence of sandstone and an alternation of Oligocene facies of the Jurassic limestone chain and the base of the Paleozoic crystallophyllian formations.
Figure 2. Géological map of the study area
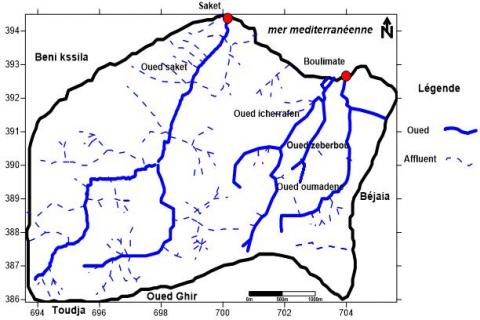
2.3 Hydrogeology
The watershed is characterized by three aquifers (Figure 3):
-Superficial formations (alluvial). Permeability K=10-5m /s.
-sand aquifer. Permeability K=10-3m /s.
-aquifers flysch (clay, righteous and conglomerate). Permeability K=10-6m/s.
-limestone aquifer: permeability k =10-4 m/s.
Figure 3. Hydrographic network map study area
2.4 DRASTIC method
The DRASTIC method, developed under the aegis of the US Environmental Protection Agency USEPA, is a method for assessing the intrinsic vertical vulnerability to aquifer pollution by parametric systems.
The choice of DRASTIC is justified by the fact that this method remains the most applied and which gave the results rather important in the evaluation of the vulnerability [11].
The acronym DRASTIC corresponds to the initials of the seven determinant factors above. These seven parameters schematically cut a local hydro geological unit into its main components, which influence, to varying degrees, the processes of transport and attenuation of contaminants in the soil, and their time of transit. [32].
The acronym DRASTIC corresponds to the initials of the seven factors determining the value of the vulnerability index [9].
-Depth of water (D): Represents the depth from the groundwater surface to the water table
-Net Recharge (R): Represents the amount of water that penetrates the vadose zone and reaches the water table. recharge water represents the vehicle for transporting pollutants.
-Aquifer media (A): Refers to the saturated zone material properties, which control the pollutant attenuation processes.
-Soil media (S): Represents the upper most weathered portion of the vadose and controls the amount of recharge that the infiltrate downward
-Topography (T): Refers to the slope of the land surface. It indicates whether the runoff will remain on the surface to allow pollutant to the saturated zone
-Impact of Vadose Zone (I): This is defined by the vadose zone material, which controls the passage and attenuation of the contaminated material to the saturated zone.
-Hydraulic Conductivity of the aquifer (C): Indicates the ability of the aquifer to transmit water, thus determines the rate of flow of the contaminant within the groundwater system. [18].
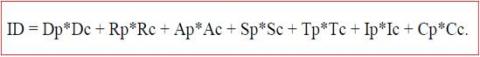
Index of vulnerability DRASTIC and noted ID, is determined; it describes the degree of vulnerability of each hydrogeological unit. [8]
The DRASTIC vulnerability index is calculated by summing the products of the notes by the weights of the corresponding parameters.
where, D, R, A, S, T, I, and C are the seven parameter of the DRASTIC method.
P=The weight of the parameter.
C=The associated coast.
Table 1. Quotations granted to the parameters of the DRASTIC method: [6]
-Depth of water (m)
|
0-1,5 m |
1, 5-4,5 m |
4, 5-9 m |
9-15 m |
15-22 m |
22, 5-30 m |
30 m |
|
10 |
9 |
7 |
5 |
3 |
2 |
1 |
|
25,5 mm |
17,5- 25,5 mm |
10-17,5 mm |
5-10 mm |
0-5 mm |
|
9 |
8 |
6 |
3 |
1 |
|
Karst Limestone |
Basalt |
sand and gravel |
Massive limestone |
Massive sandston |
Altered metaphorical |
metamorphic |
shale massif |
|
10 |
9 |
8 |
6 |
6 |
4 |
3 |
2 |
|
Not thick or absent |
Gravel |
Sands |
Clay, aggregate |
Sandblamon- Limon |
Silt |
Siliceous- silt |
Clay loam |
Clay not- aggregated |
|
10 |
10 |
09 |
07 |
06 |
5 |
4 |
3 |
1 |
|
0-2 % |
2-6 % |
6-12 % |
12-18 % |
18 % |
|
10 |
09 |
05 |
03 |
01 |
|
Karst Limestone |
sand and gravel |
sand and gravel with silt and clay |
Sandstone |
calca |
silt/clay |
|
10 |
09 |
08 |
06 |
06 |
01 |
|
9.4 m/s |
4.7-9.4 m/s |
32.9-4.7 m/s |
14.7-32.9 m/s |
4.7-14.7 m/s |
4.7-4.7 m/s |
|
10 |
8 |
6 |
4 |
2 |
1 |
Table 2. Weighting factor
|
Criteria |
Weighting factor |
|
|
Normal |
With product |
|
|
D: Depth R: Refill A: aquifer medium (saturated zone). S: Ground medium above the unsaturated zone T: Topography I: Nature of the unsaturated zone C: aquifer permeability |
5 4 3 2 1 5 3 |
5 4 3 5 3 4 2 |
Table 3. Index of degree of vulnerability
|
index DRASTIC |
Degree of vulnerability |
|
23-83 |
Very weak |
|
84-113 |
Weak |
|
114-144 |
Way |
|
145-174 |
High |
|
175-226 |
Very high |
3.1 Interpretations of the parameters of the DRASTIC method according to Margat, (1968) [3]
(1) Depth of water
The depth parameter showed us 4 zones (Figure 4):
-Sands in the depths range from 0-1.5 m, which induces a vulnerability index of the order of 50.
-Coastal plains of alluvial strings in depths vary Between 1.5 and 4.5m, thus implicating a partial vulnerability index of 45.
-The tablecloth of the flysch which occupies almost all of the ground, the depths vary from 4.5 to 9 meters, which gives us a vulnerability index in the order of 30.
-The sub-basin Sloping, the depth is 30 m which gives us an index of vulnerability of the order 5.
Figure 4. Map of the depth index
(2) The net recharge
Net recharge or infiltration is estimated at 156 .85 mm, this value is classified in the range of 25.5. So the partial recharge index is about 24 (Figure 5).
(3) The nature of aquifers "A"
The partial index of this parameter led to 2 important areas: The Sand and gravel with a partial index of 24 and rigged and cracked limestone formations with a partial vulnerability index of 18 (Figure 6).
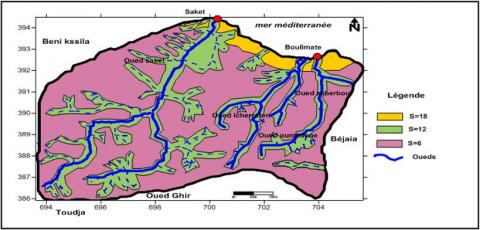
(4) Soil Type Parameter “S”
The pedological study of the region gives us three partial clues (Figure 7):
-The sandy soil with an index 18,
-sandy silty soil with an index of 12,
- siliceous siliceous soil with an index 6
(5) Topographic "T"
The region was divided into two topographical zones (Figure 8);
-The first covers shoreline with a slope of between 0 and 2 % with a partial index of 10
-The second zone covers the remainder of the land with a slope of more than 18 %, indicating a partial index of vulnerability of the order of 1.
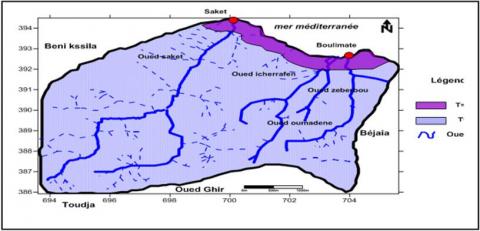
(6) Parameter of the unsaturated zone "I"
There are two classes (Figure 9)
-The first: Alluviations have an index of 40.
-The second: Sandstone and limestone have an index of 30
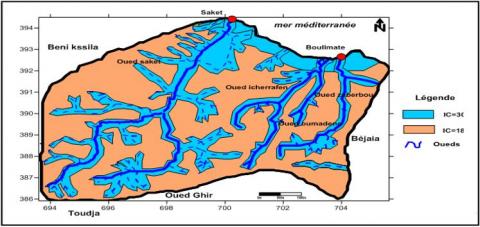
(7) Conductivity “C” (Figure 10)
-Sands (k=10-3m/s)
-conglomerate and rigged (k=10-6m/s) with an equal conductivity index: IC=30.
-Alluvions (k=10-5 m/s) with an equal conductivity index: IC=18
Figure 5. Map of net recharge parameter
Figure 6. Map of the aquifer index
Figure 7. Map of the nature of the sol parameter
Figure 8. Map of the topography index
Figure 9. Map of unsaturated zone index
Figure 10. Map of conductivity index
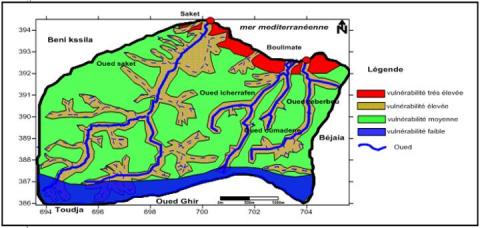
4.1 The vulnerability map of DRASTIC
Mapping the vulnerability to pollution in the Boulimate region the DRASTIC method was developed using Surfer version 11 (Figure 11).
The calculation of vulnerability indices according to the DRASTIC method is done directly by an addition calculation applied on the seven parameters. The result of this calculation is the development of a new layer of information that represents the change in the general vulnerability in the study area. [27].
Layering the seven cards gives us the final vulnerability map.
Figure 11. Vulnerability map
The vulnerability index for the DRASTIC method is calculated by multiplying the seven index parameters
On the basis of the results obtained, four parts are distinguished as follows:
-The weak part: at a degree of vulnerability that occupies a small area of the study area.The depth of the aquifer is greater than 30 m.
-The middle part: at a degree of vulnerability represents the largest percentage of the total area of Boulimat with a depth of 4.5 -9 m
-The high part: at a degree of vulnerability represents the area surrounding both Oueds (Saket and Djerba), it represents a depth of 1,5-4,5m.
-The very high part: This degree of susceptibility represents the sandblower of the Boulimat shoreline its depth is 0 to 1.5m, this zone contains sand facilitates the propagation of contaminants to groundwater.
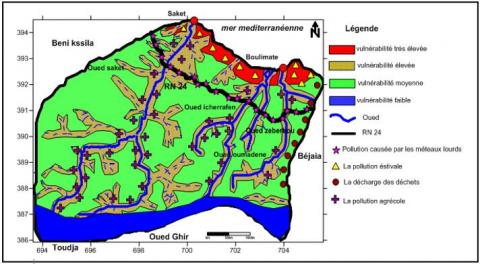
4.2 The Risk map
Projecting pollution sources on the vulnerability map. Gives us a risk map according to the following formula:
Sources of pollution:
Most of the time, human activities are responsible for soil pollution (Figure 12):
-Industrial plants can
-discards from livestock buildings.
-Actions by local authorities may also cause soil pollution.
-Road traffic is often the largest source of lead emissions to which man is exposed. It accounts for over 90 % of all lead emissions atmospheric in many urban areas according. [34].
-Agricultural holdings are also responsible for many soil pollution (notably nitrogen and phosphates,application of plant protection products which in turn will lead to contamination of stormwater, and subsequently streams. [35].
-The road traffic in the Boulimate study area is very developed by the passage of the national Route N.24 which has the consequence of the spread of gasoline products and derived as heavy metals
-The public landfill of Bulimat.
Figure 12. Risk map
In this study, we assessed the vulnerability to pollution by DRASTIC method
Results highlight 4 vulnerability classes these are the low, medium and high and very high vulnerability classe.
The compilation of this map shows us that they are based on the terrain encountered on the surface, the possibilities of penetration and propagation of pollutants, to better appreciate the fragility of existing drinking water catches, to better identify areas at risk when selecting new collection sites and to provide compensatory measures and to limit the risks of chronic or accidental pollution.
The main objectives of this control project were to draw up a portrait of the contamination of groundwater by pollution sources and to quantify the vulnerability of the rocky aquifer of the Boulimat watershed by DRASTIC method in a way to assess the impact of agriculture landfill on the quality of groundwater reserves. This was achieved through the implementation of field characterization and modeling work and the conduct of vulnerability studies.
[1] Margat, J. (2008). Groundwater in the world. BRGM. Ground and under ground.
[2] Amharref, M., Aassine, S., Bernoussi, A., Heddouchi, B. (2007). Cartography of the vulnerability to pollution of groundwater: Application to the Gharb's plain (Morocco). Revue des Sciences de l'Eau, 20(2): 185-199. https://doi.org/10.7202/015812ar
[3] Margat, J. (1968). Vulnerability of groundwater to pollution.Basic base, BRGM, 68 SGL 198 HYD. Orléans, France.
[4] Albinet, M., Margat, J. (1970). Mapping of vulnerability to groundwater pollution. (Mapping of groundwater vulnérability to polution) bulletin BRGM 2 series, 3(5): 13-22.
[5] Gogur, F., Dassargues, A. (1998). A short review on groundwater vulnerability assessment, basic statements for use in the framework of the cost 620 action. Workshop 18-20 mai. University of Neuchâtel.
[6] Lallemand-Barrés. (1994). Standardization of the characters for establishing pollution vulnerability maps, preliminary documentary study.
[7] Castany, G. (1982). Principle and method of hydrogeology. ED. Dunod, Paris France. 12-23.
[8] Aller, L., Bennett, T., Lehr, J.H., Petty, J., Hackett, G. (1987). DRASTIC: a standardized system for evaluating groundwater pollution potential using hydrogeological settings. U.S.Environmental Protection Agency (EPA), Ada, Oklahoma, USA.
[9] Bézèlgues, S., Des Garets, E., Mardhel, V., Dörfliger, N. (2002). Vulnerability mapping of Grand-Terre and Marie-Galatie (Guadeloupe). Phase 1: methodology for determining vulnerability. Report BRGM51783-FR, 41.
[10] Kouame, F.K., Dibi, B., Dongo, K., Kouadio, H.B., Akeg, E. (2007). Application of DRASTIC and SI methods for the study of vulnerability to the pollution of the nitrates (N03 -) of the Bonoua tableclop (South-east of Ivory Coast).
[11] Dibi, B., Kouassi, K.L., Kouamé, K.I., Konan, K.S., Soumahoro, M., Konan-waidhet, A.B., Gnakri, D. (2013). Assessment of vulnerability to pollution of aquifers of weathered layer by DRASTIC and SYNTACS methods: Case of M’Bahiakro city, Central Côte d’Ivoire. International Journal of Innovation and Applied Studies, 2: 464-476.
[12] Kazmierczak, J., Muller, S., Nilsson, B., Postma, D., Czekaj, J., Sebok, E., Jessen, S., Karan, S., Stenvig Jensen, C., Edelvang, K., Engesgaard, P. (2016). Groundwater flow and heterogeneous discharge into a seepage lake: Combined use of physical methods and hydrochemical tracers. Agu Water Resources Research, 52: 9109-9130. https://doi.org/10.1002/2016WR019326
[13] Anantha Rao, D., Pradeep, K.N., Sunil, K.J., Vinod Kumar, K., Dhanamjaya Rao, E.N. (2018). Assessment of vulnerability zones for ground water pollution using GIS-DRASTIC-EC model: A field-based approach. Journal of Earth System Science, 127: 49. https://doi.org/10.1007/s12040-018-0944-1
[14] Shobharam, A., Shukla, J.P. (2018). Assessment of Groundwater Vulnerability in Upper Betwa River Watershed using GIS based DRASTIC Model. Journal Geologial society of india, 91: 334-340. https://doi.org/10.1007/s12594-018-0859-0
[15] Kherici, N., Baali, F., Rouabhia, A.K., Djabri. (2004). Vulnerability and risk of groundwater pollution of the Miocene Sands of the plains of El Abiod (Algeria). University of Annaba. https://doi.org/10.1177/008124630503500209
[16] Chaffai, H., Laour, R., Djabri, L., Hani, A.D. (2006). Study of the vulnerability to pollution of the waters of the skikda alluvial aquifer: Application of the DRASTIC method. University of Annaba.
[17] Khemmoudj, K. (2009). Systems dynamics and management Strategy and management of water resources in semi-aride zones: Cas de la région of El Eulma. Wilaya of Sétif. PhD thesis.University of Annaba.
[18] Khemmoudj, K., Bendadouche, H., Merabet, S. (2014). Assessment of the vulnerability of an aquifer by DRASTIC and SYNTACS methods: Aquifer of Bazer-Guelt Zerga (Northeast Algeria). E3 journal of environmental research and Management N 5/9 pp. 169-179.
[19] Charikh, M. (2015). Estimation and mapping of groundwater Vulnerability in arid environments: Application to the bowl of Ouargla. Magister memory. University of Ouargla.
[20] Bouguetit, K., Benhamida, N. (2015). Study of the vulnerability to groundwater pollution of the Ouargla basin (case of the inter-continental sheet). Master memory faculty of applied science. Université Kasdi Merbah Ouargla.
[21] Boulabeiz, M., Houha, B., Bousnoubra, H., Agaguenia, S. (2017). AGIS based DRASTIC model for assessing groundwater vulnerability in the coastal plain of Collo, Northeastern Algeria, Journal of biodiversity and environmental Sciences (JBES), 10(4): 81-89.
[22] Saadali, R., Kherici, N. (2018). Groundwater pollution and sustainable development of the Collo plain; Northeastern Algeria. Journal of Biodiversity and Environmental Sciences (JBES), 12(06): 160-165.
[23] Derguini, N., Adrar, H. (2004). Study of the vulnerability to pollution of the Souk–El-Tenine commune. University of Bejaia.
[24] Bedhouche, O., Berkani, N. (2005). La vulnerability to pollution of the region of Aokas.Thése engineer thesis in ecology and environment unpublished, University of A Mira of Bejaia.
[25] Djellout, N., Djallas, D. (2006). Study of the vulnerability to pollution of the Tichy region.University of Bejaia.
[26] Ait Hmoudi, T. (2010). Study of the vulnerability of the bay of Bejaia. University of Bejaia.
[27] Belkebire, H., Debbou, F. (2015). Assessment of the vulnerability to pollution of the aokas region by the EPIK method. Master’s thesis in environmental sciences. University of A Mira of Bejaia.
[28] Ben Hamiche, N. (2015). Contribution to the study of the climatic,lithological and anthropic influence on the variation of the physioco-chemical parameters of the waters of an aquifer of North-East algerian: Case of the Soummam bass, Bejaia. thesis.
[29] Djadi, H.M., Traore, P.N. (2016). Study of the vulnerability of the Souk El Tenine commune by the DRASTIC and GOD method. University of Bejaia.
[30] Khemmoudj, K., Balla, E., Djenadi, H., Djerroud, Y. (2018). Groundwater vulnerability assessment using GOD method in Boulimat coastal District area North east Algeria. Journal of Biodiversity and Environmental Sciences, 13(3): 109-116. https://doi.org/10.26872/jmes.2018.9.6.201
[31] Anonymous. (2018). (https://www.google.dz/le+bassin+versant/htm).
[32] Djabri, L. (2015). Study of the vulnerability of waters to the pollution of a pledge for the development of a gire: Case of alluvial plain of Tébessa.
[33] Lovie, M. (1997). Removal of Lead from Gasoline Pollution - Prevention and Abatement Handbook. World Bank 1997: 1-16.
[34] Dib, I. (2009). The impact of agricultural and urban activity on the groundwater quality of the Gadaine plain- Ain Yaghout (East Algerian). Magister memory in hydraulics, hydro-technical construction and environment, Faculty of Engineering Sciences, hydraulic department, University of Hadj Lakhdar Batna, 127.