Xiaodong Peng* | Chaoqiang Yang | Xiaoqiang Bian | Laichao Wang | Jiao Luo | Hongjiang Ruan
OPEN ACCESS
Traditionally, it is believed that the production index curve (PIC) of abnormally high-pressure (AHP) gas reservoir is a curve with sectional downward bend. But the traditional view often contradicts with what is observed in production practice. To solve the contradiction, this paper carries out depletion production experiments with long-core displacement on AHP gas reservoirs in Miocene Huangliu Formation, Dongfang (DF) area of Yinggehai Basin. The cores were collected from two wells in the study area, and temperature and pressure of the local formation were used in the experiments. Two sets of experiments were conducted, one without aquifer and the other with different aquifer volumes. The results analysis shows that: (1) The PIC of water-drive gas reservoir is generally a smooth convex, which eventually intersects the cumulative gas axis at the dynamic OGIP point; The PIC convexity is positively correlated with aquifer volume. (2) The AHP gas reservoir is a special gas reservoir with finite aquifer, and the traditionally view that the PIC of the AHP gas reservoir with sectional downward bend is incorrect. (3) Piston-like displacement features were observed in the experiments. The larger the aquifer, the more the energy retained in the gas reservoir, and the higher the recovery ratio at the same abandonment pressure. It is concluded that, to push up the recovery ratio, balanced development should be pursued in water-drive gas reservoir to ensure stable uplift of gas-water contact.
abnormally high-pressure (AHP) gas reservoir, depletion production, recovery ratio, long-core displacement, production index curve (PIC)
The material balance of gas reservoir can either be described by pseudo-pressure or expressed with apparent original gas in place (OGIP) [1]. For example, Li defined the relationship between pseudo-pressure (P/Z) and cumulative gas production (Gp) as the production index curve (PIC) of gas reservoirs, and derived the general material balance equation and the PIC of constant volume gas reservoir and water-drive gas reservoir in the form of pseudo-pressure [1].
Traditionally, it is believed that the PIC is a straight line in constant volume gas reservoir [1], a curve with upward bend in water-drive gas reservoir [2-5], and a curve with sectional downward bend in abnormally high-pressure (AHP) gas reservoir [6, 7]. However, Li argued that the AHP gas reservoir is a special gas reservoir with finite aquifer, and its PIC does not take a sectional downward bend [8]. Targeting the YC13-1N gas reservoir, Yang and Peng rechecked the PICs of water-drive gas reservoir and the AHP gas reservoir, revealing that the AHP gas reservoir is a special gas reservoir with finite aquifer [9, 10].
Zhu physically simulated the depletion production of the AHP gas reservoirs in Kela-2 gas field, yet failing to compare the effects of different aquifer volumes [11]. Jiang conducted similar experiments on the depletion production of carbonate gas reservoirs with high sulfur content. Neither did he contrast the impacts of different aquifer volumes [12]. Jiao physically and numerically simulated the water invasion in bottom-water-drive gas reservoir, but did not analyze the PIC of the gas reservoir [13]. He carried out experiments to disclose the effect of gas production rate on production performance in a gas field, without considering the influence of aquifers [14].
Inspired by the existing studies, this paper carries out experiments on depletion production of Miocene Huangliu Formation with long-core displacement. Located in the Dongfang (DF) area of Yinggehai Basin, the formation has a geothermal gradient of 3.98~4.39 ℃/100m, a temperature of 129~141 ℃, original pressure coefficient of 1.68~2.08 and original pressure of 49.98~58.27 MPa [15-17]. Two sets of experiments were implemented, one without aquifer and the other with different aquifer volumes. The experimental results were fully analysed, so did the PIC features and water flux of AHP gas reservoir. The analysis shows that AHP gas reservoir, with a smooth convex PIC, is a special gas reservoir with finite aquifer. It is also learned that a high recovery ratio is possible through balanced development, thanks to its stable lifting of gas-water contact.
2.1 Devices
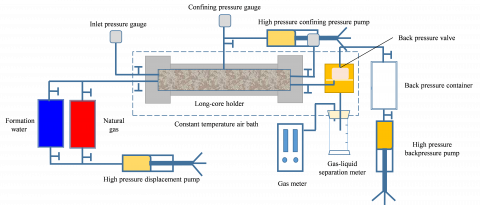
Two long-core displacement assemblies (max. working pressure: 70 MPa; max. working temperature: 180 ℃) were designed to simulate the depletion production of edge-water-drive gas reservoir. As shown in Figure 1, each assembly consists of a long-core displacement device capable of withstanding high temperature and pressure, an injection pump system, a long-core holder, a backpressure valve, a temperature control system, a gas-liquid separator and a gas meter.
Figure 1. The long-core displacement assembly
2.2 Cores
Short cores were selected and dried, and then rearranged into two long cores. Filter paper was added between short cores to eliminate the tip effect. The first long core has a length of 33.52 cm, a mean porosity of 18.52%, and a mean permeability of 13.95 mD. The second long core has a length of 50.25 cm, a mean porosity of 19.47% and a mean permeability of 25.54 mD. The basic parameters of the long cores are listed in Table 1 below.
Table 1. The basic parameters of long cores
|
Well name |
No |
Diameter (cm) |
Length (cm) |
Porosity (%) |
Permeability (mD) |
Core volume (cm3) |
Pore volume (cm3) |
Sequence of assembly |
Note |
|
DF13-Z-2 |
DS-4 |
2.5 |
5.61 |
19.00 |
17.03 |
27.53 |
5.23 |
(3) |
Without aquifer depletion |
|
DS-5 |
2.5 |
5.24 |
18.90 |
17.18 |
25.72 |
4.86 |
(2) |
||
|
DS-6 |
2.5 |
5.80 |
17.92 |
13.44 |
28.46 |
5.10 |
(5) |
||
|
DS-7 |
2.5 |
5.44 |
17.66 |
8.44 |
26.68 |
4.71 |
(6) |
||
|
DS-8 |
2.5 |
5.79 |
18.12 |
14.91 |
28.42 |
5.15 |
(4) |
||
|
DS-9 |
2.5 |
5.64 |
19.55 |
18.56 |
27.67 |
5.41 |
(1) |
||
|
Total |
33.52 |
18.52 |
13.95 |
164.47 |
30.46 |
||||
|
DF13-Z-8d |
DS-2 |
2.5 |
5.64 |
20.94 |
57.73 |
27.68 |
5.80 |
(9) |
With aquifer depletion |
|
DS-3 |
2.5 |
5.08 |
21.68 |
50.68 |
24.94 |
5.41 |
(6) |
||
|
DS-4 |
2.5 |
5.30 |
20.82 |
36.84 |
25.98 |
5.41 |
(3) |
||
|
DS-5 |
2.5 |
5.63 |
18.73 |
39.90 |
27.64 |
5.18 |
(4) |
||
|
DS-6 |
2.5 |
5.74 |
21.14 |
48.97 |
28.17 |
5.95 |
(7) |
||
|
DS-8 |
2.5 |
6.16 |
15.97 |
7.51 |
30.21 |
4.82 |
(5) |
||
|
DS-9 |
2.5 |
5.44 |
19.66 |
44.04 |
26.70 |
5.25 |
(8) |
||
|
DS-10 |
2.5 |
5.84 |
17.88 |
36.75 |
28.65 |
5.12 |
(2) |
||
|
DS-12 |
2.5 |
5.41 |
19.01 |
15.68 |
26.56 |
5.05 |
(1) |
||
|
Total |
50.25 |
19.47 |
24.54 |
246.52 |
47.99 |
||||
2.3 Fluid samples
Natural gas and formation water were mixed in the light of in-situ samples. The components of natural gas and the parameters of formation water are given in Tables 2 and 3, respectively.
Table 2. The components of natural gas
|
Components |
Contribution (%) |
Components |
Contribution (%) |
|
C1 |
84.5236 |
C5 |
0.0511 |
|
C2 |
1.57 |
C6 |
0.257 |
|
C3 |
0.777 |
C7 |
0 |
|
iC4 |
0.19 |
C8 |
0 |
|
C4 |
0.169 |
N2 |
9.33 |
|
iC5 |
0.0823 |
CO2 |
3.05 |
|
Initial pressure (MPa) |
Temperature (℃) |
Salinity (mg/L) |
Water formation volume factor |
Types |
|
53 |
152.5 |
13000 |
1.062 |
NaHCO3 |
The first experiment was carried out in seven steps:
Step 1: The porosity and permeability of each short core were measured after selection and drying.
Step 2: The short cores were rearranged into two long cores. Filter paper was added between short cores to eliminate the tip effect. Each long core was loaded into a holder with confining pressure.
Step 3: The air was removed from each long core with the vacuum pump.
Step 4: Water was injected into the core until reaching the irreducible water saturation.
Step 5: The oven was adjusted to the in-situ temperature of 152.5 ℃, and the confining pressure of the long core was set to the formation pressure of 53 MPa.
Step 6: The pressure was changed by adjusting the inlet pressure and the backpressure valve. The pressure in the long core was reduced to 1MPa with a step length of 3MPa. The outlet flow rate, time, inlet pressure and outlet pressure were recorded in real time. The water vessel was connected to the inlet to simulate the impact of aquifer.
Step 7: The core was cleaned with ether and dried in nitrogen.
The second experiment was conducted by repeating the Steps 3~6 to simulate the impact of different aquifer volumes.
4.1 Well DF-Z-2
The short cores from well DF-Z-2 were used to simulate the depletion production of gas reservoir without aquifer with long-core displacement. The PIC and the cumulative gas production of the well are shown in Figure 2 and Table 4, respectively. It can be seen that the PIC of AHP gas reservoir without aquifer was basically a straight line, rather than the traditionally believed curve with sectional downward bend.
Table 4. Cumulative gas production of Well DF-Z-2
|
Pressure (MPa) |
53 |
50 |
47 |
44 |
41 |
38 |
35 |
32 |
29 |
|
Cumulative gas production (cm3) |
0 |
177.3 |
205.4 |
223.2 |
241.9 |
261.5 |
279.3 |
303.1 |
329.5 |
|
Pressure (MPa) |
26 |
23 |
20 |
17 |
14 |
11 |
8 |
5 |
1 |
|
Cumulative gas production (cm3) |
356.3 |
365.2 |
385.6 |
405.1 |
438.3 |
468.0 |
510.1 |
533.5 |
576.5 |
Figure 2. The PIC of Well DF-Z-2
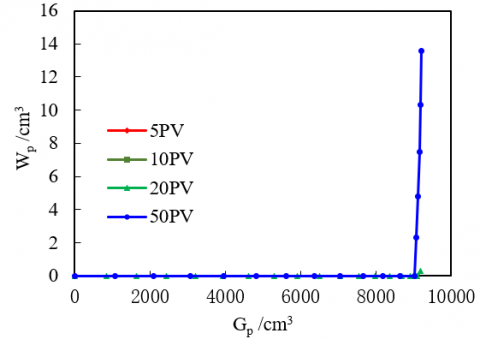
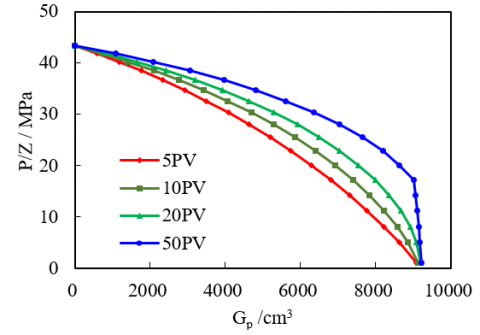
4.2 Well DF-Z-8d
The short cores from Well DF-Z-8d were used to simulate the depletion production of gas reservoir with finite aquifer in different volumes. Table 5 lists the cumulative gas productions of different finite aquifers: (1) With the same porosity, the cumulative gas production increased slightly with the growth in aquifer volume; (2)The aquifer volume is positively correlated with the initial gas production rate, and negatively with the later gas production rate; (3) The gas production rate plunged after water breakthrough.
Table 5. Cumulative gas productions of Well DF-Z-8d with different aquifer volumes
|
Pressure (MPa) |
Cumulative gas production (cm3) |
|||
|
5 PV volume |
10 PV volume |
20 PV volume |
50 PV volume |
|
|
53 |
0.0 |
0.0 |
0.0 |
0.0 |
|
50 |
592.2 |
714.8 |
837.3 |
1079.1 |
|
47 |
1180.2 |
1415.3 |
1649.2 |
2090.2 |
|
44 |
1766.4 |
2103.7 |
2437.8 |
3060.7 |
|
41 |
2350.1 |
2777.9 |
3197.0 |
3964.7 |
|
38 |
2930.7 |
3436.3 |
3929.2 |
4825.9 |
|
35 |
3507.5 |
4076.6 |
4626.4 |
5620.0 |
|
32 |
4079.5 |
4698.1 |
5293.5 |
6367.2 |
|
29 |
4645.4 |
5296.8 |
5921.6 |
7048.3 |
|
26 |
5203.8 |
5870.2 |
6504.9 |
7653.3 |
|
23 |
5752.1 |
6416.5 |
7048.6 |
8194.8 |
|
20 |
6287.3 |
6929.2 |
7539.1 |
8642.0 |
|
17 |
6807.0 |
7407.4 |
7989.4 |
9019.2 |
|
14 |
7307.4 |
7844.4 |
8366.9 |
9073.8 |
|
11 |
7781.2 |
8234.8 |
8676.1 |
9116.8 |
|
8 |
8221.7 |
8578.0 |
8920.9 |
9152.2 |
|
5 |
8624.0 |
8862.3 |
9094.5 |
9182.4 |
|
1 |
9084.7 |
9139.6 |
9191.1 |
9216.9 |
Table 6. Cumulative water fluxes of Well DF-Z-8d with different aquifer volumes
|
Pressure (MPa) |
Cumulative water production (cm3) |
|||
|
5 PV volume |
10 PV volume |
20 PV volume |
50 PV volume |
|
|
53 |
0.0 |
0.0 |
0.0 |
0.0 |
|
50 |
0.0 |
0.0 |
0.0 |
0.0 |
|
47 |
0.0 |
0.0 |
0.0 |
0.0 |
|
44 |
0.0 |
0.0 |
0.0 |
0.0 |
|
41 |
0.0 |
0.0 |
0.0 |
0.0 |
|
38 |
0.0 |
0.0 |
0.0 |
0.0 |
|
35 |
0.0 |
0.0 |
0.0 |
0.0 |
|
32 |
0.0 |
0.0 |
0.0 |
0.0 |
|
29 |
0.0 |
0.0 |
0.0 |
0.0 |
|
26 |
0.0 |
0.0 |
0.0 |
0.0 |
|
23 |
0.0 |
0.0 |
0.0 |
0.0 |
|
20 |
0.0 |
0.0 |
0.0 |
0.0 |
|
17 |
0.0 |
0.0 |
0.0 |
0.0 |
|
14 |
0.0 |
0.0 |
0.0 |
2.3 |
|
11 |
0.0 |
0.0 |
0.0 |
4.8 |
|
8 |
0.0 |
0.0 |
0.0 |
7.5 |
|
5 |
0.0 |
0.0 |
0.0 |
10.3 |
|
1 |
0.0 |
0.0 |
0.3 |
13.6 |
Figure 3. Water productions of Well DF-Z-8d with different aquifer volumes
Figure 4. The PICs of Well DF-Z-8d
The following can be derived from the PICs in Figure 4: (1) The PIC of water-drive gas reservoir is generally a smooth convex, which eventually intersects the cumulative gas axis at the dynamic OGIP point; (2) The PIC convexity is positively correlated with aquifer volume; (3) When the aquifer volume reached 50PV, the production index curve bent abruptly downward to the point of dynamic OGIP at the end period because of water production.
It can be seen from Figures 2 and 4 that, the PIC of AHP gas reservoir is a smooth convex [8-10,18], not the traditionally believed curve with sectional downward bend [6, 7]. If the aquifer is finite, the PIC of AHP gas reservoir exists as a smooth convex curve; if the aquifer is absent, the PIC takes the shape of a straight line.
Moreover, piston-like displacement features were observed in the simulations of depletion production with long-core displacement [4]. The larger the aquifer, the more the energy retained in the gas reservoir, and the higher the recovery ratio at the same abandonment pressure.
Owing to the heterogenous terrain and imbalanced production, water breakthrough will occur earlier in actual gas reservoir. After water breakthrough, the critical time in the PIC will shift counterclockwise towards gas recovery reduction. The water breakthrough will magnify the features of terrain heterogeneity and production imbalance. In this case, the recovery ratio will decrease with the growth in the abandonment pressure.
To push up the recovery ratio, balanced development should be pursued in water-drive gas reservoir to ensure stable uplift of gas-water contact.
Through simulations of depletion production with long-core displacement, it is concluded that the PIC of water-drive gas reservoir is generally a smooth convex, which eventually intersects the cumulative gas axis at the dynamic OGIP point; The PIC convexity is positively correlated with aquifer volume. The results confirm that the AHP gas reservoir is a special gas reservoir with finite aquifer, and the traditionally view that the PIC of the AHP gas reservoir with sectional downward bend is incorrect.
Moreover, piston-like displacement features were observed in the simulations of depletion production with long-core displacement. The larger the aquifer, the more the energy retained in the gas reservoir, and the higher the recovery ratio at the same abandonment pressure. To push up the recovery ratio, balanced development should be pursued in water-drive gas reservoir to ensure stable uplift of gas-water contact.
This paper is supported by the National Science and Technology Major Project of China (2016ZX05024005) and the Comprehensive Scientific Research Projects of CNOOC (YXKY-2016-ZHJ-02).
[1] Li, C.L. (2011). Fundamentals of reservoir engineering. Beijing: Petroleum Industry Press, 124-183.
[2] Zhang, L.Y., Li, J. (1998). Curve fitting method of dynamic reserve calculation in water driver gas reservoir. Natural Gas Industry, 18(2): 26-29.
[3] Ahmed, T. (2001). Reservoir engineering handbook. Gulf Professional Publishing.
[4] John, L., Robert, A.W. (1996). Gas reservoir engineering. Henry L. Doherty Memorial Fund of AIME, Society of Petroleum Engineers.
[5] Dake, L.P. (1978). Fundamentals of reservoir engineering. Amsterdam, Elsevier.
[6] Ezekwe, N. (2010). Petroleum reservoir engineering practice. Prentice Hall.
[7] Hammerlindl, D.J. (1971). Predicting gas reservoirs in abnormally pressured reservoirs. SPE 3479.
[8] Li, C.L. (2007). Misunderstanding the performance of abnormal pressure gas reservoir. Journal of Southwest Petroleum University, 29(2): 166-169.
[9] Yang, C.Q., Peng, X.D., Wang, X.G., Luo, J., Tong, L.Y. (2017). New understanding on production index curve of water drive gas reservoir: a case study of north block in YC13-1 gas field. China Offshore Oil and Gas, 29(1): 77-82.
[10] Peng, X.D., Zhu, S.P., Wang, Q.S., Luo, J., Lu, Y. (2018). New calculation method of dynamic OGIP and aquifer volume in gas reservoirs with restricted and closed aquifers. China Offshore Oil and Gas, 30(2): 77-82.
[11] Zhu, H.Y., Yu, X.H., Wan, Y.J. (2003). Simulation experiment of depletion drive development for anomaly high pressure gas reservoir of KeLa 2 gas field. Natural Gas Industry, 23(4): 62-64.
[12] Jiang, G.J., Tang, S.S., Huang, Y.H., Zhou, Y.Z. (2013). A depletion experimental study of carbonate sour gas reservoirs. Petrochemical Industry Application, 32(1): 60-63.
[13] Jiao, C.Y., Zhu, H.Y., Hu, Y., Xu, X. (2014). The physical experiment and numerical model of water invasion to the gas reservoir. Science Technolog and Engineering, 14(10): 191-194.
[14] He, M.Y., Sun, C.X., Xu, B.W., Qi, L.S. (2017). Experimental study on influence of gas recovery rate on production performance in gas fields. Contemporary Chemical Industry, 46(3): 454-456.
[15] Xie, Y.H. (2016). Hydrocarbon accumulation mechanism and resource prospect of HTHP natural gas reservoirs in Western South China Sea: A case study on the Ying-Qiong Basin. Oil Drilling & Production Technology, 38(6): 713-722.
[16] Zhang, H.L., Pei, J.X., Zhang, Y.Z., Jiang, C.Y., Zhu, J.C., Ai, N.P., Hu, Q.W., Yu, J.F. (2013). Overpressure reservoirs in the mid-deep Huangliu Formation of the Dongfang area, Yinggehai Basin, South China Sea. Petroleum Exploration and Development, 40(3): 284-293.
[17] Huang, Z.L., Zhu, J.C., Ma, J., Wu, H.Z, Zhang, H.L. (2015). Characteristics and genesis of high-porosity and low-permeability reservoirs in the Huangliu Formation of high temperature and high pressure zone in Dongfang area, Yinggehai Basin. Oil & Gas Geology, 36(2): 288-295.
[18] Fetkovich, M.J., Reese, D.E., Whitton, C.H. (1998). Application of a general material balance for high-pressure gas reservoirs. SPE22921, 3-13.