Hichem Mebarki | Tayeb Kebir | Mohamed Benguediab* | Hamida Fekirini | Benattou Bouchouicha | Frédéric Lebon
© 2022 IIETA. This article is published by IIETA and is licensed under the CC BY 4.0 license (http://creativecommons.org/licenses/by/4.0/).
OPEN ACCESS
This study presents an experimental and computational analysis of fracture under mixed-mode conditions in aluminum alloy AA3003 using the Compact Tension Shear CTS specimen, both not welded and Friction stir welded. Mixed-mode fracture experiments were performed using the CTS specimen and an ARCAN loading device based on Richard's principle suitable for mixed-mode. The approach of linear elastic fracture mechanics allows for a better understanding of mixed-mode failure and the evaluation of the stress intensity parameters KI and KII. The variation of the stress intensity factor KI, KII is influenced by the pre-cracks length. The comparison between experimental results and the numerical results of simulation shows that there is a good agreement between these results.
CTS specimen, friction stir welding, ARCAN device, stresses intensity factors KI-KII, notch length, loading angle
Fracture is the main cause of mechanical component failure; much research has been done in this area. In reality, fracture mechanics problems are frequently studied by just considering loading conditions in mode I because this mode is the most significant; is also easier to examine. After all, the crack propagates in the same direction as it began.
The various types of loading are often idealized as being the pure mode I (opening mode where tensile stress is normal to the plane of the crack) or mode II (sliding mode corresponding to shear stress acting parallel to the plane of the crack and perpendicular to the crack front) employed as the solutions of the elastic linear mechanics of the fracture to characterize the behavior of fracture materials. However, structures are subjected to complicated loadings containing a combination of tension (mode I), in-plane shear (mode II), and occasionally out-of-plane shear (mode III); these failure modes are referred to as mixed-mode of fracture.
To obtain the fracture behavior of different materials under combined tensile and shear loading (i.e. mixed mode I/II), several specimen geometries and test methodologies have been developed [1-8].
By employing a suitable device loading, Richard and Benitz [2] developed a CTS compression and tension test specimen that can produce a fracture in mixed-mode I–II. This geometry is commonly used to determine fracture toughness and to analyze fatigue crack propagation [9-13]. Other methods such as the Brazilian disc with a central crack [14-16], a rectangular plate with an inclined central crack subjected to a uniform axial loading [5, 6], and asymmetric bending three / four-point [17, 18] are often utilized for fracture testing under mixed-mode. Borrego et al. [19] performed test specimens (CTS) with variable stress intensity ratios, KI / KII, using the aluminum alloy AlMgSi1-T6. Biner [20] also used AISI-304 stainless steel CTS specimens for fracture tests under mixed-mode. Tanaka [21] performed another experiment on aluminum sheet specimens, this time obtaining the mixed-mode by using an initial fracture that was tilted concerning the tensile axis. Benarbia et al. [22] have a finite element analysis to determine the stress intensity factors from indirect tensile testing by bending and Brazilian disk. The fracture behavior in mode I and mode II on welded specimens of aluminum alloys has been the subject of several studies.
However, few researchers have been interested in the fracture of aluminum alloys welded by FSW using CTS specimens. By assuming that the fracture remains planar and normal to the lateral faces, Richard et al. [23] calculated the stress intensity factors in KI and KII for the pre-cracked specimen CTS. Empirical methods have been used by Antunes et al. [24] to determine stress intensity factors KI, KII on CTS specimens, considering crack length, loading angle, and crack orientation. Houari et al. [25] have proposed numerical modeling of fracture behavior of HDPE using different fracture mechanics approaches. Lin et al. [26] have used finite element code ANSYS to simulate the maximum stress state on axle surface, the stress intensity factors KI are determined. A law distribution at the crack tip of the stress intensity factors is established for different initial shapes.
Experimental and computational fracture analysis in mixed mode is reported in this study utilizing a CTS specimen of aluminum alloy AA3003 specimens welded by the FSW process and not welded specimens.
2.1 Material studied
The material used in this study is the Wrought Aluminum Alloy AA3003 classified in the category of aluminum-manganese whose chemical and mechanical characteristics of the not welded and welded metal are presented respectively in Tables 1, 2, and 3.
Table 1. Chemichal composition [27]
|
Element |
Al |
Mn |
Si |
Fe |
Cu |
Ti |
Zn |
|
% |
96.7 |
1.3 |
0.9 |
0.9 |
0.13 |
0.1 |
0.03 |
Table 2. Mechanical properties of Al-alloy AA3003 [27]
|
Yield Stress σys (MPa) |
Ultimate Tensile Strength σuts (MPa) |
Poisson’s ratio υ |
Elastic Modulus E (MPa) |
Elongation (%) |
|
105.7 |
160 |
0.30 |
70 |
15.5 |
Table 3. Mechanical properties of welded Al-alloy AA3003 [27]
|
Yield Stress σys (MPa) |
Ultimate Tensile Strength σuts (MPa) |
Poisson’s ratio υ |
Elastic Modulus E (MPa) |
Elongation (%) |
|
87.1 |
140.1 |
0.30 |
70 |
24 |
2.2 Test and method setup
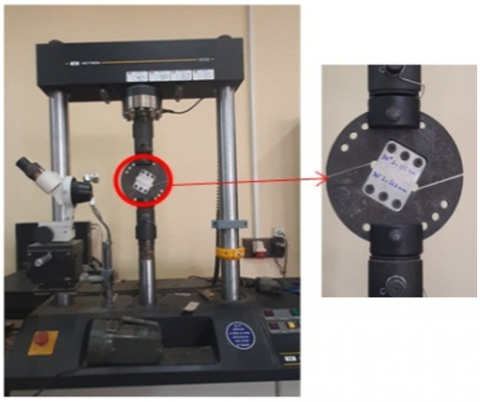
The fracture tests CTS specimens were carried out on an INSTRON 8501 Hydraulic machine with a capacity of 100 KN controlled by MTS software allowing the acquisition of data (load-displacement). The machine is fitted with a mixed-mode loading device (Figure 1). All tests were conducted with a controlling constant displacement speed of 0.5 mm/min until failure. The geometry and dimensions of the CTS specimen and the loading device are shown in Figures 2 and 3, respectively.
Figure 1. Testing machine INSTRON 8501 fitted device loading for CTS specimen
The fracture experiments under mixed-mode were realized using a CTS specimen and a loading device developed by Amrane [28] based on the Richards principle [2] and applied to CTS specimens. The device allows, in more of the pure shear loading, corresponding to α =0°, to carry out combined biaxial shear and tensile tests, loading angle ranges in 15° increment (α =15°, 30°, 45°, 60°, 75°) and tensile for α =90°.
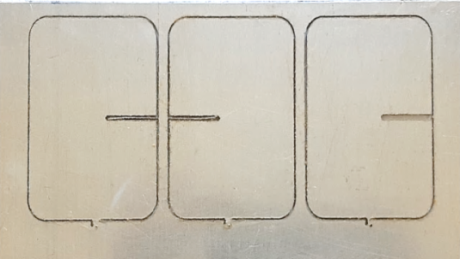
CTS specimens with three notches of length (a/W=0.3, 0.5, and 0.7) were tested.
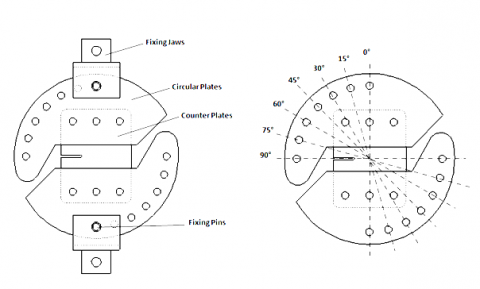
Figure 2. Geometry and dimensions of CTS specimen
Figure 3. Loading device suitable for mixed-mode [28]
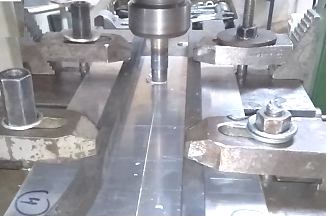
All the not welded and welded specimens are obtained by water jet cutting from aluminum plates measuring 250 x 120 mm and 2 mm thick for the not welded specimens (Figure 4) and from two plates measuring 250 x 60 mm and 2 mm thick welded by Friction Stir Welding perpendicular to the rolling direction (Figure 5). Water jet cutting was used to notch all of the test specimens.
Figure 4. Cutting water jet of not welded CTS specimen
Figure 5. Friction welding configuration
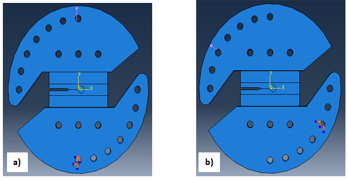
Using the finite element calculation software "ABAQUS 6.14, simulations of the rupture tests were conducted on both not welded and friction stir welded CTS specimens. The J-integral interaction method performed in ABAQUS is used to calculate stress intensity factors and also separate the components of the stress intensity factors for fracture under mixed-mode loading in combination with analysis by finite element [29]. A steel semi-disc is used to simulate the mixed-mode loading device I and II. By orienting the direction of loading according to different angles concerning the axis of the crack, this device makes it possible to generate different configurations of mixed-mode. The ABAQUS computer code models this half-disk as a rigid solid. The boundary conditions are shown in Figure 6. The propagation of the crack in mixed mode I-II is done under an imposed loading. At each chosen angle, one hole of the sample (semi-disc) was fixed and the load parallels the other hole by an imposed loading Pmax=2000N.
Figure 6. Boundaries conditions a) a=90° b) a=30°
Figure 7. Representation of finite element mesh pattern of the entire specimen mounted on the device
Figure 7 illustrates an example of the specimen's mesh design, which was created using ABAQUS 6.14. A 20-node quadratic brick mesh element type was used to simulate the complete specimen installed on the device (C3D20R: A 20-node quadratic brick). A highly refined FE model is required to ensure convergence of the given solution at the area of high located deformation at the crack tip. For the best accuracy, the mesh was refined around the crack tip, so that the smallest element size found in the crack tip elements was approximately 0.02 mm.
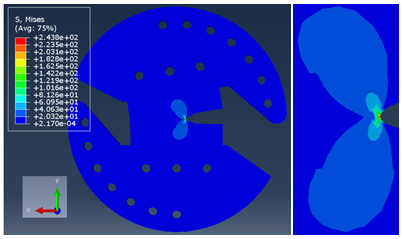
Figure 8 shows the distribution of equivalent Von Mises stresses determined using ABAQUS for a loading angle of 90.
Figure 8. Distribution of equivalent Von Mises stress for loading angle α=90°
4.1 Load-displacements curves
a/W=0.3
a/W=0.5
a/W=0.7
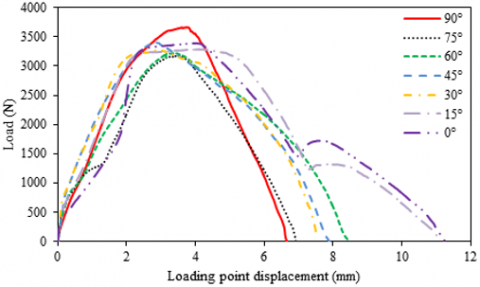
Figure 9. Load-displacement curve for not welded specimen
a/W=0.3
a/W=0.5
a/W=0.7
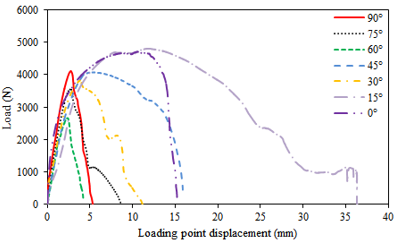
Figure 10. Load-displacement curve for welded specimen
Figures 9 and 10 show the results of mixed-mode fracture tests were performed on not welded and welded CTS specimens under various loading angles and for the three lengths of a notch (a/W=0.3, 0.5, and 0.7). The results obtained are the mean values of three tests for each specimen. The maximum load and displacement were determined using the load-displacement curves obtained by the test machine.
Results indicate that the load-displacement curves corresponding to specimens with notch lengths (a/W=0.3) peak at 90 degrees (mode I) and then gradually decrease as the loading angles decrease, indicating that the mode II components increase. The load-displacement curves for specimens with medium notch lengths (a/W=0.5) follow the same pattern as the curves obtained for short notch lengths (a/W = 0.3), but with fewer discrepancies between the curves. The trend of the load-displacement curve corresponding to specimens with longer crack lengths (a/W=0.7) is the same as observed for those specimens with short and medium notch lengths (Figure 9). It is noted, that the curves with α = 90° (loading in mode I) are rather stiff and reach a maximum then decrease quickly. The curves at α= 0° (loading in mode II pure shear) increase to reach a maximum then decreases gently to reach a minimum for a very significant displacement corresponding to a sliding. For loading angles between 15 and 75 corresponding to a mixed loading, the load-displacement curves reach a maximum and then gradually decrease as the loading angles decrease, which means that the mode II components increase.
The results reveal that the load-displacement curves of the welded CTS specimens follow the same trends as the not welded specimens, although with less significant values than those previously observed.
4.2 Stress intensity factors
Eqns. (1) and (2) developed by Richard [13] are used to compute the stress factors intensity $K_{I}$ and $K_{I I}$ in Compact Tension Shear specimen
$K_{I}=\frac{P \sqrt{\pi a}}{W t} \cos \alpha f_{I}\left(\frac{a}{W}\right)$ (1)
$K_{I I}=\frac{P \sqrt{\pi a}}{W t} \sin \alpha f_{I I}\left(\frac{a}{W}\right)$ (2)
where: P is the fracture load, a is the notch length, W is the specimen width, t is the specimen thickness, $f_{I}$ and $f_{I I}$ are the geometrical functions determined by an analysis of finite element and given by relations (3) and (4):
$f_{I}\left(\frac{a}{W}\right)=2,321582-14,3677\left(\frac{a}{W}\right)$
$+66,85752\left(\frac{a}{W}\right)^{2}$
$-117,66921\left(\frac{a}{W}\right)^{3}+89,72502\left(\frac{a}{W}\right)^{4}$ (3)
$f_{I I}\left(\frac{a}{W}\right)=-0,05741+4,36076\left(\frac{a}{W}\right)$
$-4,46168\left(\frac{a}{W}\right)^{2}$
$+2,48807\left(\frac{a}{W}\right)^{3}$ (4)
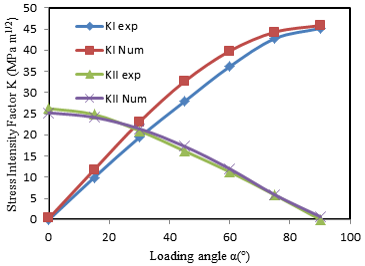
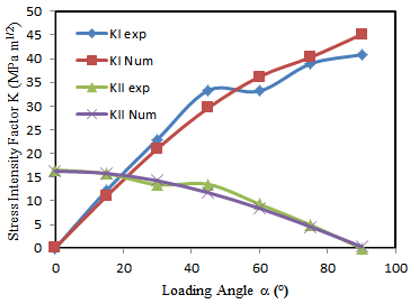
Figures 11 and 12 show the comparison of the results obtained numerically and experimentally of the stress intensity factors KI and KII as a function of the loading angles for not welded and welded CTS specimen for three lengths of notch (a/W = 0.3, 0.5, and 0.7).
a/W=0.3
a/W=0.5
a/W=0.7
Figure 11. Comparison between experimental and numerical stress intensity factors for not welded specimens
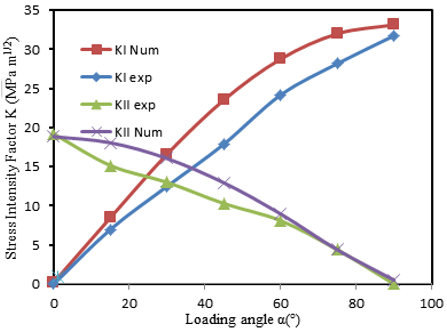
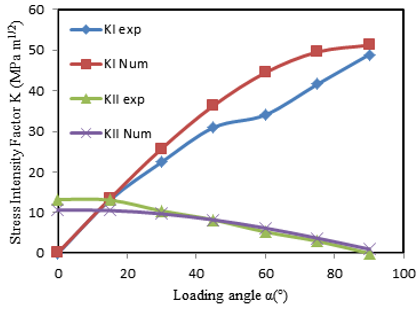
Figures 11 and 12 show the comparison of the results obtained numerically and experimentally of the stress intensity factors KI and KII as a function of the loading angles for not welded and welded CTS specimen for three lengths of notch (a/W = 0.3, 0.5 and 0.7).
For not welded specimens (Figure 11), the evolution of the stress intensity factors KI and KII in function of loading angles and the ratio a/w give best correlation between numerical and experimental results with slight difference especially for angles higher 50°. The raison of this difference is attributed to numerical calculation conditions comparatively to experimental results depending on the empirical equation of stress intensity factor.
a/W=0.3
a/W=0.5
a/W=0.7
Figure 12. Comparison between experimental and numerical stress intensity factors for welded specimens
Also for welded specimens (Figure 12), it is noticed a high difference for stress intensity factor KI in function of loading angles and ratio a/W. This is attributed to the level of compressive residual stress at the nugget comparatively to Heat Affected Zone or base metal (i.e., Low micro hardness in nugget zone) [30, 31] and the calculation in taking out of the empirical stress intensity factor compared to the numerical results using J-integral contour.
The influence of the notch length and loading angles on fracture characteristics in modes I and II of CTS welded specimens is investigated in experimental and numerical. The FSW welding procedure is used to join CTS specimens made of 3003 Al-alloy. The obtained results reveal that:
- The experimental and numerical analyses are in good accord.
- Two modes of loading are used, revealing that the greatest values of the stress intensity parameters in mode I are obtained for the CTS specimens with long lengths of notches (a/W=0.7).
- The stress intensity factor KII decreases as the loading angle increases, whereas the stress intensity factor KI increases for welded and not welded specimens.
- The loading angle has a value pivot where mode I become dominant.
This work is carried out in the laboratory of Materials and Reactive Systems of Djillali Liabes University of Sidi Bel Abbes which is sponsored by the direction of scientific and technological research (DGRST Algeria).
[1] Seed, G.M., Nowel, D. (1994). Use of the distributed dislocations method to determine the T-stress. Fatigue Fracture Engineering Materials Structures, 17: 605-618. https://doi.org/10.1111/j.1460-2695.1994.tb00259.x
[2] Richards, H.A., Benitz, K. (1993). A loading device for the creation of mixed-mode in fracture mechanics. International Journal of Fracture, 22: 55-58. https://doi.org/10.1007/BF00942726
[3] Arcan, M., Hashin, Z., Voloshin, A. (1978). A method to produce uniform plane-stress states with applications to fiber-reinforced materials. Experimental Mechanics, 18: 141-146. https://doi.org/10.1007/BF02324146
[4] Marsavina, L., Linul, E., Voiconi, T., Constantinescu, D.M., Apostol, D.A. (2015). On the crack path under mixed mode loading on PUR foams. Frattura ed Integrita Strutturale, 9: 387-396. https://doi.org/10.3221/IGF-ESIS.34.43
[5] Williams, J.G., Ewing, P.D. (1972). Fracture under complex stress – the angled crack problem. International Journal of Fracture, 8: 441-446. https://doi.org/10.1007/BF00191106
[6] Ueda, Y., Ikeda, K., Kao, T., Aoki, M. (1983). Characteristics of brittle fracture under general combined modes including those under bi-axial tensile loads. Engineering Fracture Mechanics, 18: 1131-1158. https://doi.org/10.1016/0013-7944(83)90007-3
[7] Awaji, H., Sato, S. (1978). Combined mode fracture toughness measurement by the disc test. Journal of Engineering Materials and Technology, 100(2): 175-182. https://doi.org/10.1115/1.3443468
[8] Shetty, D.K., Rosenfield, A.R., Duckworth, W.H. (1987). Mixed-mode fracture in biaxial stress state: application of the diametral-compression (Brazilian disk) test. Engineering Fracture Mechanics, 26(6): 825-840. https://doi.org/10.1016/0013-7944(87)90032-4.
[9] Amstutz, B.E., Sutton, M.A., Dawicke, D.S., Newman, J.C. (1995). An experimental study of COD for mode I/II stable crack growth in thin 2024-T3 aluminum specimen. ASTM STP 1256 on Fracture Mechanics, 26: 256-271. https://doi.org/10.1520/STP16388S
[10] Rikards, R., Buchholz, F.G., Wang, H.A., Bledzki, K.K., Korjakin, A. (1998). Investigation of mixed mode I/II interlaminar fracture toughness of laminated composites by using a CTS type specimen. Engineering Fracture Mechanics, 61(3-4): 325-342. https://doi.org/10.1016/S0013-7944(98)00068-X
[11] Madhusudhana, K.S., Narasimhan, R. (2002). Experimental and numerical investigations of mixed mode crack growth resistance of a ductile adhesive joint. Engineering Fracture Mechanics, 69(7): 865-883. https://doi.org/10.1016/S0013-7944(01)00110-2
[12] Pirondi, A., Nicoletto, G. (2002). Mixed mode I/II fracture toughness of bonded joints. International Journal of Adhesion and Adhesives, 22(2): 109-117. https://doi.org/10.1016/S0143-7496(01)00042-2
[13] Richard, H.A. (1984). Some theoretical and experimental aspects of mixed mode fracture. Proceedings of the 6th International Conference on Fracture (ICF6), New Delhi, India, pp. 3337-3344. https://doi.org/10.1016/B978-1-4832-8440-8.50358-6
[14] Aoki, S., Kishimoto, K., Yoshida, T., Sakata, M., Richard, H.A. (1990). Elastic-Plastic fracture behaviour of an aluminium alloy under mixed mode loading. Journal of the Mechanics and Physics of Solids, 38(2): 195-213. https://doi.org/10.1016/0022-5096(90)90034-2
[15] Valery, N. (1999). Shlyannikov mixed-mode static and fatigue crack growth in central notched and compact tension shear specimens. American Society for Testing and Material- ASTM STP, 1359: 279-294.
[16] Kim, J.K., Kim, C.S. (2002). Fatigue crack growth behaviour of rail steel under mode I and mixed mode loadings. Materials Science and Engineering: A, 338(1-2): 191-201. https://doi.org/10.1016/S0921-5093(02)00052-7
[17] Gómez, F.J., Elices, M., Berto, F., Lazzarin, P. (2007). Local strain energy to assess the static failure of U-notches in plates under mixed mode loading. International Journal of Fracture, 145: 29-45. https://doi.org/10.1007/s10704-007-9104-3
[18] Marsavina, L., Constantinescu, D.M., Linul, R., Stuparu, F.A., Apostol, D.A. (2016). Experimental and numerical crack paths in PUR foams. Engineering Fracture Mechanics, 167: 68-83. https://doi.org/10.1016/j.engfracmech.2016.03.043
[19] Borrego, L.P., Antunes, F.V., Costa, J.D., Ferreira, J.M. (2006). Mixed-mode fatigue crack growth behavior in aluminum alloys. International Journal of Fatigue, 28(5-6): 618-626. https://doi.org/10.1016/j.ijfatigue.2005.07.047
[20] Biner, S.B. (2001). Fatigue crack growth studies under mixed-mode loading. International Journal of Fatigue, 23(1): 259-263. https://doi.org/10.1016/S0142-1123(01)00146-3
[21] Tanaka, K. (1974). Fatigue crack propagation from a crack inclined to the cyclic tensile axis. Engineering Fracture Mechanics, 6(3): 493-507. https://doi.org/10.1016/0013-7944(74)90007-1
[22] Benarbia, D., Benguediab, M., Benguediab, S. (2013). Two-dimensional analysis of cracks propagation in structures of concrete. Engineering, Technology & Applied Science Research, 3(3): 429-432. https://doi.org/10.48084/etasr.300
[23] Richard, H., Linnig, K., Henn, W. (1991). Fatigue crack propagation under combined loading. Forensic Engineering, 3: 99-109.
[24] Antunes, F.V., Branco, R., Ferreira, J.M. Borrego, L.P. (2019). Stress intensity factor solutions for CTS mixed mode specimen. Frattura Integrità Strutturale, 13(48): 676-692. https://doi.org/10.3221/IGF-ESIS.48.64
[25] Houari, T., Benguediab, M., Belaziz, A., Kebir, T. (2020). Numerical modeling of high density polyethylene (HDPE) behavior using different fracture mechanics approaches. Annales de Chimie - Science des Matériaux, 44(3): 151-160. https://doi.org/10.18280/acsm.440302
[26] Lin, H.B., Li, Q., Ding, R. (2016). Simulation study on stress intensity factors of surface crack of hollow axle. Mathematical Modelling of Engineering Problems, 3(4): 179-183. https://doi.org/10.18280/mmep.030405
[27] Tan, Y.B., Wang, X.M., Ma, M., Zhang, J.X., Liu, W.C., Fu, R.D., Xiang, S.A. (2017). Study on microstructure and mechanical properties of AA 3003 aluminum alloy joints by underwater friction stir welding. Materials Characterization, 127: 41-52. https://doi.org/10.1016/j.matchar.2017.01.039
[28] Amrane, S. (2018). Design and Realization of a device for the mechanical characterization of materials in combined loading. Master, Department Mechanical Engineering, University of Sidi Bel Abbes, Algeria.
[29] Hibbitt, Karlsson, Sorensen. ABAQUS User’s manual version 2.7, 2014.
[30] Kambouz, Y.,Benguediab, M., Bouchouicha, B. (2017). Numerical study of the mechanical behavior and fatigue in a weld bead by friction stir for a 6082–T6 aluminum alloy. Mechanics and Mechanical Engineering, 21(1): 67-83.
[31] Senapati, P.N., Bhoi, R.K. (2020). Characterization of friction-stir welded joints of AA1100 by factorial design based hierarchical regression model. Annales de Chimie - Science des Matériaux, 44(4): 271-280. https://doi.org/10.18280/acsm.440406