Mohd Faizal Hasan* | Bemgba Bevan Nyakuma | Mohd Rosdzimin Abdul Rahman | Norazila Othman | Norhayati Ahmad | Mohd Farid Muhamad Said
© 2021 IIETA. This article is published by IIETA and is licensed under the CC BY 4.0 license (http://creativecommons.org/licenses/by/4.0/).
OPEN ACCESS
In the present study, torrefaction of palm kernel shell (PKS) and petcoke blends was performed for the production of solid biofuels with high energy density. The torrefaction process was performed for mixtures with various mixing ratios (by weight) from 90:10 to 60:40 (PKS:petcoke). For torrefaction under various temperatures of 250℃ to 300℃, the mixing ratio of 60:40 was used. Meanwhile, residence time and nitrogen flow rate were fixed at 30 minutes and 1 l/min, respectively. In general, the fixed carbon and ash contents increased, while the moisture and volatile matter contents decreased after torrefaction. It has been elucidated that mass yield is a dominant factor that affects the energy yield of torrefied mixtures rather than the higher heating value (HHV) ratio. Based on the energy yield and ultimate analysis, it was found that a higher amount of petcoke and higher temperature give better performance, thus causing the torrefied mixture to become very close to coals region in Van Krevelen diagram. In this case, the mixture with a mixing ratio of 60:40 torrefied under the temperature of 300℃ gives the best performance. It was also found that this mixture is thermally stable than the mixture torrefied at 250℃.
torrefaction, co-torrefaction, palm kernel shell, petcoke, petroleum coke
The availability of massive amounts of biomass residues requires an effective conversion method for utilization as a feedstock for thermal power generation. During palm oil extraction at palm oil mills, for example, various types of biomass residues are produced, such as palm kernel shell, mesocarp fibre and empty fruit bunch [1]. In addition, biomass wastes are also produced at palm plantations, such as oil palm fronds and oil palm trunks [1]. It is interesting to note that 90% of the total weight of the dry matter of the palm tree is oil palm biomass [1], which emphasizes the importance of utilizing them in order to prevent dumping, landfilling or open burning.
For combustion in boilers as example, various types of biomass have been mixed such as palm fibre and palm kernel shell with a ratio of 60:40 [2], pulverized empty fruit bunch and sawdust with a weight ratio of 50:50, and a mixture of palm kernel cake, EFB fibre and sawdust with a weight ratio of 30:5:65 [3]. Basically, the purpose of mixing various types of biomass is to improve the burning properties as well as to improve physical characteristics when converting into densified products such as briquette and pellets [2-4].
The combination of non-renewable fuels such as coal with biomass such as wood chips, softwood, and manure for co-firing was introduced many years ago with the aim to reduce the environmental problems caused by the combustion of fossil fuels as well as to reduce the high costs associated with the alternative technique [5]. Meanwhile, for gasification, the coal and biomass blends offer several advantages, such as the enhancement of calorific value and cold gas efficiency [6]. The combustion characteristics of biomass blended with petroleum coke (petcoke) for thermal power generation have been studied by several researchers [7, 8]. Tilman et al. [7] has described based on a case study that the slag formation is not impacted by the addition of petcoke during combustion. They also mentioned that the combination of petcoke and wood waste could offset the carbon in fly ash during combustion, thus revealing the advantage of mixing petcoke with other materials for combustion. A recent study performed by Kumar and Nandi [8] demonstrated that the addition of petcoke in the blends basically improve the overall energy density. Meanwhile, their analysis also revealed that an increase in biomass portion in the blends could improve the combustion efficiency through catalytic effects of alkali oxides. In another study [9], a pressurized fluidized bed for pressurized oxy-fuel combustion was introduced to reduce energy loss during the co-firing of coal and biomass for effective carbon capture and storage technology. They also proposed to expand the application of this combustion technique for various solid fuels such as sludge, petcoke and others [9].
Torrefaction is also known as mild pyrolysis, is one of the thermochemical conversion processes that is conducted under an inert or limited oxygen environment within temperature range of 200℃ to 300℃ to convert raw biomass into solid biochar as the main product [10]. Torrefaction does not only improve the hydrophobicity (decrease in moisture content) of the biomass, but also causes an increase in carbon content of the biomass, thus improving energy density and heating value of the biomass [11]. The other advantages of torrefaction are improvement in homogeneity and grindability of the biomass [12]. Under temperature range of 200℃ to 300℃, devolatilization occurs thus causes a decrease in volatile matter and increase in carbon content. Lignocellulosic compounds such as cellulose, hemicellulose and lignin experiences thermal degradation under this temperature range [12], thus causing a change to the chemical composition of biomass materials. The torrefied products produced from this pretreatment has potential to replace coal in the power generation sector [13]. The performance of torrefied biomass and coal blends have been investigated by Ozonoh et al. [14]. They found that the blend of coal and torrefied pine sawdust gives the optimum performance with a higher heating value of 28.27 MJ/kg and an enhancement factor of 1.41 [14]. In the other study [15], Is’yomin et al. (2020) investigated the fluidization of multicomponent beds that consisted of coal sludge and straw pellets for co-torrefaction [15].
As mentioned previously, torrefaction offers numerous advantages in terms of energy content, moisture content, composition homogeneity and others. However, it is inevitable that torrefaction causes a mass loss to the biomass due to degradation of lignocellulosic compounds [12]. Therefore, to reduce the effect of mass loss during torrefaction so that high energy yield could be maintained, it is important to mix the biomass with a more stable material (such as petcoke [16]). In addition, petcoke that is enriched with carbon has higher energy content if compared to coal [7], thus giving a viable performance when mixed with biomass residues. To the extent of our knowledge, even though the advantages of using combination of biomass and petcoke or petcoke only for combustion have been demonstrated by the previous studies, the torrefaction of this type of mixture has not been performed yet until present. Thus, this becomes the novelty of the present study, in which torrefaction was carried out for the mixture with combination of biomass and a relatively more stable material such as petcoke. The aim of the present study is to investigate the effect of torrefaction on the performance of biomass and petcoke mixture for various mixing ratios and torrefaction temperatures. The physical appearances and physicochemical properties of the raw and torrefied mixtures were also investigated.
2.1 Collection of raw materials and preparation
Two types of raw materials were used in the present study; palm kernel shell (PKS) and petcoke. PKS was collected from a near palm oil mill, while petcoke was unprocessed waste from the crude oil refining process obtained from a refinery company. Firstly, the materials were ground and sieved by using a sieve shaker machine (Brand: RETSCH, model: AS 200) to obtain particle size of below 500 µm. Next, both materials were mixed homogeneously for various mixing ratios of PKS to petcoke (90:10, 80:20, 70:30 and 60:40) by using a roller mixer. For the mixing process, the rotation and mixing duration were set to 165 rpm and 30 minutes, respectively.
2.2 Torrefaction process
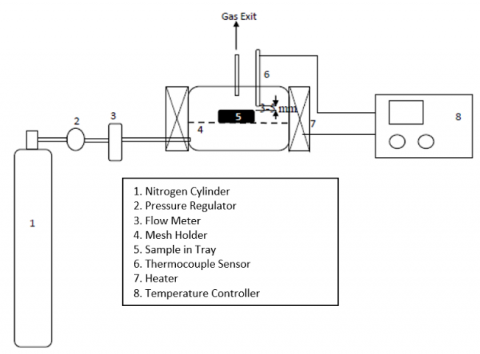
The experimental setup used for the torrefaction process has been published elsewhere [4], as shown by Figure 1 below. The K-type thermocouple tip was placed very close to the sample in the reactor. Hence, the vertical distance between the tip and the sample was around 3 to 5 mm. The accuracies for K-type thermocouple and flow meter are ±0.75% and ±4%, respectively. The mass of the sample before the torrefaction experiment was fixed at 18g.
Figure 1. Experimental setup for torrefaction [4]
Initially, the torrefaction reactor was purged with nitrogen for one hour to remove air from the reactor. The sample was then heated under a nitrogen environment to the desired temperature of 275℃. Once the desired temperature was reached, the measurement of residence time was started. After completion of the residence time of 30 minutes, the sample was allowed to cool and finally, the sample was removed from the reactor for further analysis. It is important to note that the nitrogen was continuously flowed throughout the torrefaction experiment until completion of the experiment. Throughout the experiment, the nitrogen flow rate was fixed at 1 l/min.
In the present study, the torrefaction was performed for various mixing ratios of 90:10, 80:20, 70:30 and 60:40 (PKS:petcoke), in which the temperature and residence time were fixed at 275℃ and 30 minutes, respectively. After that, the same procedures were used to perform torrefaction for various temperatures of 250℃, 275℃ and 300℃. In this case, the mixing ratio of PKS to petcoke and residence time were fixed at 60:40 and 30 minutes, respectively. For each operating condition, the experiment was repeated twice. The torrefaction experiment was conducted in a laboratory room completed with a ventilation system.
2.3 Determination of physicochemical properties
Once the sample was removed from the reactor after torrefaction pretreatment, it was weighed by a precision mechanical balance (U.S. Solid, model: USS-DBS3-3). The mass yield was then determined based on the following formula:
$Mass yield =\frac{ Mass \,\, after\,\, torrefaction }{ Mass\,\, before \,\, torrefaction }$ (1)
Next, the energy yield was calculated based on Eq. (2):
$Energy yield = HHV\,\, ratio \times Mass \,\, yield$ (2)
where higher heating value (HHV) ratio is given as follows:
$HHV ratio =\frac{H H V \,\, { after \,\, torrefaction }}{H H V\,\, { before \,\, torrefaction }}$ (3)
Based on Eq. (3), HHV of both raw materials and torrefied mixtures were determined by using bomb calorimetry (Model: IKA C2000, USA) based on the American Society for Testing Materials (ASTM) D240 standard. In the present study, higher heating value (HHV) was used to calculate the HHV ratio that leads to the results of energy yield. The higher heating value (HHV) has been used widely for torrefaction studies [11, 17, 18], so that energy yield can be calculated for various cases with different biomass types. In addition, the direct comparison with performance of commercial fuels such as coal also could be performed since most of the heating value data are presented as higher heating value (HHV). For instance, based on previous studies [19], the HHV of commercial coal is around 27.4 MJ/kg.
Proximate analysis was performed to determine moisture, volatile matter and ash contents based on ASTM D3173, D3175 and D3174 standards, respectively. The fixed carbon content was obtained by deducting the summation of the aforementioned contents from 100%. A chamber furnace was used (Brand: Carbolite, model: ELF 11/14B) for heating samples during the proximate analysis. For ultimate analysis, an elemental analyzer (Brand: Elementar, model: Vario Micro Cube) was used to determine the carbon, hydrogen and nitrogen contents (based on standard BS EN ISO 16948: 2015) as well as the sulfur content (based on standard DIN51724-3). Similar to previous studies [19, 20], the oxygen (O) content was estimated by deducting the summation of carbon (C), hydrogen (H), nitrogen (N), and sulfur (S) from 100 percent.
Samples of the torrefied mixtures were also sent to a laboratory for further study on the thermal decomposition behaviour. The thermal decomposition behaviour of the mixtures was investigated by using thermogravimetric analysis (TGA), in which it was performed by using a high precision analyzer (Model: TGA 4000 Perkin Elmer) under nitrogen environment. The temperature range, heating rate and nitrogen flow rate selected for the TGA analysis were 30℃ to 900℃, 10℃/min and 20 ml/min, respectively. From the TGA test, the graphs of weight percentage and derivate weight percentage were obtained.
In the present study, the TGA analysis was performed for mixtures with mixing ratio of 60:40 that were torrefied at minimum temperature of 250℃ and maximum temperature of 300℃.
3.1 Properties of raw materials
The results of ultimate analysis and higher heating value (HHV) for both palm kernel shell (PKS) and petcoke are shown in Table 1.
Table 1. Properties of PKS and petcoke
|
Analysis |
Element/ Property |
Symbol (Unit) |
PKS |
Petcoke |
|
Ultimate |
Carbon |
C (%) |
36.2647±1.1302 |
91.7085±0.5778 |
|
Hydrogen |
H (%) |
4.7438±0.1968 |
4.2399±0.1818 |
|
|
Nitrogen |
N (%) |
0.4057±0.0512 |
1.1461±0.0734 |
|
|
Sulfur |
S (%) |
0.2206±0.0099 |
0.9898±0.0528 |
|
|
Energy Content |
Higher Heating Value |
HHV (MJ/kg) |
15.26±0.64 |
36.54±0.49 |
The moisture, volatile matter, fixed carbon and ash contents of raw biomass PKS are 10.51±0.39%, 59.68±0.54%, 15.91±0.44% and 13.91±0.49%, respectively. Based on Table 1, it was found that the carbon composition of the petcoke is relatively high if compared to the commercial coals and similar to the petcoke used by the other studies (81.11%) [7, 21]. In addition, it is interesting to note that the petcoke used in the present study can be categorized as low-sulfur petcoke since the sulfur content obtained by the other study was 5.11% [7, 21].
3.2 Physical appearance and mass yield
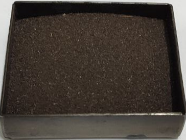
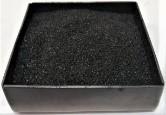
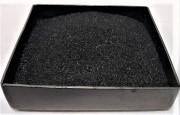
Figure 2 shows the physical appearances of the mixtures with various mixing ratios while the temperature and residence time were fixed at 275°C and 30 minutes, respectively. Figure 3 demonstrates the physical appearances of mixtures for various torrefaction temperatures, while the mixing ratio and residence time were fixed at 60:40 and 30 minutes, respectively. Based on both Figures 2 and 3, it can be observed that the surface colour of the samples becomes darker after torrefaction regardless of mixing ratio and temperature. The torrefaction experiment in the present study was successful because the physical appearance of ash could not be observed on the surface of solid products after torrefaction, thus revealing the combustion did not occur during torrefaction.
Figure 4 shows the results of mass yield for various mixing ratios and torrefaction temperatures, in which several abbreviations were introduced. For instance, “PKS90-T275” represents the mixture with a weight ratio of 90:10 (PKS:petcoke) torrefied under the temperature of 275℃. In general, it was found that the mass of all mixtures decreases after torrefaction due to the occurrence of devolatilization during the torrefaction process. Based on the proximate analysis conducted in the other study, the volatile matter of petcoke was 13.9% [7, 21], which was considered low, thus implying the high stability of the petcoke. Therefore, PKS with relatively high volatile matter content (around 59.7%) is supposed to be the main contributor to the drop in mass after torrefaction. This scenario causes the mass yield of the torrefied mixtures to increase from 0.664 to 0.801 (66.4% to 80.1%) with an increase in petcoke portion from 10% to 40%, as demonstrated by Figure 4. In addition, Figure 4 demonstrates that the mass yield drops from 0.838 to 0.741 (83.8% to 74.1%) when the torrefaction temperature is increased from 250℃ to 300°C, thus elucidating the torrefaction becomes more severe with an increase in torrefaction temperature. Within the temperature range used in the present study (250℃ to 300℃), the mass drop of all mixtures was mainly contributed by the decomposition of hemicellulose and cellulose [22].
|
Mixing ratio (PKS:Petcoke) |
Before Torrefaction |
After Torrefaction |
|
90:10 |
||
|
80:20 |
||
|
70:30 |
||
|
60:40 |
Figure 2. Physical appearances of raw and torrefied mixtures for various mixing ratios
|
Raw |
250°C |
275℃ |
300℃ |
Figure 3. Physical appearances of raw and torrefied mixtures for various temperatures
Figure 4. Results of mass yield
3.3 Energy yield, proximate analysis and ultimate analysis
Figure 5 shows the HHV of mixtures for various mixing ratios and torrefaction temperatures. In general, it was found that HHV increases after torrefaction due to the significant removal of volatile matter and increase in carbon content. For various mixing ratios, PKS60-T275 gives the highest HHV after torrefaction, which is 25.87 MJ/kg. This is because PKS60-T275 has the highest composition of petcoke, thus leading to the highest carbon percentage. Meanwhile, for various torrefaction temperatures, PKS60-T300 gives the highest HHV, which is 27.47 MJ/kg. When the temperature is increased, torrefaction becomes more severe due to more significant devolatilization, thus causing the carbon content to increase.
Figure 6 shows the results of mass yield, HHV ratio and energy yield for various mixing ratios. It was found that PKS90-T275 has the lowest energy yield, while PKS60-T275 has the highest energy yield, that are 0.760 and 0.874, respectively. Although PKS60-T275 has the lowest HHV ratio of 1.090, it has the highest mass yield of 0.8013, which results in the highest energy yield. This scenario elucidates that the mass yield is a dominant factor that affects energy yield rather than the HHV ratio.
Figure 5. HHV of mixtures for before and after torrefaction
Figure 6. Mass yield, HHV ratio and energy yield for cases with different mixing ratios
Figure 7. Mass yield, HHV ratio, and energy yield for cases with different torrefaction temperatures
Figure 7 demonstrates that when the torrefaction temperature is increased from 250℃ to 300℃, energy yield slightly decreases from 0.889 (88.9%) to 0.858 (85.8%). Similar to the cases with different mixing ratios, the slight decrease in energy yield is due to the more substantial effect of mass yield drop if compared to the effect of increment in HHV ratio. In addition, it is interesting to note that even though the mixture with a weight ratio of 60:40 was torrefied under sufficiently high temperature of 300℃, a sufficiently high energy yield of 0.858 (85.8%) was still possible to be obtained. Furthermore, this operating condition yielded an energy content (HHV) of 27.47 MJ/kg, exceeding the HHV of commercial coals (around 27 MJ/kg) [19, 23].
Figure 8 shows the results of proximate analysis for all mixtures before torrefaction. Here, PKS90, PKS80, PKS70 and PKS60 represent raw mixtures with mixing ratio (PKS:petcoke) of 90:10, 80:20, 70:30 and 60:40, respectively. Meanwhile, Table 2 shows the standard deviation for the results of proximate analysis. It can be said that moisture content decreases with an increase in the petcoke portion. Besides, it can be clearly observed that fixed carbon content increases while volatile matter decreases with an increase in petcoke portion, which is mainly due to the very high percentage of carbon content in the raw petcoke, as shown by Table 1. The figure also demonstrates the fluctuation of ash content within the range of 11.9% to 14.8%.
Figure 8. Proximate analysis for all mixtures before torrefaction
Table 2. Standard deviation for proximate analysis of mixtures before torrefaction
|
|
SD for Moisture (%) |
SD for volatile (%) |
SD for fixed carbon (%) |
SD for ash (%) |
|
PKS90 |
0.3 |
1.3 |
1.7 |
0.2 |
|
PKS80 |
0.1 |
0.5 |
0.4 |
0.1 |
|
PKS70 |
0.2 |
0.1 |
1.0 |
0.9 |
|
PKS60 |
0.2 |
0.2 |
0.1 |
0.4 |
Note: “SD” represents for standard deviation
Figure 9 demonstrates the results of proximate analysis for all mixtures after torrefaction. Meanwhile, Table 3 shows the standard deviation for the results of proximate analysis. It was found that torrefaction improves the hydrophobicity nature of all mixtures, in which the moisture contents obtained after torrefaction were in the range of 2.1% to 4.2% only, whereas the moisture contents obtained before torrefaction were in the range of 6.5% to 9.5%. When the torrefaction temperature is increased, the torrefaction becomes more severe, thus the degree of degradation of hydroxyl groups that are responsible for binding moisture in the samples becomes higher [24]. This causes the decrease in moisture content with an increase in temperature. In general, it was found that the torrefaction process causes an increase in fixed carbon content and a decrease in volatile matter due to the significant devolatilization during torrefaction. The same trend was obtained when torrefaction temperature was increased. When the petcoke portion and torrefaction temperature are increased, volatile matter decreases while fixed carbon increases. Based on Figure 8 and 9, it was found that regardless of mixing ratio and torrefaction temperature, the ash content of all mixtures increases after torrefaction. This is because the ash content is further concentrated due to the occurrence of devolatilization during torrefaction [25, 26]. Based on Figure 9, the trend of ash content for various mixing ratios is not clear, fluctuating within the range of 21 to 26%. Meanwhile, for various torrefaction temperatures, it was found that ash content slightly increases with an increase in temperature.
Figure 9. Proximate analysis for all mixtures after torrefaction
The ultimate analysis was performed for cases with different torrefaction temperatures, in which the results are shown in Table 4. In general, it was found that carbon content increases after torrefaction and further increases with an increase in torrefaction temperature. Based on the correlation between HHV and elemental composition introduced in a recent study [27], the increase in carbon content is the main factor that contributes to the increment in HHV, thus improving the quality of biofuels produced. Besides, the hydrogen element is slightly removed during torrefaction due to the decrement in hydrogen content after torrefaction. In addition, it was found that nitrogen increases after torrefaction and further increases with an increase in torrefaction temperature, which is mainly due to the behaviour of the nitrogen element that most of them are remained intact in the solid biomass after torrefaction [28]. Finally, it can be observed that sulfur content just increases slightly after torrefaction and even when the temperature is increased.
Figure 10 shows the Van Krevelen diagram for raw mixture and mixtures torrefied at different temperatures. As observed, the raw mixture (before torrefaction) falls under the peat region and closes to the lignite region. In this case, the use of petcoke in the mixture causes the raw mixture to become competitive with lignite. After torrefaction at temperature of 250℃, the torrefied mixture falls under the lignite region. Meanwhile, the mixtures torrefied under temperatures of 275℃ and 300℃ fall under the area very close to coals. Based on this diagram, it can be said that the best performance could be obtained when the mixture with a weight ratio of 60:40 (PKS:petcoke) was torrefied under the temperature of 300℃.
Table 3. Standard deviation for proximate analysis of mixtures after torrefaction
|
|
SD for Moisture (%) |
SD for volatile (%) |
SD for fixed carbon (%) |
SD for ash (%) |
|
PKS90-T275 |
0.6 |
0.3 |
1.2 |
1.4 |
|
PKS80-T275 |
0.2 |
1.7 |
2.3 |
0.7 |
|
PKS70-T275 |
0.3 |
2.3 |
0.9 |
1.0 |
|
PKS60-T275 |
0.2 |
0.5 |
1.2 |
1.2 |
|
PKS60-T250 |
0.3 |
0.9 |
1.0 |
1.9 |
|
PKS60-T275 |
0.2 |
0.5 |
1.2 |
1.2 |
|
PKS60-T300 |
0.1 |
1.0 |
0.5 |
0.8 |
Note: “SD” represents for standard deviation
Table 4. Results of ultimate analysis
|
|
Symbol (Unit) |
Raw Mixture (60:40) |
PKS60-T250 |
PKS60-T275 |
PKS60-T300 |
|
Carbon |
C (%) |
60.9492±1.8853 |
65.2842±1.9147 |
69.3609±2.3987 |
71.3640±2.9524 |
|
Hydrogen |
H (%) |
4.9935±0.0418 |
4.4616±0.1544 |
4.4290±0.0383 |
4.1776±0.1429 |
|
Nitrogen |
N (%) |
0.6898±0.0675 |
0.7700±0.0487 |
0.8747±0.1660 |
0.9058±0.1116 |
|
Sulfur |
S (%) |
0.4022±0.0083 |
0.4200±0.0068 |
0.4380±0.0060 |
0.4826±0.0076 |
|
Oxygen |
O (%) |
32.9652 |
29.0642 |
24.8975 |
23.0700 |
|
H/C ratio |
- |
0.9762 |
0.8143 |
0.7608 |
0.6975 |
|
O/C ratio |
- |
0.4060 |
0.3342 |
0.2694 |
0.2427 |
Figure 10. Van Krevelen diagram for raw and torrefied mixtures
3.4 Thermal decomposition of torrefied mixtures
Figures 11 and 12 show the thermogravimetric (TG) and derivative thermogravimetry (DTG) curves for the mixtures torrefied at minimum temperature of 250℃ and maximum temperature of 300℃.
In general, it can be said that both mixtures experience thermal decomposition due to drying, heating, devolatilization and char aggregation [29]. Figure 11 demonstrates that TG plot moves to the right when torrefaction temperature is increased from 250℃ to 300℃, thus indicating the thermal stability is increased with an increase in torrefaction temperature.
Based on both Figure 11 and 12, it can be observed that from initial point until temperature of around 130℃, both torrefied mixtures experience drying process, in which the evaporation of water occurs. Then, within temperature range of 200℃ to 650℃, both torrefied mixtures experience devolatilization, in which most of the volatile matter are removed during this stage. Based on Figure 12, the case of PKS60-T300 has lower peak, thus indicating lower derivative weight (or degradation rate) if compared to the case of PKS60-T250. The higher stability for the case of PKS60-T300 is mainly caused by the less amount of volatile matter that still remained after torrefaction experiment, in which the torrefaction experiment was conducted prior to this analysis.
Figure 11. TG curves for torrefied mixtures
Figure 12. DTG curves for torrefied mixtures
The torrefaction of palm kernel shell (PKS) and petcoke mixtures was successfully performed for various mixing ratios and torrefaction temperatures. It was found that mass yield is a dominant factor that affects energy yield rather than the HHV ratio. In the present study, no significant difference in energy yield was observed for various torrefaction temperatures. Meanwhile, for various weight ratios, it was found that energy yield becomes the highest when the amount of petcoke used is highest. In general, fixed carbon and ash content increase while moisture and volatile matter contents decrease after torrefaction. Based on the overall results, especially in terms of energy yield and ultimate analysis, it can be concluded that a mixture with a higher amount of petcoke and higher temperature gives better performance, approaching the performance of coal. When considering both aspects of the utilization of biomass and the excellent performance of solid fuel, it can be concluded that the mixture with a weight ratio of 60:40 (PKS:petcoke) torrefied under the temperature of 300℃ can fulfil these requirements. Based on thermogravimetric analysis (TGA), it was found that this mixture is thermally stable than the mixture torrefied at 250℃.
This work is supported by the Ministry of Higher Education Malaysia and Universiti Teknologi Malaysia through Tier 2 grant (VOT No.: Q.J130000.2651.16J28). The authors also acknowledge Muhammad Ariff Hanaffi Mohd Fuad (Ph.D. student), Mohd Najib Shawalluddin (Master Project student), Muhammad Najmi Mohd Rashdan and Mohamad Syafiq Haqimi Jum’atuddin (Undergraduate students) for their technical supports and helps.
[1] Sukiran, M.A., Abnisa, F., Wan Daud, W.M.A., Abu Bakar, N., Loh, S.K. (2017). A review of torrefaction of oil palm solid wastes for biofuel production. Energy Conversion and Management, 149: 101-120. https://doi.org/10.1016/j.enconman.2017.07.011
[2] Husain, Z., Zainac, Z., Abdullah, Z. (2002). Briquetting of palm fibre and shell from the processing of palm nuts to palm oil. Biomass and Bioenergy, 22: 505-509. https://doi.org/10.1016/S0961-9534(02)00022-3
[3] Nasrin, A.B., Ma, A.N., Choo, Y.M., Mohamad, S., Rohaya, M.H., Azali, A., Zainal, Z. (2008). Oil palm biomass as potential substitution raw materials for commercial biomass briquettes production. American Journal of Applied Sciences, 5(3): 179-183.
[4] Hasan, M.F., Hielfarith Suffri, S., Harif, M.H., Mohd Fuad, M.A.H, Mohd Rosdzimin, A.R., Md. Mizanur, R., Latiff, Z.A. (2018). Torrefaction of densified mesocarp fibre and palm kernel shell. Renewable Energy, 122: 419-428. https://doi.org/10.1016/j.renene.2018.01.118
[5] Sami, M., Annamalai, K., Wooldridge, M. (2001). Co-firing of coal and biomass fuel blends. Progress in Energy and Combustion Science, 27: 171-214. https://doi.org/10.1016/S0360-1285(00)00020-4
[6] Seo, M.W., Goo, J.H., Kim, S.D., Lee, S.H., Choi, Y.C. (2010). Gasification characteristics of coal/biomass blend in a dual circulating fluidized bed reactor. Energy Fuels, 24(5): 3108-3118. https://doi.org/10.1021/ef100204s
[7] Tilman, D.A., Duong, D.N.B., Harding, N.S. (2012). Chapter 4 – Blending coal with biomass: Cofiring biomass with coal. Solid Fuel Blending, 125-200.
[8] Kumar, P., Nandi, B.K. (2022). Combustion characteristics of coal, petroleum coke, biomass, and their ternary blends. Journal of Energy Resources Technology, 144(1): 012302. https://doi.org/10.1115/1.4052469
[9] Liu, Q., Zhong, W., Yu, A., Wang, C.H. (2021). Co-firing of coal and biomass under pressurized oxy-fuel combustion mode: Experimental test in a 10 kWth fluidized bed. Chemical Engineering Journal, 133457. https://doi.org/10.1016/j.cej.2021.133457
[10] Basu, P. (2018). Biomass Gasification, Pyrolysis and Torrefaction-Practical Design and Theory. Academic Press.
[11] Nyakuma, B.B., Ahmad, A., Johari, A., Abdullah, T.A.T., Oladokun, O. (2014). Torrefaction of pelletized oil palm empty fruit bunches. The 21st International Symposium on Alcohol Fuels. Gwangju, Korea, pp. 10-14. https://arxiv.org/abs/1505.05469.
[12] Limousy, L., Jeguirim, M., Labaki, M. (2017). Chapter 11-Energy applications of coffee processing by-products. Handbook of Coffee Processing By-Products, Academic Press, pp. 323-367. https://doi.org/10.1016/B978-0-12-811290-8.00011-6
[13] Negi, S., Jaswal, G., Dass, K., Mazumder, K., Elumalai, S. (2020). Torrefaction: A sustainable method for transforming agri-wastes to high energy density solids (biocoal). Reviews in Environmental Science and Biotechnology, 19: 463-488. https://doi.org/10.1007/s11157-020-09532-2
[14] Ozonoh, M., Oboirien, B.O., Daramola, M.O. (2020). Optimization of process variables during torrefaction of coal/biomass/waste tyre blends: Application of artificial neural network & response surface methodology. Biomass and Bioenergy, 143: 105808. https://doi.org/10.1016/j.biombioe.2020.105808
[15] Is’yomin, R.L., Kuz’min, S.N., Mikhalyov, A.V., Milovanov, O.Y., Klimov, D.V., Nebyvaev, A.V., Khaskhachikh (2020). Fluidization of a multicomponent bed in a reactor for co-torrefaction of waste coal and biomass. Journal of Engineering Physics and Thermophysics, 93: 750-756. https://doi.org/10.1007/s10891-020-02175-8
[16] Petro online (2015). What is Petcoke? And What is it Used For? https://www.petro-online.com/news/fuel-for-thought/13/breaking-news/what-is-petcoke-and-what-is-it-used-for/33235, accessed on 21 December 2021.
[17] Li, S.X., Chen, C.Z., Li, M.F., Xiao, X. (2018). Torrefaction of corncob to produce charcoal under nitrogen and carbon dioxide atmospheres. Bioresource Technology, 249: 348-353. https://doi.org/10.1016/j.biortech.2017.10.026
[18] Grigiante, M., Antolini, D. (2015). Mass yield as guide parameter of the torrefaction process. An experimental study of the solid fuel properties referred to two types of biomass. Fuel, 153: 499-509. http://dx.doi.org/10.1016/j.fuel.2015.03.025
[19] Du, M., Yang, Z., Fan, J. (2018). Study on the inference factors of Huangling coking coal pyrolysis. IOP Conference Series: Earth and Environmental Science. IOP Publishing, pp. 1-6.
[20] Chen, W.H., Lu, K.M., Liu, S.H., Tsai, C.M., Lee, W.J., Lin, T.C. (2013). Biomass torrefaction characteristics in inert and oxidative atmospheres at various superficial velocities. Bioresource Technology, 146: 152-160. https://doi.org/10.1016/j.biortech.2013.07.064
[21] Tilman, D. (1999). Biomass Cofiring: Field Test Results. Palo Alto, CA: Electric Power Research Institute.
[22] Ninduangdee, P., Kuprianov, V.I., Cha, E.Y., Kaewrath, R., Youngyuen, P., Atthawethworawuth, W. (2015). Thermogravimetric studies of oil palm empty fruit bunch and palm kernel shell: TG/DTG analysis and modelling. Energy Procedia, 79: 453-458. https://doi.org/10.1016/j.egypro.2015.11.518
[23] Mohd Fuad, M.A.H., Hasan, M.F., Ani, F.N. (2019). Microwave torrefaction for viable fuel production: A review on theory, affecting factors, potential and challenges. Fuel, 253: 512-526. https://doi.org/10.1016/j.fuel.2019.04.151
[24] Dyjakon, A., Noszczyk, T., Smedzik, M. (2019). The influence of torrefaction temperature on hydrophobic properties of waste biomass from food processing. Energies, 12: 1-17. https://doi.org/10.3390/en12244609
[25] Tumuluru, J.S. (2016). Effect of deep drying and torrefaction temperature on proximate, ultimate composition, and heating value of 2-mm lodgepole pine (Pinus contorta) grind. Bioengineering (Basel), 3: 2-18. https://doi.org/10.3390/bioengineering3020016
[26] Oyebode, W.A., Ogunsuyi, H.O. (2021). Impact of torrefaction process temperature on the energy content and chemical composition of stool tree (Alstonia congenisis Engl) woody biomass. Current Research in Green and Sustainable Chemistry, 4: 100115. https://doi.org/10.1016/j.crgsc.2021.100115
[27] Huang, Y.F., Lo, S.L. (2020). Predicting the heating value of lignocellulosic biomass based on elemental analysis. Energy 191: 116501. https://doi.org/10.1016/j.energy.2019.116501
[28] Uemura, Y., Sellappah, V, Trinh, T.H., Hassan, S., Tanoue, K. (2017). Torrefaction of empty fruit bunches under biomass combustion gas atmosphere. Bioresource Technology, 243: 107–117. https://doi.org/10.1016/j.biortech.2017.06.057
[29] Nyakuma, B.B., Johari, A., Ahmad, A., Abdullah, T.A.T. (2014). Thermogravimetric analysis of the fuel properties of empty fruit bunch briquettes. Jurnal Teknologi, 67: 79-82. https://doi.org/10.11113/jt.v67.2768