Yuan Wang* | Jianli Liu
© 2021 IIETA. This article is published by IIETA and is licensed under the CC BY 4.0 license (http://creativecommons.org/licenses/by/4.0/).
OPEN ACCESS
Green concrete wall-building composite materials (namely GBMs, green building materials for short) have superior mechanical properties and good durability, thus they are now a high-profile topic in relevant research field. However, due to the existence of risk factors such as the high initial cost, and unclear policy direction, the promotion of GBMs has been greatly limited. In this context, it is a necessary work to study the cost control of construction projects, and figure out the relationship between the saving of building operating cost and the increase of initial construction cost. For this purpose, this study experimented on the optimal mix ratios of GBMs to control the construction budget of engineering projects. At first, this paper modeled the strain-hardening and steady-state cracking of GBMs, and constrained the models based on the bridging rule, the energy criterion, and the strength criterion. Then, this paper constructed a fractal model for the dense effect of powder particles in the aggregates of the GBMs, and analyzed its fractal features; after that, this paper designed the mix ratios of GBMs and experimented on the mechanical properties; at last, this paper constructed a production cost-use benefit model of the GBMs, completed the construction budget control of the engineering project, and gave experimental results of the performance of GBMs and the use cost calculation and analysis results.
building materials, mix ratio, construction cost, production cost, use benefit
Concrete is the mostly widely used construction material in various buildings, roads, and bridges, and it is the largest man-made product in the world. However, with the development of the times, ordinary concrete can no longer meet the design and construction requirements of today's buildings [1-6], and the emerging GBMs, as new-type, high-performance, and environmental-friendly materials, have attracted the attention of field scholars at home and abroad for its superior mechanical properties and good durability [7-10].
At present, a difficulty in promoting GBMs is the economy and other external issues of the construction projects. The Chinese government is now advocating to build China into an eco-friendly and resource-saving country. Although the promotion and use of GBMs is in line with this policy, the high initial cost and the unclear policy direction have resulted in many risk factors, which has greatly limited the development of the unprofitable GBMs [11, 12]. However, in terms of the entire life cycle of the buildings, the use of GBMs can save the operating cost of the buildings in later stages [13-15]. To explore the relationship between the saving of operating cost of the buildings in later stages and the increase of construction cost in initial stage, carrying out research on construction cost control is a necessity.
Nambram et al. [16] combined building information modeling with life cycle assessment to calculate the environmental impact of buildings that use non-load-bearing wall components made of different materials, then it determined the optimal building component options from both economic and environmental perspectives. Wan [17] proposed that GBMs not only effectively improve the quality of construction projects, but also have a significant impact on the cost management of construction projects. On this basis, Lee [18] revised a dynamic computable general equilibrium GTAP model to incorporate the circular economy mechanism of recycled GBMs, then the study collected data to estimate and construct the entire supply chain and sales chain of recycled GBMs. Ustaoglu et al. [19] proposed a new-type green structural component with excellent thermal insulation performance, and studied its energy-saving effect in electric-heating buildings in different climate provinces. Kumar [20] employed a life-cycle method to study the optimal insulation thickness of 4 types of insulation materials and 15 types of building materials, then it adopted an analysis and optimization method based on the degree-day method and life cycle cost analysis, and the objective function was the minimization of the life cycle cost corresponding to the decision variables. Gendelis et al. [21] adopted a comprehensive cost calculation method to analyze each house-hold in detail, it integrated different insulation materials, various building types, two types of windows, with various heating systems to obtain the same calculated annual energy consumption.
Statistics showed that existing studies mostly focused on the overall economic input and benefits of green buildings in the entire life cycle, few of them have concerned about the strategies for saving the production and use costs of building materials. To fill in this research gap, this paper experimented on the optimal mix ratios of GBMs to control the cost budget of construction projects. The main content of this paper contains five parts: (1) Model the strain-hardening and steady-state cracking of GBMs, and constrain the models based on the bridging rule, the energy criterion, and the strength criterion; (2) Construct a fractal model for the dense effect of powder particles in the aggregates of the GBMs and analyzed its fractal features; (3) Designed the mix ratios of GBMs and experiment on its mechanical properties; (4) Construct a production cost-use benefit model of the GBMs and completed the construction budget control of the engineering project; (5) Give experimental results of the performance of GBMs and the use-cost calculation and analysis results.
2.1 Basic design
The optimization of GBMs needs to build models for the strain-hardening and steady-state cracking of the materials based on micromechanics and fracture mechanics, and then use the models to predict whether the designed GBMs could reach the optimal mix ratios that meet the performance requirements for strain-hardening, good durability, and high ductility. This paper constructed and constrained the models from three perspectives: the bridging rule, the energy criterion, and the strength criterion.
The bridging rule in the steady-state cracking model refers to the relationship between the bridging stress γ (acting between the mixed green fiber and the cement matrix) and crack width ξ after cracks appear in the GBMs, it can connect the macroscopic performance of the building materials with their microscopic properties.
The relationship between load E and crack width ξ is derived based on the process of pulling out a single green fiber from the cement matrix, then the γ-ξ relationship can be derived from it. The process of pulling out a single green fiber from the cement matrix can be divided into two stages: debonding stage, and slipping stage. First, the green fiber undergoes elastic deformation under the action of load E, then, the green fiber slips from the cement matrix. Assuming: rQW represents the equivalent diameter of the green fiber, MOQW represents the elastic modulus of the green fiber, ε0 represents the sliding friction stress between the green fiber and the cement matrix, k represents the length of the green fiber, then, Formula 1 below gives the E-ξ relationship:
$E(\xi)=\pi \sqrt{\frac{M O_{Q W} r_{Q W}^{3} \varepsilon_{0} \xi}{2}} \quad \xi<\xi_{0}$ (1)
$\xi_{0}=\frac{2 k^{2} \varepsilon}{M O_{Q W} r_{Q W}}$ (2)
After completely debonding from the cement matrix, the green fiber begins to slip out from the cement matrix under the action of E. Since the friction stress ε0 between the green fiber and the cement matrix is a fixed value, the E-ξ relationship at this stage can be described by Formula 3:
$E(\xi)=\pi \varepsilon_{0} k r_{Q W}\left[1-\frac{\xi-\xi_{0}}{k}\right] \quad \xi_{0}<\xi<k$ (3)
Under actual working conditions, GBMs often adopt chopped green fibers that are distributed disorderly in random three-dimensional directions. Assuming: g represents the braking coefficient of the green fiber, ψ represents the angle between the green fiber and the normal of the crack surface, then, then the load E is a function of ψ:
$E(\psi)=E(\psi=0) e^{g_{\varphi}}$ (4)
The type of the green fiber determines the slippage displacement X of the fiber and the friction shear strength ε of the crack surface. In this paper, a slippage hardening coefficient α was used to characterize the non-linear increase of the load after the green fiber completely detached from the cement matrix, then, there is:
$\varepsilon=\varepsilon_{0}\left(1+\alpha \frac{X}{r_{Q W}}\right)$ (5)
The continuous interaction between the green fiber and the cement matrix will eventually lead to the separation of the two. In this paper, an apparent strength reduction coefficient u was used to characterize this state. Assuming: γdrm represents the apparent tensile strength of the green fiber, then, there is:
$\gamma_{d r}=\gamma_{d r}^{m} p^{-u_{\psi}}$ (6)
Based on the above-mentioned experiment on the pulling out of a single green fiber from the cement matrix, the E-ξ relationship of a single green fiber could be obtained. Then, through statistical methods, the γ-ξ relationship of the GBMs could be obtained. Assuming: UQW represents the volume content of green fibers in the GBMs, function E(ξ) represents the relationship between the pulling load E of a single green fiber and the crack width ξ, e(ψ) represents the function of the angle between the green fiber and the normal line of the crack surface, e(c) represents the function of the distance between the center of gravity of the green fiber and the crack surface, then, there is:
$\gamma(\xi)=\frac{4 U_{Q W}}{\pi r_{Q W}^{2}} \int_{\psi=0}^{\pi / 2} \int_{\varepsilon=0}^{\left(K_{Q \pi} / 2\right) / \cos \psi} E(\xi) e(\psi) e(c) d c d \psi$ (7)
In order to effectively reduce the probability of green fibers breaking in the cement matrix, during the design stage, comprehensive consideration needs to be given to the critical embedded length of green fibers. Assuming: FRr represents the fracture toughness of the interface, then Formula 8 below gives the calculation formula for the critical embedded length of green fibers under ideal conditions:
$K_{p}=\frac{\gamma_{d r} r_{Q W}}{4 \varepsilon_{0}}$ (8)
Under actual conditions, the critical embedded length of green fibers can be calculated by Formula 9:
$K_{p}^{\prime}=\frac{\gamma_{d r} r_{Q W}}{4 \alpha \varepsilon_{0}} p^{-(g+u) \psi}-\sqrt{\frac{8 F R_{r} M O_{Q W} r_{Q W}(1+\omega)}{4 \varepsilon_{0}}}$ (9)
When g=u=FRr=0, Formula 8 is equivalent to Formula 9.
Based on the theory of the mechanics of fracture, the following two conditions must be met so that the GBMs subjected to direct tension could achieve steady-state cracking and multi-slit cracking.
Condition 1: Assuming DER represents the critical normalized crack radius, L represents the toughness of the normalized cement matrix, LMAX represents the toughness of the critical normalized cement matrix, then Formula 10 gives the restraint for cracks to develop in the steady-state mode:
$L=\frac{2}{\sqrt{\pi}} D E_{R}\left(\frac{2}{3} \sqrt{D E_{R}}-\frac{1}{2} D E_{R}\right) \quad\left(0 \leq D E_{R} \leq 1\right)$ (10)
$L \leq L_{M A X}$ (11)
Condition 2: Assuming DENR represents the minimum size of normalized cracks, DE represents the initial size of normalized cracks; in order to make the GBMs show steady-state cracking and multi-slit cracking at the same time, besides satisfying the above two formulas, the following inequality needs to be satisfied as well:
$D E_{N R} \leq D E$ (12)
In order to further realize the strain-hardening characteristics of the GBMs, in addition to the bridging rule, the GBMs also need to meet the energy criterion and the strength criterion.
In the strain-hardening model, it’s assumed that, FRP represents the fracture toughness of the crack tip when the cement matrix of the GBMs cracks, FR'E represents the residual fracture energy in case of the maximum bridging stress of the green fiber. The energy criterion requires that Jtip must be smaller than FR'E. Assuming γS and ξS represent the steady-state cracking stress and the corresponding crack width; γF and ξF represent the maximum bridging stress of the green fiber and the corresponding crack width; LN and MON represent the fracture toughness and the elastic modulus of the cement matrix; then, under the condition of a relatively low green fiber content, FRP can be approximated as the toughness of the cement matrix, then, there is:
$F R_{P}=L_{N}^{2} / M O_{N}$ (13)
$F R_{P} \leq \gamma_{F} \xi_{F}-\int_{0}^{\xi_{F}} \gamma(\xi) d \xi=F R_{E}^{\prime}$ (14)
Assuming: γDE represents the initial cracking stress of the GBMs, the strength criterion requires that γDE must be smaller than γF. If the GBMs cannot meet the strength criterion, it can be judged that the load E acting on the GBMs exceeds γF, the green fibers will be broken or pulled out, therefore the load E couldn’t be effectively transmitted, and more cracks couldn’t be formed. Formula 15 gives the expression of the strength criterion:
$\gamma_{D E}<\gamma_{F}$ (15)
2.2 The optimization design
Since the GBMs are anisotropic composite materials, the various microscopic parameters have the anisotropic characteristics, so, it’s necessary to introduce the real dispersion state of green fibers inside the materials to modify the design idea, thereby obtaining the accurate characterization of the stress-strain constitutive relationship of the GBMs during the cracking process.
Assuming UQWE represents the volume percentage of effective green fibers on the crack section of the GBMs, UQW represents the theoretical value of the volume percentage of green fibers adopted during the design of the GBMs, Ntotal and Ntheory represent the total number of green fibers under the actual dispersion state and the ideal uniform dispersion state, then, there is:
$U_{Q W E}=\frac{N_{\text {total }}}{N_{\text {theooy }}} \times U_{Q W}$ (16)
Using UQWE to replace UQW, then the γ-ξ relationship described by Formula 7 could be transformed into:
$\gamma(\xi)=\frac{4 U_{Q W E}}{\pi r_{Q W}^{2}} \int_{\psi=0}^{\pi / 2} \int_{\varepsilon=0}^{\left(K_{Q W} / 2\right) / \cos \psi} E(\xi) e(\psi) e(c) d c d \psi$ (17)
Thus, the optimization of γF could be realized.
To accelerate the hydration reaction process of the aggregates of GBMs, the bulk density of the cementitious materials, green fiber admixtures, cement, and ultra-fine mineral powder particles needs to be effectively increased to improve the mechanical properties, durability, and ductility of the GBMs.
3.1 Analysis of fractal features
According to the fractal theory, this paper constructed a fractal-geometry dense effect model of powder particles in the aggregates of the GBMs to analyze their fractal features. Assuming a represents the scaled size of the powder particles, DI(a) represents the particle size distribution function, M(a) represents the total number of powder particles with a particle diameter smaller than a, M0 represents the total number of powder particles in per unit volume of the aggregates, then, Formula 18 gives the powder particle size distribution function:
$D I(a)=\frac{M(a)}{M_{0}}$ (18)
Assuming: M1 is a constant, WS represents the fractal dimension of particle size distribution. Because the fractal features of the powder particles in the GBMs aggregates have a limited level of statistical self-similarity, namely:
$M=M_{1}\left(\frac{a}{a_{\max }}\right)^{-W S}$ (19)
By combining Formula 18 and Formula 19, and setting DI(amax)=1, then, there is:
$D I(a)=\left(\frac{a}{a_{\max }}\right)^{-W S}$ (20)
ssuming: MD(a) represents the mass distribution function, Q(a) represents the total mass of powder particles smaller than a, Q0 represents the total mass of per unit volume of the aggregates, then Formula 21 gives the mass distribution function of powder particles:
$M D(a)=\frac{Q(a)}{Q_{0}}$ (21)
Differentiate the above formula to get:
$d Q(a)=Q_{0} d E(a)$ (22)
Assuming ρP represents the density of powder particles, U(a) and dM(a) represent the volume and number of powder particles with a particle diameter within interval (a, a+da), based on the correlation between the mass and volume of the powder particles, there is:
$d Q(a)=\rho_{P} U(a) d M(a)$ (23)
Assuming SFG represents the volume shape factor of smooth powder particles, then the expression formula of U(a) is:
$U(a)=S F_{G} a^{3}$ (24)
dM(a) can be expressed by Formula 25 as:
$d M(a)=M_{0} d D I(a)$ (25)
By differentiating Formula 20 we can get:
$d D I(a)=-W S \cdot a_{\max }^{W S} A^{-1-W S} d a$ (26)
Assuming Ω represents the integral constant, by combining and integrating Formulas 20, 21, and 22, there is:
$E(a)=-\frac{S F_{G} \sigma \cdot M_{0} W S \cdot a_{\max }^{W S}}{Q_{0}(3-W S)} \cdot a^{3-W S}+C$ (27)
Formula 28 gives the known boundary condition:
$M D\left(a_{\max }\right)=1, M D\left(a_{\min }\right)=0$ (28)
At last, combining Formulas 18 and 28, we can get the fractal formula of the gradation of powder particles:
$M D(a)=\frac{a^{3-W S}-a_{\min }^{3-W S}}{a_{\max }^{3-W S}-a_{\min }^{3-W S}}$ (29)
For different complexity degrees of powder particles, the WS values are different as well. The fractal formula shown as Formula 29 indicates that, as long as the mix ratios of the GBMs have been measured and the maximum and minimum powder particle size values have been determined, the fractal dimension can be calculated.
3.2 Analysis of mix ratio and performance
Based on above analysis and the requirement of bulk density, the mix ratios of the GBMs were designed and the mechanical properties were tested.
At first, the compressive strength of GBMs with reasonable mix ratios was analyzed statistically to obtain an approximate formula for calculating the cube compressive strength of the GBMs. Assuming: CS represents the cube compressive strength of the GBMs, θ represents the bulk density of fresh concrete, then there is:
$C S=10.4 \times \theta^{1.92} \times 10^{-6}$ (30)
Then, the thermal conductivity of the GBMs with three mix ratios was measured, the values of thermal conductivity were generally between 0.18 and 0.25W/mK. Based on these mix ratios, the production cost of the GBMs was preliminarily estimated, if the price of the green fibers was 1.2 yuan/Kg, then the production cost for per cubic of the GBMs was about 1825.41 yuan/m3.
After that, the frost resistance of the GBMs was tested. In the test, test pieces made of the GBMs were subjected to 30 freeze-thaw cycles. Assuming UCSq and CSq represent the strength loss percentage and the average compressive strength of the test pieces, CSq-av represents the average compressive strength of the reference test piece, then Formula 31 gives the strength loss of the test pieces after the test:
$U \cdot C S_{q}=\frac{C S_{q-a v}-C S_{q}}{C S_{q-a v}} \times 100 \%$ (31)
Assuming q0 and qm represent the mass of the GBMs before and after the test, then Formula 31 gives the mass loss ηq of the test pieces after the test:
$\eta_{q}=\frac{q_{0}-q_{m}}{q_{0}}$ (32)
To analyze the cost-benefit of the GBMs, this paper constructed a cost-benefit model of the GBMs from the perspective of system dynamics, identified the cost increment and use benefit increment generated by the material production technology, and revealed the mechanism of interaction among model variables; the constructed model could help promote the GBMs, and help builders and building quality inspection departments better understand the impact of the GBMs on the costs and benefits of construction projects.
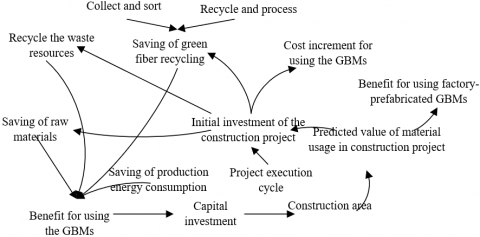
Variables in the production cost-use benefit model of GBMs included three types of variables (auxiliary variables, rate variables, state variables) that were endogenously derived from the model, in addition, there’re also constants and table functions input by the modeler. The core variables are: Initial investment of the construction project CE1, Cost for using the GBMs CE2 and the corresponding cost change CE3, Cost increment for using the GBMs CE4, Benefit for using the GBMs CE5 and the corresponding benefit change CE6, Saving of green fiber recycling CE7, Saving of production energy consumption CE8, Saving of raw materials CE9, Benefit for using factory-prefabricated GBMs CE10; wherein CE3 and CE6 are rate variables, CE2 and CE5 are state variables. Details of other variables are given in Table 1.
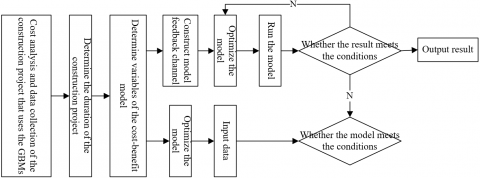
Figure 1 shows the production-use causality of the GBMs. As can be seen from the figure, the production and use process of the GBMs is a negative feedback model. When the capital investment of the construction project increases, accordingly, the main construction area of the project increases, and the amount of GBMs required for wall construction increases as well, which would lead to an increase in the initial investment, and the cost increment for using the GBMs would also increase. With the increase of the amount of usage of GBMs, the amount of usage of green fibers increases with it, then in order to save raw materials and production energy consumption, the factories will pre-fabricate the GBMs to gain certain benefits. Compared with traditional concrete, the GBMs have better performance and can complete the production-use cycle during the entire building construction and operation cycle. Figure 2 shows the model simulation process.
Table 1. Variables in the proposed cost-benefit model
|
Code |
CE1 |
CE2 |
CE3 |
CE4 |
|
Variable name |
Initial investment of the construction project |
Cost for using the GBMs |
Cost change for using the GBMs |
Cost increment for using the GBMs |
|
Variable type |
Auxiliary variable |
State variable |
Rate variable |
Auxiliary variable |
|
Code |
CE5 |
CE6 |
CE7 |
CE8 |
|
Variable name |
Benefit for using the GBMs |
Benefit change for using the GBMs |
Saving of green fiber recycling |
Saving of production energy consumption |
|
Variable type |
State variable |
Rate variable |
Auxiliary variable |
Auxiliary variable |
|
Code |
CE9 |
CE10 |
CE11 |
CE12 |
|
Variable name |
Saving of raw materials |
Benefit for using factory-prefabricated GBMs |
Construction area |
Unit price of GBMs |
|
Variable type |
Auxiliary variable |
Auxiliary variable |
Constant |
Constant |
|
Code |
CE13 |
CE14 |
CE15 |
|
|
Variable name |
Predicted value of material usage in construction project |
Start time of the construction project |
End time of the construction project |
|
|
Variable type |
Constant |
Constant |
Constant |
|
Figure 1. Production-use causality of GBMs
Figure 2. Model simulation process
Since the unit price of GBMs is higher than that of ordinary building materials, the cost increment for using GBMs is mainly reflected in the increase in the initial investment, and the benefit increment for using GBMs is mainly reflected in aspects of the saving of green fiber recycling, the saving of raw materials, and the saving of production energy consumption, etc. Based on above qualitative analysis, following formulas for the cost-benefit model of GBMs could be constructed:
(1) CE14=0
(2) CE15=150 day
(3) Time step=1 day
(4) CE2=CE1
(5) CE1=CE12*CE13
(6) CE5=G(CE6, 0)
(7) CE6=CE7+CE8+CE9
(8) CE9=G(annual benefit generated by saving of raw materials, 0)
(9) CE7=G(1.2 yuan/Kg*amount of use of the materials, 0)
(10) CE8=G(annual benefit generated by saving of the production energy consumption, 0)
(11) CE10=CE1-CE13*1825.41 yuan/m3
(12) CE13=CE11*(1-sharing coefficient)
For the research on the mix ratios of GBMs, until now there isn’t a uniform calculation method for the mix ratios yet. For this reason, this paper took the wet bulk density of the sand-free green concrete composite building material as the assessment criterion to test the mix ratios of the GBMs, figure out the impact of the content of green fibers on the wet bulk density of the GBMs, and determine the content of green fibers in the GBMs with a bulk density between 500Kg/m3 and 1000Kg/m3.
The difficulty of mixing and forming the composite material mixture is mainly affected by the content of cement paste in the composite material, the content of cement paste is an important parameter which determines the strength and dry bulk density of the sand-free green concrete composite building material, therefore, during the mixing test process, “the recycled powder particles can be wrapped by the cement paste” had been set as the lower limit of the mixing test.
The content of green fibers has a direct impact on the dry bulk density, wet bulk density, and water absorption of the GBMs, which will further affect the strain hardening, durability, and ductility of the materials. This paper set the wet bulk density as the control objective of the optimal mix ratios of GBMs to explore the impact of the content of recycled powder particles on the wet bulk density of the composite material admixture. Table 2 shows the mix ratios and wet bulk density of the aggregates of GBMs.
Table 2. Mix ratios and wet bulk density of the aggregates of GBMs
|
Wet bulk density |
867 |
746 |
621 |
593 |
485 |
372 |
|
Green fiber |
14.5 |
16.2 |
17.3 |
17.6 |
18.5 |
19.1 |
|
Cement |
586 |
492 |
431 |
375 |
308 |
219 |
|
Water |
225 |
196 |
174 |
132 |
104 |
95 |
|
Other modifiers |
21.8 |
23.5 |
25.6 |
26.3 |
27.1 |
27.9 |
According to the data shown in Table 2, when the mass of the recycled powder particles was about 3% of the cement mass, the wet bulk density of the GBMs was about 890Kg/m3; when the mass of the recycled powder particles was about 4% of the cement mass, the wet bulk density of the GBMs was about 760Kg/m3; when the mass of the recycled powder particles was about 4.75% of the cement mass, the wet bulk density of the GBMs was about 580Kg/m3. In this study, the orthogonal test was carried out according to above results, and Table 3 lists the selected orthogonal table and the performance test results.
Table 3. Orthogonal table and the performance test result
|
No. |
1 |
2 |
3 |
4 |
5 |
6 |
7 |
|
|
Orthogonal table |
Ⅰ |
1(3.5%) |
1(3.5%) |
1(3.5%) |
2(4.5%) |
2(4.5%) |
2(4.5%) |
3(5.5%) |
|
Ⅱ |
1(0.37) |
2(0.35) |
3(0.34) |
1(0.37) |
2(0.35) |
3(0.34) |
1(0.37) |
|
|
Ⅲ |
1(1.4) |
2(1.6) |
3(1.2) |
1(1.4) |
2(1.6) |
3(1.2) |
1(1.4) |
|
|
Ⅳ(error) |
1(0.7) |
2(0.8) |
3(0.6) |
2(0.8) |
3(0.6) |
1(0.7) |
3(0.6) |
|
|
Performance index |
Flexural strength |
1.472 |
1.357 |
1.198 |
1.163 |
1.105 |
1.132 |
1.013 |
|
Compressive strength |
5.453 |
3.812 |
3.354 |
3.856 |
2.764 |
2.813 |
2.259 |
|
|
Water absorption |
2.12 |
2.75 |
2.42 |
1.26 |
6.64 |
8.23 |
7.57 |
|
Table 4. Range analysis results of the performance of the GBMs
|
Performance index |
Flexural strength |
Compressive strength |
Wet bulk density |
|||||||||||
|
Ⅰ |
Ⅱ |
Ⅲ |
Ⅳ |
Ⅰ |
Ⅱ |
Ⅲ |
Ⅳ |
Ⅰ |
Ⅱ |
Ⅲ |
Ⅳ |
|||
|
K1 |
3.98 |
3.37 |
3.45 |
3.45 |
12.67 |
11.57 |
10.65 |
10.07 |
2671 |
2453 |
2438 |
2452 |
||
|
K2 |
3.41 |
3.27 |
3.21 |
3.26 |
9.45 |
8.14 |
9.54 |
8.83 |
2412 |
2354 |
2472 |
2500 |
||
|
K3 |
2.75 |
3.08 |
3.30 |
3.17 |
6.43 |
8.05 |
8.37 |
9.51 |
2175 |
2463 |
2358 |
2354 |
||
|
R1 |
1.31 |
1.25 |
1.14 |
1.15 |
4.23 |
3.75 |
3.54 |
3.67 |
895.5 |
837.6 |
808.5 |
802.5 |
||
|
R2 |
1.17 |
1.08 |
1.05 |
1.16 |
3. |
2.73 |
3.15 |
2.82 |
805.1 |
792.3 |
832.5 |
834.6 |
||
|
R3 |
0.85 |
1.05 |
1.12 |
1.05 |
2.18 |
2.64 |
2.59 |
3.17 |
721.8 |
805.6 |
786.7 |
775.2 |
||
|
Range |
0.45 |
0.18 |
0.05 |
0.10 |
2.07 |
1.15 |
0.72 |
0.34 |
175 |
34.8 |
46.3 |
55.7 |
||
To figure out the impact of mix ratio I (the ratio of recycled powder particle content to cement content), mix ratio II (the ratio of water content to cement content), and mix ratio III (the ratio of surface modifier content to recycled powder particle content), this paper selected compressive strength, flexural strength, and water absorption as performance indexes, and adopted the orthogonal design method to test the compressive strength and flexural strength of the GBMs. The test equipment included a pressure testing machine and an electric flexural testing machine.
Since the selected influencing factors had three levels, a four-factor three-level orthogonal table was adopted in the test to calculate the mix ratios of the test pieces of the GBMs in each group. The size of the test pieces was 50mm×50mm×150mm, after subjected to standard curing for 3 weeks and standing for 5 days, the performance of the GMBs was tested, then the test results were subjected to range analysis, and the analysis results are shown in Table 4.
According to Tables 3 and 4, when the mix ratio I (recycled powder particles-to-cement) was between 2.3-3.1%, the mix ratio II (water-to-cement) was between 0.34-0.39, and the mix ratio III (surface modifier-to-recycled powder particles) was at three levels of 1.2, 1.5, or 1.8, the impact degree of the three influencing factors (I, II, III) and the error term (IV) on the flexural strength of the GBMs was Ⅰ>Ⅳ>Ⅲ>Ⅱ; in terms of water adsorption, the sequence was Ⅰ>Ⅳ>Ⅱ>Ⅲ.
Conditions for the mixed GBMs to form shape and wrap the recycled powder particles with cement pastes were to make sure that each influencing factor was within the reasonable value range, that is, I should be within 2.3—3.1%, II within 0.34—0.39, and III was at the three level of 1.2, 1.5, or 1.8. Factor I had a great impact on the flexural strength and compressive strength of the GBMs, then we could know that under the current molding, modification, and fabrication processing techniques, the GBMs’ flexural strength and compressive strength were greatly affected by the content of the recycled powder particles, and the influencing factors II and III had a decisive role in the water absorption of the GBMs.
The computation workload of range analysis is small, but this method is not suitable for examining the impact of different influencing factors and error term on the test results. Therefore, to further analyze the impact of each influencing factor on the compressive strength of the GBMs, this paper conducted variance analysis with compressive strength as the performance index, and the results of the variance analysis are given in Table 5, as can be known from the table, influencing factor I had a significant impact on the compressive strength of the GBMs, the levels of influencing factors II and III were within the optimal range, and the analysis results were basically consistent with the results of range analysis. Then, based on these existing research and analysis results, the mix ratios of the GBMs were designed according to the requirements of the bulk density, and the test results of the mix ratios and the mechanical properties of the GBMs are listed in Table 6.
Table 5. Variance analysis with compressive strength as the assessment criterion
|
Source of variance |
Ⅰ |
Ⅱ |
Ⅲ |
Ⅳ |
Overall |
|
Sum of squares |
6.753 |
2.172 |
0.861 |
0.172 |
9.958 |
|
Degree of freedom |
3 |
3 |
5 |
5 |
|
|
Mean square |
3.246 |
1.053 |
0 |
0.278 |
|
|
F-value |
12.154* |
4.85* |
|
|
|
|
Critical value |
F0.01=10.6 |
F0.06=4.78 |
|
|
|
Table 6. Mix ratios and compressive strength of the GBMs
|
Green fiber |
14.2 |
16.7 |
16.9 |
17.1 |
17.3 |
|
Cement |
398 |
353 |
308 |
304 |
275 |
|
Water |
154 |
136 |
131 |
124 |
119 |
|
Other modifiers |
21.1 |
24.8 |
25.3 |
26.4 |
27.1 |
|
River sand |
325 |
291 |
285 |
264 |
232 |
|
High-efficient water reducer |
6.1 |
5.6 |
4.3 |
4.1 |
3.8 |
|
Bulk density |
926 |
835 |
802 |
765 |
683 |
|
Compressive strength |
5.27 |
4.12 |
3.15 |
3.04 |
2.95 |
In terms of the durability of the GBMs, test pieces of the GBMs with a bulk density between 500Kg/m3-1000Kg/m3 were subjected to 30 freeze-thaw cycles. The obtained test results of the compressive strength and mass of the GBMs were compared with those of the test pieces in the control group, then through calculation, the compressive strength loss and mass loss of the GBMs were obtained, the test results of the two groups are shown in Tables 7 and 8. Adding fly ash to concrete aggregates can effectively improve the hydraulicity of the concrete. In the orthogonal test, the cement component in the first group of the GBMs was replaced by fly ash, and the related performance test was carried out. The mix ratio of fly ash was set to 10%, 20%, and 30%, respectively, and the performance test results are shown in Table 9.
Table 7. Test results of frost resistance of GBMs in Group 1
|
Serial number of test piece |
1 |
2 |
3 |
4 |
5 |
6 |
Mean |
|
Mass before freeze-thaw cycles |
772 |
775 |
782 |
754 |
767 |
791 |
773.5 |
|
Mass after freeze-thaw cycles |
742 |
753 |
764 |
729 |
734 |
775 |
749.5 |
|
Mass loss rate |
3.3 |
3.5 |
2.8 |
3.6 |
3.4 |
2.7 |
3.21 |
|
Compressive strength before freeze-thaw cycles |
3.15 |
3.24 |
3.36 |
3.02 |
3.15 |
3.27 |
3.22 |
|
Strength loss rate |
13.6 |
14.3 |
12.1 |
16.8 |
15.2 |
10.7 |
13.78 |
|
Remark |
Comparative compressive strength: 3.71MPa |
||||||
Table 8. Test results of frost resistance of GBMs in Group 2
|
Serial number of the test piece |
1 |
2 |
3 |
4 |
5 |
6 |
Mean |
|
Mass before freeze-thaw cycles |
841 |
852 |
876 |
884 |
853 |
871 |
862.8 |
|
Mass after freeze-thaw cycles |
818 |
839 |
875 |
862 |
834 |
852 |
846.7 |
|
Mass loss rate |
2.6 |
2.1 |
1.5 |
1.6 |
2.3 |
1.8 |
1.98 |
|
Compressive strength before freeze-thaw cycles |
4.03 |
4.15 |
4.32 |
4.23 |
4.08 |
4.21 |
1.98 |
|
Strength loss rate |
11.5 |
9.8 |
5.6 |
6.3 |
9.6 |
7.1 |
8.32 |
|
Remark |
Comparative compressive strength: 4.56MPa |
||||||
Table 9. Performance of the GBMs mixed with fly ash
|
Mix ratio of fly ash |
Flexural strength |
Compressive strength |
Wet bulk density |
|
10% |
1.354 |
3.812 |
924 |
|
20% |
1.286 |
3.757 |
946 |
|
30% |
1.214 |
3.622 |
956 |
According to the data in Table 9, when the mix ratio of fly ash was 10%, the compressive strength and flexural strength of the GBMs decreased slightly, and its wet bulk density increased a little bit. When the mix ratio of fly ash was 20% or higher, the compressive strength and flexural strength of the GBMs continued to decrease, and the wet bulk density increased a little. It’s verified that the added fly ash can effectively fill in the pores of the green fibers and powder particles, making the structure of the GMBs more compact.
In order to effectively control the use cost of the GBMs, this paper calculated and analyzed the costs and benefits of the wall materials of the construction project before and after the use of the GBMs. Table 10 gives the cost of walls made of ordinary building materials, and Table 11 gives the cost of walls made of the GBMs. By comparing these two tables we can see that, the use of GBMs increased the initial investment of the construction project, but the benefits generated by the savings of other aspects were huge, such as the use amount of mortar, cement, and steel bars, also, the addition of green fibers had improved the durability and mechanical properties of the GBMs.
Table 10. Cost of walls made of ordinary building materials
|
Quota code and name |
Labor |
Material |
Machinery |
Total |
|||
|
GBMs are not used |
Second-type labor work |
Third-type labor work |
Standard Brick |
Mortar |
Water |
Mortar Mixer |
|
|
Quota consumption |
1.1575 |
0.7492 |
1.5721 |
0.1850 |
0.1270 |
0.370 |
|
|
Base price |
115.72 |
321.75 |
3.55 |
441.02 |
|||
Table 11. Cost of walls made of GBMs
|
Quota code and name |
Labor |
Material |
Machinery |
Total |
|||
|
GBMs are not used |
Second-type labor work |
Third-type labor work |
Standard Brick |
Mortar |
Water |
Mortar Mixer |
|
|
Quota consumption |
0.8523 |
0.3763 |
1.825 |
0.0618 |
0.1275 |
0.0150 |
|
|
Base price |
76.50 |
377.32 |
1.46 |
455.28 |
|||
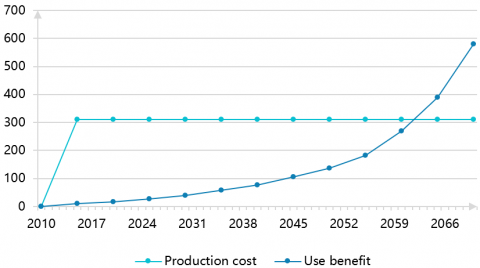
Figure 3. The cost-benefit curve
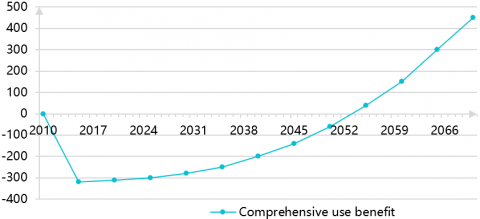
Figure 4. Curve of the comprehensive use benefit
Figures 3 and 4 are the simulation results of the production cost and use benefit of the construction project after using the GBMs, the simulation interval was from 2010 to 2070, a total of 60 years. According to the figures, the cost of the GBMs mainly happens in the initial stage of the project, the cost no longer increases in the construction and operation stages, and it tends to be stable over time. Then, with the progress of the project, the benefit of the project increases gradually; by year 2062, the investment cost of the project will be smaller that the benefit of the project; when the building reaches the longest service life of 60 years, the cumulative comprehensive benefit of the building will reach 585.1 yuan/m2.
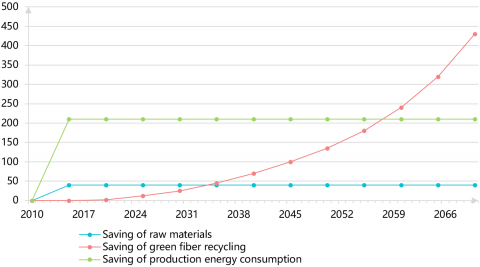
Figure 5 gives the curve of the savings of raw materials, green fiber recycling, and production energy consumption, as can be seen from the figure, benefit coming from the three kinds of savings generally happens in the stage of the pre-fabrication and production of the GBMs, so the benefit at this time is not obvious. But in the operation stage after the building is constructed, the benefit of the project will become greater over time, which is a manifestation of the core benefits generated by the use of the GBMs.
Figure 5. Curve of savings
Comparatively speaking, it’s easier for the GBMs that are developed based on the recycling technology to recover the production cost, if the factories and builders could receive subsidies from government for the production and use of the GBMs, they could further optimize the production technology and expand the application scope to obtain higher savings and more use benefits.
This paper experimented on the optimal mix ratios of the GBMs to control the cost of construction projects. At first, it modeled the strain-hardening and steady-state cracking of the GBMs and analyzed the fractal features of powder particles in the aggregates of the GBMs, then, it designed the mix ratios the GBMs and tested its mechanical performance; at last, the paper constructed a cost-benefit model of the GBMs and realized the cost control of the construction project.
The paper gave the mix ratios of the aggregates of the GBMs and the wet bulk density, combining with mechanical performance test and frost resistance performance test, it obtained optimal mix ratios of the GBMs. In the paper, the cost of walls made of ordinary building materials was compared with the cost of walls made of the GBMs, and the result had verified the good durability and mechanical properties of the GBMs. Moreover, this paper simulated a construction project and gave the prediction results of the production cost and use benefit of the project using the GBMs. This paper provided a useful reference for the application of GBMs in construction projects.
[1] Xu, Y., Hu, J., Zhang, J., Wang, B. (2021). Materials, structure design and thermal energy management for green building. IOP Conference Series: Earth and Environmental Science, 631(1): 012119. https://doi.org/10.1088/1755-1315/631/1/012119
[2] Ling, X.S. (2021). Application of energy saving and environmental protection green decoration materials in building construction. Forest Chemicals Review, 46-52. https://doi.org/10.17762/jfcr.vi.49
[3] Liu, Z.R., Guo, A. (2021). Application of green building materials and multi-objective energy-saving optimization design. International Journal of Heat and Technology, 39(1): 299-308. https://doi.org/10.18280/ijht.390133
[4] Sakthieswaran, N., Sophia, M. (2020). Prosopis juliflora fibre reinforced green building plaster materials-An eco-friendly weed control technique by effective utilization. Environmental Technology & Innovation, 20: 101158. https://doi.org/10.1016/j.eti.2020.101158
[5] Streimikiene, D., Skulskis, V., Balezentis, T., Agnusdei, G.P. (2020). Uncertain multi-criteria sustainability assessment of green building insulation materials. Energy and Buildings, 219: 110021. https://doi.org/10.1016/j.enbuild.2020.110021
[6] Lu, X. (2020). Research on the application of green energy-saving and environmental protection decoration materials in building decoration construction. International Journal of Environmental Technology and Management, 23(2-4): 233-244. https://doi.org/10.1504/IJETM.2020.112966
[7] Zhao, H., Wang, Y., Qiu, W., Qu, W., Zhang, X. (2018). Research on the application of green building materials in China. IOP Conference Series: Earth and Environmental Science, 186(2): 012043. https://doi.org/10.1088/1755-1315/186/2/012043
[8] Ma, X. (2018). Research on green building materials management system based on BIM. Chemical Engineering Transactions, 66: 565-570. https://doi.org/10.3303/CET1866095
[9] Krasae-In, A. (2016). Green sharing: The proposed criteria in green building standards to promote the usage of natural handicrafts in building materials. In MATEC Web of Conferences, 64: 07006. https://doi.org/10.1051/matecconf/20166407006
[10] Bisegna, F., Mattoni, B., Gori, P., Asdrubali, F., Guattari, C., Evangelisti, L., Sambuco, S., Bianchi, F. (2016). Influence of insulating materials on green building rating system results. Energies, 9(9): 712. https://doi.org/10.3390/en9090712
[11] Vidhya, K., Kandasamy, S. (2016). Experimental investigations on the properties of coal-ash brick units as green building materials. International Journal of Coal Preparation and Utilization, 36(6): 318-325. https://doi.org/10.1080/19392699.2015.1118379
[12] Mahzuz, H.M.A., Choudhury, M.R., Ahmed, A.R., Ray, S. (2020). Effect of material strength on the cost of RCC building frames. SN Applied Sciences, 2(1): 46. https://doi.org/10.1007/s42452-019-1830-4
[13] Marwan, M. (2020). The effect of wall material on energy cost reduction in building. Case Studies in Thermal Engineering, 17: 100573. https://doi.org/10.1016/j.csite.2019.100573
[14] Latief, R.U., Thoengsal, J., Hamzah, S., Rahim, I.R. (2020). Potential assessment model of planning, procurement and construction management in reducing cost inefficiency due to building construction material waste (Case study of SOE contractors in Makassar city). Lowland Technology International, 22(2): 200-208.
[15] Lee, J.S. (2021). Life cycle costing for exterior materials on building façade. Journal of Construction Engineering and Management, 147(7): 04021059.
[16] Nambram, S., Narayanan, K., Jana, A. (2021). The Trade-Off Between the Economic and Environmental Impact of Conventional and Green Building Materials. Urban Science and Engineering, 121: 353-631. https://doi.org/10.1007/978-981-33-4114-2_28
[17] Wan, K. (2018). Research on the impact of new green building materials on project cost management. Paper Asia, 1(4): 153-155.
[18] Lee, D.H. (2020). Establishment a recycled green building material model for use in the construction industry in global circular economies. IOP Conference Series: Earth and Environmental Science, 410(1): 012011. https://doi.org/10.1088/1755-1315/410/1/012011
[19] Ustaoglu, A., Yaras, A., Sutcu, M., & Gencel, O. (2021). Investigation of the residential building having novel environment-friendly construction materials with enhanced energy performance in diverse climate regions: Cost-efficient, low-energy and low-carbon emission. Journal of Building Engineering, 43: 102617. https://doi.org/10.1016/j.jobe.2021.102617
[20] Kumar, D., Zou, P.X., Memon, R.A., Alam, M.M., Sanjayan, J.G., Kumar, S. (2020). Life-cycle cost analysis of building wall and insulation materials. Journal of Building Physics, 43(5): 428-455. https://doi.org/10.1177/1744259119857749
[21] Gendelis, S., Miķelsons, M., Jakovičs, A., Bredovskis, E. (2019). Calculation of cost-optimal combination of building materials and technical systems for nZEB single-family house using global cost calculation method. In MATEC Web of Conferences, 282: 02070. https://doi.org/10.1051/matecconf/201928202070