Vanukuri Lakshmi Prasanna | Edara Deepak Chowdary | Venkatramaphanikumar Sistla* | Kolli Venkata Krishna Kishore
OPEN ACCESS
The government of India provides many ICDS programs for women by conducting various awareness programs in order to get a visualized view about their services. These ICDS services aim to improve the health conditions of pregnant women who are economically backward in the rural areas. These services also include several health monitoring factors like Vitamin A prophylaxis, Iron deficiency. It aims to holistic improvement of women and to provide a good nutritious food for the women. Awareness programs and counselling sessions on health care are to be given to the people in rural areas. In this paper, a predictive model using Ensemble Boosted SVM-Pegasos classifier is developed to predict utilization of services and estimate awareness about health in women. For this study, field survey data are collected from 1500 women from the Anganwadi center, Kotthamalayapalem village in Guntur district, in India. Based on this collected data, health condition of rural woman is predicted using relevant terms, such as Name, Age, Financial Status, Weight Proportion, BP Check-up, Vitamin Deficiency, Service Utilization, Diet and Consumption of Iron tablets, Counseling and Awareness for better service. To evaluate this study, an Ensemble Boosted SVM-Pegasos classifier is developed and the model outperformed with 98.62 % of accuracy when compared with other classification models.
ICDS, predictive analytics, naïve Bayes, AdaBoost, SVM, ensemble approach, Pegasos
Due to the great population, a woman in India faces major problems like lack of education, health problems, lack of hygiene and malnutrition etc. To help them come out of such problems, Indian Government has commenced the Integrated Child Development Service (ICDS) in 1975 which is an important program that offers several Supportive services to the children and women in India. The word "Anganwadi" represents a place where the most of the social activities take place. The role of an Anganwadi worker is to help the public when they experience with health issues and concerns through the ICDS program. The basic functionaries of this ICDS program are to provide their services to the people in rural areas which include health and psychological support to pregnant women and adolescent girls by conducting awareness and counseling sessions [1]. This work mainly concentrates on analyzing the awareness of services available to pregnant women based on the health factors. The background knowledge of this work is gathered from the feedback of women by interacting with them directly. Several data mining techniques have been utilized to analyze and predict the awareness in women.
Data Mining is used to extract interesting patterns from a large amount of data. These patterns are delivered to a user and may be stored in the Knowledgebase. Data mining has various functionalities like classification, Association Rule, Clustering etc. There are two main responsibilities in data mining. They are classified as predictive and descriptive. Again, predictive is classified into prediction and classification. In prediction the target class is continuous. In classification, mapping of a given data sample is predefined as a class label. The classification models are used for predicting the future data trends. The term "classifier" in classification implementation refers to a mathematical function that maps a category of input data. An exemplary measure used to compute the performance of the classifier is classification accuracy. There are many algorithms that were proposed over many years that bring out different knowledge representations. These algorithms may be effective for many classification problems. But for all the problems they do not lead to good accuracy. As per theoretical studies, there is no best algorithm used for many data sets. Every algorithm has its own advantage to solve some problems. In this paper, we focused on Support Vector Machines (SVM) [2] which is a powerful model that solves both classification and regression problems. In this work, to reduce the misclassification rate of data samples, we combined SVM model with AdaBoost [3, 4] classifier to predict the health conditions of women. This combination also improved the classification performance on the skewed data. Finally, a comparative study has been made with the proposed approach to the other existing models.
The following Section II describes the review of the literature. The methodology with the proposed ensemble approach is presented in section III. Ensemble Boosted SVM is presented in Section IV and performance evaluation of proposed approach along with various models is presented in section V. Finally, conclusion and future work are presented in Section VI.
Authors [5] proposed an ensemble approach for diagnosis of heart disorders. The data of 215 samples were collected and evaluated using the ensemble method and obtained 96 % of specificity and 95.9 % of sensitivity. Resul Das, et al. [6] developed an ensemble neural network model by combining predicted values and obtained the accuracy of 97.4 % using a heart disease dataset consisting of 215 instances. In paper [7] the author had proposed a model for SVM structured learning which deals with larger datasets. Nair et al. [8] discussed on stock market trend prediction system using a hybrid SVM approach. The performance of the system is compared with Naïve Bayes classifier [9] and neural network. Their proposed model achieved high prediction accuracy. Authors in the paper [10] proposed a classification model for predicting the employee performance. They adopted CRISP-DM classification model to predict the performance of 130 employees from various companies.
Ling Liu, Zijiang Yang [11] discussed a few different algorithms in data mining for the identification of fraudulent online transactions. They obtained data set from 2009 San Diego data mining contest consisting of 94682 instances. The results obtained from the data mining approaches such as Naive Bayes, Bagging, Naive Bayes Multinomial and Classification via Regression. These approaches cannot identify the effective fraud cases. They introduced LDA method to deal with the unbalanced data. LDA produces low accurate results than the other approaches. Rajinikanth TV et al. [12] had proposed a model with various data mining techniques to analyze the metrological data which is suited for Indian weather environments.
The experiment was carried based on time series analysis during 1955 to 1965 with algorithms such as k-means is used for grouping the related data, J48 is used for classification and decision tree algorithm is used to predict the observations. Authors [13] developed a hybrid SVM model to analyse and predict the weather in Guntur district region. Authors [14] proposed a model to identify the unknown high dimensional distributions with SVM algorithm. In paper [15] the authors proposed an ensemble classification approach to detect stress from software employees. They collected the data from 918 software employees from various companies. They also adopted AdaBoost and Pegasos optimization algorithm to improve the classification performance and compared with different existing classifiers. Authors [16] proposed a novel ensemble method for heart disease analysis using majority voting. The result shows that Naïve Bayes classifier better than ensemble model achieved best combination with 92 % of accuracy. In paper [17] proposed a hybrid data mining model for predicting heart disease and achieved 82.54 % accuracy. Authors [18] proposed a novel approach for predicting heart disease failures using LSTM models. They used word embedding and one-hot encoding vectors to represent the patient diagnostic events. The proposed method is compared with AdaBoost, RF and LR models and achieved better classification accuracy.
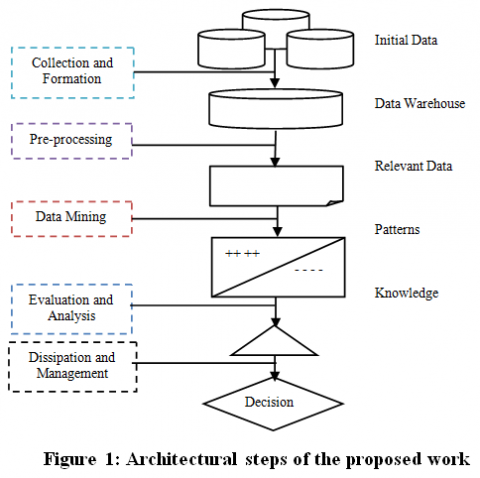
The methodology of this proposed work as shown in Figure 1 is started by collecting the data of 918 samples from the women through an Anganwadi center in Guntur district. The following Figure 1 represents the attribute analysis of proposed framework. After collecting the data, techniques like pre-processing and data cleaning are applied for filling the missing values and removing noisy data from data. Feature selection is to determine the input variables by pruning the features that were not recited in the contribution. Finally, the data is built for training and testing by constructing an ensemble classifier to achieve the final accuracy.
Figure 1. Performance measures of proposed model with existing methods
On the training set the classification model is built with SVM and the performance of this classification model is tested or compared with the predictions with known target values. In this work, we combined Support vector Machines with AdaBoost classifiers to predict the awareness of women on ICDS services. Support Vector Machines (SVM) is the widely used popular classification model in the field of machine learning that solves optimization problems. Based on collected data, the parameters were identified as Name, Age, Economical Standard, Weight Proportion, BP Check-up, Vitamin Deficiency, TT Injection, Diet and Consumption of Iron tablets, Service Support, and Awareness to explain and predict the behaviour of women.
(1). Name: The attribute name specifies the name of the attribute, which may be unique for each and every person.
(2). Age: The age factor specifies the age of women. It is categorized into three labels. If women age group is from 17- 21 then it is labelled as ‘A’, if women age group is from 22-27then it is labelled as ‘B’, if women age group is from 28- 35then it is labelled as ‘C’.
(3). Economical Standard: This attribute specifies the financial status of women. If a woman is lowly then her class is said to be ‘Poor’. If a woman ismoneyedthen her class is said to be ‘Rich’.
(4). Weight Proportion: The weight proportion of a pregnant women state about the weightiness of that particular women and baby at regular intervals of time. The possible values of this weight proportion are said to be ‘Yes’ when Weight of a woman is regularly monitored and ‘No’ if it is monitored irregularly.
(5). BP Check-up: Blood pressure (BP) is one of the vigorous indications with body temperature, breathing rate, heart rate, and oxygen saturation. The classes are categorized as {High, Normal and Low}.
(6). Deficiency of Vitamin A: Generally, Vitamin Deficiency in the body impairs immunity and haematopoiesis. So, maintaining these levels is very important for every woman. It is classified as ‘Yes’ if a woman having Vitamin A deficiency. It is classified as ‘No’ if a woman is without Vitamin A deficiency.
(7). TT Injection: Vaccination is the finest way to defend life-threatening diseases. This attribute specifies whether a pregnant woman take TT Injection regularly or not. The possible values are {taken, not taken}.
(8). Diet and Consumption of Iron tablets: This is the most important factor for maintaining health levels of haemoglobin. It specifies about the proper consumption of food and iron tablets. If a woman is consuming regularly, then it is labelled as ‘frequent’. Otherwise, it is said to be ‘infrequent’.
(9). Service Support: This defines about the facilities provided by ICDS. The classes are said to be are categorized into three classes. They are Less, More, and Medium.
(10). Awareness: This attribute defines about the woman with appropriate knowledge on maintenance of her health. This attribute is considered as a factor variable with number of classes as {High, Less}. If awareness is more, then a woman has spent more than 3 hours of time on ICDS services. If a woman is spending below 3 hours’ time then it is said to be Low.
Support Vector Machine (SVM is used for data classification draws an optimal hyperplane which works as a divider between two classes. This separator gives a maximum margin between two classes and also called as a maximum margin classifier. The larger the margin between the hyperplanes provides a good generalization for classification of data.
Figure 2. Data discrimination with support vectors
The margin corresponds the minimum distance between the data points that are closer to the points on the hyperplane. The following figure shows the optimal hyperplane. Hyperplane is expressed as
$wv^t X+b=0$ (1)
where $wv = {wv_1,wv_2,…,wv_n}$ are the weighted vectors. b is a scalar and $X = {x_1,x_2,…,x_n}$ are the attribute values. R* is the geometrical distance from X* to the optimal hyperplane. Kernel functions of SVM are used when the datasets are non-linearly separable. The various kinds of Kernel functions are explained is as follows;
Linear kernel: It is used for mapping unnecessary data to a higher dimensional space and it outperforms when the large numbers of features are compared to the size of the data. This Linear kernel is defined as
$K(x,x_i)=(1+x^T.x_i)$ (2)
Sigmoid Kernel: This kernel is commonly used in neural networks. This kernel is having “S” shaped curve and often refers to logistic function and it is defined as
$K(x,x_i)=tanh(kx^T.x_i-σ)$ (3)
Polynomial Kernel: This kernel is commonly used in Support Vector Machines that characterizes the likeness between trained instances in a feature space over original polynomial variables. This Kernel is defined as
$K(x,x_i)=(1+x.x_i^T)^p$ (4)
Radial Basis Kernel: This kernel is popular kernel used in various learning algorithms and also known as Gaussian kernel.
$K(x_i, x_j)= exp (-γ|x_i-x_j |^2)$ (5)
Normalized Polynomial Kernel: This kernel defines the standard polynomial kernel that is normalized in its feature space. This kernel function in SVM is defined as
$K(x_i,x_j)=(x_{i.T}.x_j+1)^P/sqrt(x_{i.T+1}+x_{j.T+1})$ (6)
Stochastic Gradient Descent (SGD): SGD is very simple and efficient to fit linear models and specifically used for very large samples. SGD is also called as incremental gradient descent (IGD) method which is an optimization method for minimizing an objective function. The objective function is formed as P(x), where x is the minimized parameter.
$P(x)= ∑_{i=1}^nP_i (x)$ (7)
$P_i$ is summand function with ith observation used to train the dataset. In some problems, sum-minimization problems arise empirical risk minimization. In such a case, $P_i (x)$ defines the loss function value at ith iteration and the empirical risk is denoted as P(x).
$x=x-δ∇P(x)=x-δ∑_{i=1}^n∇P_i (x)$ (8)
Pegasos is a stochastic gradient descent machine learning algorithm, works strongly for optimization in Support Vector Machines. SGD is a variant of primal methods used to solve SVM problems faster. For training the data, this algorithm depends on mini-batches with a batch size specified by user parameter k. This enables solver to differ between sub gradient projection and stochastic gradient descent. When k=1, SGD is augmented with a projection step. When k=n, number of examples simply defines the sub-gradient projection.
Algorithmic Steps:
Initially choose k examples for training at every iteration.
With these k examples, update the weight of the vector by evaluating the objective function with its sub gradient.
Finally, the vector is projected onto a radius ball 1/√(λ) and holds the optimal solution.
When the objective of SVM is unconstrained, hinge loss function is used for replacing linear constraints. The solution accuracy is obtained with good projection step in {$O R^2/λ_ϵ$} iterations, where⋋ is the regularization parameter.
The following steps illustrate the algorithm for Pegasos.
Input data: X,λ, n,k,
Set v1 = 0
for t=1,2,…n
Choose $V_t⊆X$. Where$ |V_t |=k$.
Set $V_t^+={(i,j)∈V_t ∶j〈v_1,i〉<1}η=1/ϑ$
Set $v_{i+1/2}=(1-η_1λ) v_1+ η_t/k ∑_{(i,j)∈V_t^+}ij$
return vt+1
where n represents the number of iterations, k represents number of examples and on each iteration n, vt+1 is calculated by avoiding the examples from $V_t$ from set $V_t$ with size k.
Loss Functions: A loss function maps values of one or variables onto a real number that denotes cost associated with that value. The Optimization problem seeks to reduce the loss function. In SGD, there are various types of loss functions and is used to measure the degree of fitting.
$L*=min_{f∈μ_k } ||L||^2+∑_xl(j_x,L(i_x ))$ (9)
where l is the hinge loss function used by Pegasos in support vector machines.
Table 1. Various loss functions
|
Type |
Function |
|
Hinge Loss |
$P(v;(i,j)) = max {0, 1 - j〈v,i〉}$ |
|
Log Loss |
$P(v;(i,j))=1/ln2 ln(1+e^{-j〈v,i〉 )}$ |
|
Square Loss |
$P(v;(i,j))=(j-(v,i))^2$ |
|
Absolute Loss |
$P(v;(i,j))=|j-(v,i)|$ |
|
Epsilon-insensitive loss |
$P(v;(i,j))=|j-(v,i)|$ |
In stochastic gradient descent methods, the general optimization problems are used in various algorithms for different purposes. Some of them are shown in the Table 1. SVM classifier with Hinge loss function works well since the margins are avoided. This hinge loss functions are suitable only for classification models but not for regression models. The hinge loss function is defined as
$min_v= γ/2||v||^2+1/n ∑_{(i,j)∈T}P(v;(i,j))$ (10)
$P(v;(i,j))=max\left\{ 0,1-j<v,i> \right\}$ (11)
The above equation with the pair (i, j) stands for the hinge loss. This hinge loss function in SVM is good in separating cases and also finds the largest margin between two instances in each class. Algorithm for proposed PEGASOS with Hinge loss function in support vector machines is as follows.
Input data: X,λ, n,k,ε
Randomly select v1 and show $||v^{(1)}||≤1/√(λ)$
for t=1,2,3,….,n do
Set $η_t= 1/λ^t$
Select $Vt⊆X, where | Vt| = k$
$ρ= 1/|X| ∑_{(i,j)∈V_t}(j-〈v_t,i〉),∀i$
$V_t^+={(i,j)∈V_t:j(〈v_t,i〉+ρ)<1},∀i$
$v_{t+1/2}=v_t-η_t (λv_t-1/k ∑_{(i,j)∈V_t^+}ij)$
${{v}_{t+1}}=min\left\{ 1,\frac{1/\sqrt{\lambda }}{\text{ }\!\!|\!\!\text{ }\!\!|\!\!\text{ }{{v}_{t+1/2}}\text{ }\!\!|\!\!\text{ }\!\!|\!\!\text{ }} \right\}{{v}_{t+1/2}}$
if $‖v_{t+1}-v_t ‖≤ε$
then
return $(v_{t+1},1/|X| ∑_{(i,j)∈X}(j-〈v_t,i〉))$
end
end
return $v_{t+1},1/|X| ∑_{(i,j)∈X}(j-〈v_t,i〉))$
In the above Algorithm, “for” loop is defined where projection steps and gradient are taken and “if” is taken as a condition that terminates the execution if there is a difference between two v vectors which are <∈. The whole dataset is denoted as X and n number of samples is selected randomly at every iteration for the computation of sub-gradient. The bias ρ is not a part of objective and it just returns convenient representation of decision function as
$j=sgn (〈v,i〉+ρ)$ (12)
The results of hinge loss within Pegasos algorithm is provided by starting the optimization point with new loss function. The sub-gradient of the objective is defined as follows
After refinement to new loss function, the above equation is represented as follows
$Δ_t= λv_t-1/|V_t|[∑_{(i,j)∈V_t^+}yx-∑_{(i,j)∈V_t^-}βij]$ (13)
where $Δ_t$ depends on the parameter β and $V_t^-$ is the subset of Vt where $j〈v,i〉>1$.
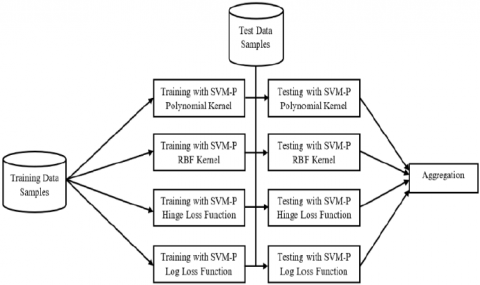
4.1 Ensemble boosted SVM approach
Ensemble approach in Machine learning selects a classifier from various algorithms and trains the algorithm with Sample training data. In this study, AdaBoost is another classifier used as classifier ensemble. This algorithm in machine learning has become one of the most powerful ensemble methods. The following Figure 3 depicts the architecture of SVM-Pegasos and AdaBoost ensemble. This ensemble approach of both SVM-Pegasos and AdaBoost optimizes the weight vector and mainly focuses on training samples which contain more valuable information that builds the classifier with good learning performance. The boosting method in AdaBoost algorithm improves the classifier learning accuracy by performing the random iterations. For each iteration, initially, all the uniform weights for all training samples are distributed and then adjusted for training samples when the classifier is completed. If there are any misclassified samples, then the weights are increased as the weights of classified samples are decreased. In such case, the weak classifier is forced to focus on all the hard samples in the training data.
${{W}_{i+1}}(x)=\frac{{{W}_{i}}(x)exp(-{{b}_{x}}{{a}_{i}}{{c}_{i}}({{a}_{x}}))}{{{N}_{i}}}$ (14)
where $a_x$ belongs to some sample space A with each label $b_x$ which is in a label set $B.W_i (x)$ denotes the new attribute which is added to new sample and $N_i$ represents the normalization constant. The above equation (2) denotes the weighted values with a parameter $α_i$ as a learning ability for hypothesis $c_i (a_x )$. The estimated function for all the training samples are computed when the parameter $α_i=(ln[((1-F_i ))/F_i ])/2$, then the function can be as
$g(a)=∑_{i=1}^{i_{max}}α_i c_i (a)$ (15)
where $i_{max}$ reduces the maximum error rate, when it is large it degrades the performance of the classifier and may lead to over fitting problems.
Figure 3. Architecture of the proposed ensemble approach
The proposed algorithm describes the ensemble approach by combining SVM-Pegasos with AdaBoost classifiers.
Input: $(a_1,b_1 ),…,(a_n,b_n)$
Initialize the weights of all training samples $W_1 (x)=1/l$
for i=1,2,3,…,I{
Train SVM classifier on weighted distribution of training samples $W_d$;
Predict the samples with SVM-P learner:
$c_i=A→{-1,+1}$;
Update the weight of sample by computing $α_i$ using error rate;
${{W}_{i+1}}(x)=\frac{{{W}_{i}}(x)exp(-{{b}_{x}}{{a}_{i}}{{c}_{i}}({{a}_{x}}))}{{{N}_{i}}}$}
Output: $A(a)=sign∑_{i=1}^Iα_i c_i (a)$
Initially, the input of training samples $(a_1,b_1 ),…,(a_n,b_n)$ are given with a label of $b_x$. The output is generated by the combined classifier with a predicted value. The important information from all the training samples of $W_i (x)$ is added to the SVM-Pegasos classifier. The weights with the same values are initialized before training the classifier. The initial step is to select the training samples from the dataset by performing random iterations according to their weighted values. After the SVM-Pegasos algorithm runs as a learner by moving it into the learning part. Then the SVM-Pegasos classifier generates the error $F_i$ in prediction with the training samples. Finally, the sample with significant information is selected and then moves to the next iteration. Similarly, this process is continued until all iterations for the training samples are completed. The final outcome of this classifier is to predict the labels of samples by combining all the classifiers ($a$) into a single classifier.
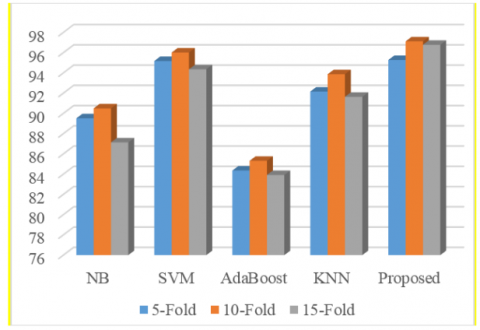
With the support of women and anganwadi workers of Kotthamalayapalem village, we collected the original data of including the information of 1500 married women following the Anganwadi center of Kotthamalayapalem village which is located in Guntur district. For this evaluation, 11 factors were identified as Name, Age, Financial Status, Weight Proportion, BP Check-up, Vitamin Deficiency, Service Utilization, Diet, Consumption of Iron tablets, Counseling and Awareness. The Awareness attribute was considered as the outcome factor labeled with 4 classes {High, Medium, Less, Very Less}. After the collection of data, all the noise and missing values are identified and rectifies by data cleaning and pre-processing methods. After, we randomly split the dataset into training and testing with 5-fold, 10-fold and 15-fold cross validations. According to previous studies, 10-fold cross validation is the most common method which gains higher accuracies of all models than using 5-fold and 15-fold cross validation schemes. Here, the classifier produces 10 equal sized sets by using 90 % of sample data for training and 10 % for testing. The classification was performed with proposed method and various existing classifiers like Naïve Bayes, SVM, KNN, AdaBoost and proposed approach.
Figure 4. Comparison of different classifiers with various cross validation methods
Table 2. Performance evaluation of different functions with existing SVM kernel methods
|
Method |
Function |
Accuracy |
|
SVM with Polynomial Kernel |
Hinge Loss |
94.62 % |
|
Log Loss |
92.10 % |
|
|
Pegasos |
95.28 % |
|
|
SVM with PUK Kernel |
Hinge Loss |
97.33 % |
|
Log Loss |
94.12 % |
|
|
Pegasos |
96.57 % |
|
|
SVM with RBF Kernel |
Hinge Loss |
92.48 % |
|
Log Loss |
90.78 % |
|
|
Pegasos |
92.56 % |
|
|
Proposed SVM Ensemble |
Hinge Loss |
97.10 % |
|
Log Loss |
96.84 % |
|
|
Pegasos |
98.62 % |
In this regard, Naïve Bayes, SVM, KNN and AdaBoost were applied to the dataset and obtained an accuracy rate of 89.62 %, 96.59 %, 93.09 % and 85.33 %. When compared to all other classifier models, the proposed ensemble method achieves the highest accuracy of 98.62 % using 10-fold cross validation. The following Figure 4 represents the performance of different classifiers with various cross validations.
Table 2 presents the results achieved with proposed ensemble method with various Loss functions when compared to different SVM kernel methods. From these results, it is proved that SVM Pegasos outperforms with improved accuracy than available loss functions in all the cases with all SVM kernels and proposed ensemble approach. Without Pegasos, SVM-PUK kernel with Hinge loss function performed well with an accuracy rate of 97.33 %. The proposed ensemble approach outperforms well by reducing the error rate of misclassified samples than all the methods and obtained better classification accuracy of 98.62 %. Table 3 shows the performance comparison of this ensemble approach and other existing models like NB, SVM, AdaBoost and KNN in terms of evaluation metrics such as TP-Rate, FP-Rate, Precision, Recall and F-Measure. These metrics are defined as follows:
$TP-Rate=TP/( FN+TP)$ (16)
$FP-Rate=FP/(FP+TN)$ (17)
$Precision=TP/(FP+TP)$ (18)
$Recall =TP/( FN+TP)$ (19)
$F-Score= (2*TP)/( 2*TP+FN+FP)$ (20)
Table 3. Performance measures of proposed model with existing methods
|
Method |
Precision |
Recall |
F-Measure |
|
Naïve Bayes |
0.905 |
0.886 |
0.896 |
|
SVM |
0.963 |
0.951 |
0.973 |
|
AdaBoost |
0.853 |
0.725 |
0.784 |
|
KNN |
0.939 |
0.920 |
0.929 |
|
Proposed |
0.984 |
0.982 |
0.986 |
Figure 5. Performance Comparison of proposed model with the existing models
The main objective of this study is to predict the awareness and the need of services offered to the women under ICDS scheme. As a part of this work, we have conducted a survey on data collected various health factors from 1500 women to predict the awareness on ICDS services. Based on this collected data, prediction can be done based on relevant terms such as Name, Age, Financial Status, Weight Proportion, BP Check-up, Vitamin Deficiency, Service Utilization, Diet and Consumption of Iron tablets, Counselling and Awareness are considered for predicting the health conditions of women. In this paper, an ensemble classification approach is used to predict utility of services available and awareness in women. To evaluate the prediction performance, 10–fold approach is used by combining SVM-Pegasos with AdaBoost classifier. Performance of the proposed ensemble model is achieved around 98.62 % in the comparison of other methods such as NB, KNN, SVM and AdaBoost in all the aspects such as Precision, Recall and F-Measure. In future, we would like to extend this work by collecting and analyzing large scale data from various women in different villages and districts. We would also like to contribute a new classifier for speedy analysis, better visualization and faster computation.
[1] Devi, K.A., Edara, D.C., Sistla, V.P.K., Kolli, V.K.K. (2018). Extended correlated principal component analysis with SVM-PUK in opinion mining. Turkish Journal of Electrical Engineering & Computer Sciences, 26(5). https://doi.org/10.3906/elk-1704-178
[2] Vapnik, V. (2013). The nature of statistical learning theory. Springer Science & Business Media. https://doi.org/10.1007/978-1-4757-3264-1
[3] Pavlov, D., Mao, J., Dom, B. (2000). Scaling-up support vector machines using boosting algorithm. In Proceedings 15th International Conference on Pattern Recognition, 2: 219-222. https://doi.org/10.1109/icpr.2000.906052
[4] Li, X., Wang, L., Sung, E. (2005). A study of AdaBoost with SVM based weak learners. In Proceedings. 2005 IEEE International Joint Conference on Neural Networks, 1: 196-201. https://doi.org/10.1109/ijcnn.2005.1555829
[5] Zheng, Q.F., Huang, H.F., Zhang, Y.Z., Su, G.D. (2009). Support vector machine based on universal kernel function and its application in quantitative structure-toxicity relationship model. In 2009 International Forum on Information Technology and Applications, 3: 708-711. https://doi.org/10.1109/ifita.2009.256
[6] Das, R., Turkoglu, I., Sengur, A. (2009). Diagnosis of valvular heart disease through neural networks ensembles. Computer Methods and Programs in Biomedicine, 93(2): 185-191. https://doi.org/10.1016/j.cmpb.2008.09.005
[7] Srinivas, R. (2010). Managing Large Data Sets Using Support Vector Machines.
[8] Nair, B.B., Mohandas, V.P., Sakthivel, N.R. (2010). A genetic algorithm optimized decision tree-SVM based stock market trend prediction system. International Journal on Computer Science and Engineering, 2(9): 2981-2988.
[9] Han, J., Pei, J., Kamber, M. (2011). Data mining: concepts and techniques. Elsevier, 1-703.
[10] Al-Radaideh, Q.A., Al Nagi, E. (2012). Using data mining techniques to build a classification model for predicting employees performance. International Journal of Advanced Computer Science and Applications, 3(2). https://doi.org/10.14569/ijacsa.2012.030225
[11] Liu, L., Yang, Z. (2013). Improving online shopping experience using data mining and statistical techniques. Journal of Convergence Information Technology, 8(6). https://doi.org/10.4156/jcit.vol8.issue6.57
[12] Kanth, T.R., Rajashekar, N. (2014). Analysis of data sets using data mining techniques. Computer Science and Technology, 89-94.
[13] Rajasekhar, N., Rajinikanth, T.V. (2014). Weather analysis of Guntur district of Andhra region using hybrid SVM Data Mining Techniques. International Journal of Engineering and Advanced Technology (IJEAT), 3(4): 133-136. https://doi.org/10.15373/22778179/nov2013/74
[14] Jumutc, V., Suykens, J.A. (2014). Multi-class supervised novelty detection. IEEE Transactions on Pattern Analysis and Machine Intelligence, 36(12): 2510-2523. https://doi.org/10.1109/tpami.2014.2327984
[15] Chowdary, E.D., Devi, K.A., Mounika, D., Venkatramaphanikumar, S., Kishore, K.K. (2016). Ensemble classification technique to detect stress in IT-professionals. In 2016 International Conference on Inventive Computation Technologies, 3: 1-6. https://doi.org/10.1109/inventive.2016.7830153
[16] El Bialy, R., Salama, M.A., Karam, O. (2016). An ensemble model for Heart disease data sets: a generalized model. In Proceedings of the 10th International Conference on Informatics and Systems, 191-196. https://doi.org/10.1145/2908446.2908482
[17] Saini, M., Baliyan, N., Bassi, V. (2017). Prediction of heart disease severity with hybrid data mining in telecommunication and networks. 2nd International Conference on Telecommunication and Networks, pp. 1-6. https://doi.org/10.1109/tel-net.2017.8343565
[18] Jin, B., Che, C., Liu, Z., Zhang, S., Yin, X., Wei, X. (2018). Predicting the risk of heart failure with EHR sequential data modeling. IEEE Access, 6(C): 9256-9261. https://doi.org/10.1109/ ACCESS. 2017.2789324