Linghua Shen* | Jiyang Wang | Shilang Xu | Godwin Amoako-Atta
© 2019 IIETA. This article is published by IIETA and is licensed under the CC BY 4.0 license (http://creativecommons.org/licenses/by/4.0/).
OPEN ACCESS
This paper attempts to disclose the fire resistance behavior of the full-scale self-thermal insulation sandwich wall made of textile-reinforced concrete (TRC). For this purpose, two full-scale unfilled specimens and ten full-scale sandwich wall specimens were tested in fire. The author then explored how the fire resistance limit and failure features of the specimens are affected by the following factors: the type of cementitious material, the thickness of the core layer, the thickness of TRC panels, the type of reinforcing material, the additional short polypropylene (PP) fibers, as well as the type of fire proof coating. The following findings were made through the exploration. For Portland cement-based specimens with 16 mm-thick TRC panels and a 90 mm-thick core layer, the fire-resistance limit is 203 min, much longer than the requirement for partition walls and non-load-bearing walls of fire rating I. The high alumina cement-based specimens can maintain its integrity in the fire, although their thermal insulation is slightly weaker than the Portland cement-based ones. Besides, the fire-resistance of specimens can be improved effectively by increasing the thickness of the core layer and the TRC panels and adopting fireproof coatings. Finally, the heat transfer process of the specimens in fire was simulated on ABAQUS6.10. The simulated results were found to agree well with the measured results.
textile-reinforced concrete (TRC), selfthermal insulation sandwich wall, fullscale specimen, fire resistance, finiteelement analysis
Textile-reinforced concrete (TRC) is a lightweight and tough composite with good corrosion resistance and bearing capacity [2-4]. The composite encompasses a matrix of fine-grained cement-based concrete, and a cover of continuous multi-filament yarns, which are made of carbon, alkali-resistant (AR) glass or polymer fibers. The multi-filament yarns are highly corrosion-resistant, making it possible to reduce the thickness of TRC cover without scarifying the bonding and anchorage properties. Therefore, the TRC can be designed into thin cross-section components (e.g. TRC curtain wall elements and TRC sandwich walls) to replace heavier conventional reinforced concretes. These components enjoy a flexible shape, boast good mechanical-physical functionality, and meet the requirements on architectural design [5]. At present,
Some scholars have designed a sandwich plate with two thin TRC panels and a thermal insulation core layer in between, creating a space-saving lightweight component, and studied the mechanical properties of the plate through theoretical analyses and experiments. On theoretical analyses, Cuypers et al. [10] designed three simplified models based on continuum method, beam on elastic foundation, and elementary sandwich theory (EST), respectively, and highlighted the importance of the last model. Shams et al. [11] simplified the stiffness function of
In recent years, the high-temperature resistance of full-scale wall structures has been explored extensively at home and abroad. For example, Lee et al. [15], Kolarkar et al. [16] and Gara et al. [17] respectively investigated the high-temperature resistance of reinforced concrete bearing walls, non-load-bearing steel walls with gypsum board, and sandwich walls. In addition, some scholars [18-19] carried out fire tests on the fire-resistance of three other types of walls, including the C-shaped cold-formed load-bearing composite wall of thin-walled steel, precast concrete sandwich wall with inner and outer concrete wythes, and inorganic insulation mortar. All these walls are reinforced with steel bar or wire mesh.
The existing studies on the fire-resistance of the TRC mainly focus on the material [20-26]. For instance, Xu et al. [22-24] examined the mechanical performance of thin TRC plates at high temperatures. Zhu et al. [26] studied the impact response of basalt TRC to different temperatures. To enhance TRC members, Raoof et al. studied the high-temperature bond between concrete and textile-reinforced mortar (TRM) composite [27-28], showing the excellent effect of TRM enhancement under high temperatures. Despite the above studies, more experimental research is needed to disclose the fire resistance behavior of full-scale TRC sandwich wall.
Targeting the full-scale TRC self-thermal insulation sandwich wall, this paper explores how the fire resistance limit and failure features of wall specimens are affected by the following factors: the type of cementitious material, the thickness of the core layer, the thickness of TRC panels, the type of reinforcing material, the additional short polypropylene (PP) fibers, as well as the type of fire proof coating. Based on the test data, the author proposed proper fire protection measures for TRC self-thermal insulation sandwich wall according to relevant regulations. The research findings promote the application of TRC self-thermal insulation sandwich wall in civil engineering.
2.1 Materials
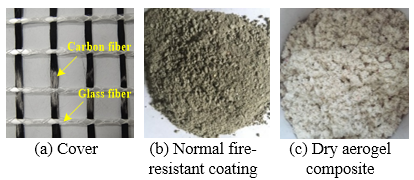
In the TRC panels, the fine-grained concrete matrix is made from P.II 52.5R ordinary Portland cement (or CA-50 high alumina cement), fly ash, silica fume, quartz sand, water reducing agent and water. The mix ratio between these materials is listed in Table 1. The cover consists of non-twisting carbon fiber bundles and alkaline E-glass fiber bundles. As shown in Figure 1(a), the two bundles are woven into a net with the grid size of 10mm×10mm. The mechanical properties and geometric parameters of fiber bundles are given in Table 2.
The TRC panels were casted by lapping and grouting: first, three layers of woven fiber nets were compacted, aligned to each other, and evenly placed in the mold; then, the raw materials of the fine-grained concrete matrix were mixed, poured into the mold, and slightly vibrated and smoothed; finally, the mold was cured for 28d in the curing chamber.
With low cost, low density and high thermal conductivity, hydrophobic rock wool board was selected to produce the thermal insulation core layer of the sandwich plate. The performance parameters of the board are shown in Table 4.
In addition, two types of fireproof coatings were designed for our test (Figures 1(b) and 1(c)). The ordinary fireproof coating was purchased from a factory and the self-made aerogel fireproof coating was produced according to the mix ratio in Table 3. The performance parameters of the two coatings are listed in Table 5.
Table 1. Mix ratio of the raw materials for the fine-grained concrete matrix (kg∙m-3)
|
Item |
Cement |
Fly Ash |
Silica Fume |
Water |
Water Reducing Agent |
Quartz Sand |
|
Portland cement |
472 |
168 |
35 |
262 |
3.25 |
1380 |
|
Alumina cement |
472 |
168 |
35 |
200 |
3.25 |
1380 |
Table 2. Mechanical properties and geometric parameters of fiber bundles
|
Fiber Type |
Fiber Model |
Tensile Strength/MPa |
Young’s Modulus/GPa |
Elongation at Break/% |
|
Carbon fiber |
12000 |
4900 |
230 |
1.35 |
|
Glass fiber |
4000 |
3100 |
72 |
4.5 |
Table 3. Mix ratio of the self-made aerogel fireproof coating (kg∙m-3)
|
Portland Cement |
Flash Ash |
Quartz Sand |
Water Reducing Agent |
Water |
Volume Content of Aerogel |
Volume Content of PVA Fiber |
|
312 |
125 |
312 |
5.18 |
703 |
40% |
1.5% |
Table 4. Performance parameters of thermal insulation core layer
|
Performance Parameter |
Density /(kg∙m-3) |
Shot Content/% |
Average Diameter /μm |
Organic Content /% |
Thermal Conductivity /(W·m-1·K-1) |
Hydrophobicity /% |
Shrinkage Temperature of Heat Load /℃ |
|
Standard |
90 |
≤10 |
≤7.0 |
≤4.0 |
≤0.044 |
≥98 |
≥600 |
|
Measured |
91 |
6.2 |
4.8 |
1.3 |
0.043 |
98.8 |
660 |
Table 5. Performance parameters of the two fireproof coatings
|
Type |
Dry Density /(kg∙m-3) |
Moisture Resistance /h |
Dry Time /h |
Compressive Strength /MPa |
Flexural Strength /MPa |
Mass Loss Rate/% |
Freeze-Thaw Cycle /time |
Fire Resistance Limit /h |
Bond Strength/MPa |
|
Ordinary |
637 |
720 |
5 |
1.56 |
0.73 |
46 |
15 |
1.5-2.0 3 |
0.24 |
|
Self-made |
200 |
- 4 |
- |
14 |
2.1 |
29 |
- |
- |
- |
Figure 1. Test materials
2.2 Preparation of TRC specimens
As mentioned above, our test considers six parameters, namely, the type of cementitious material, the thickness of the core layer, the thickness of TRC panels, the type of reinforcing material, the additional short PP fibers, as well as the type of fire proof coating. Two full-scale TRC panels and ten full-scale TRC self-thermal insulation sandwich walls were fabricated with different parameters. The number and the type of the specimens are provided in Table 6.
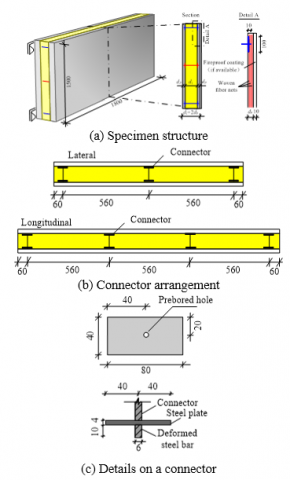
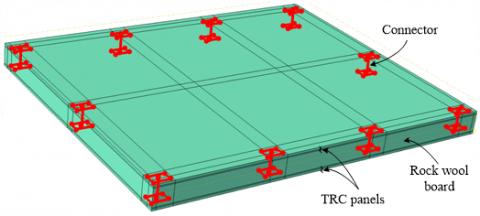
As shown in Figure 2, each specimen is 1,800mm in length and 1,500 mm in width, but of different thicknesses. The thicknesses of the TRC panels and the core layer are respectively denoted as dp and dl. Three layers of woven fiber nets were compacted and placed uniformly in the TRC panels. The upper and lower of each panel were attached with connectors, whose anchorage length is 10 mm.
Figure 2. The specimen design
Table 6. The number and type of specimens
|
Type |
Thickness of Panels /mm |
Thickness of Core Layer/mm |
Total Thickness /mm |
Volume Content of PP Fibers /(kg∙m-3) |
Main Cementitious Material |
Fire-Proofing Coating |
|
OPC |
17.9 |
- |
17.9 |
- |
Portland cement |
- |
|
OPC-A |
18.1 |
90 |
136.7 |
- |
Portland cement |
- |
|
STEEL-A |
19.8 |
90 |
138.8 |
- |
Portland cement |
- |
|
CAC |
16.9 |
- |
16.9 |
- |
Alumina cement |
- |
|
CAC-A |
17.6 |
90 |
130.1 |
- |
Alumina cement |
- |
|
PP-A |
17.2 |
90 |
135.1 |
0.9 |
Portland cement |
- |
|
PP-B |
16.1 |
60 |
95.14 |
0.9 |
Portland cement |
- |
|
OPC-B |
17.2 |
60 |
90.68 |
- |
Portland cement |
- |
|
OPC-B(T) |
27.21 |
60 |
113.8 |
- |
Portland cement |
- |
|
PP-B(T) |
27.31 |
60 |
114.0 |
0.9 |
Portland cement |
- |
|
S-OPC-B |
18.0 |
60 |
99.85 |
- |
Portland cement |
Normal |
|
Q-OPC-B |
18.0 |
60 |
105.5 |
- |
Portland cement |
Homemade |
OPC: P.II 52.5R ordinary Portland cement; CAC: CA-50 high alumina cement; Types A and B: two types of core layer thickness; STEEL: two layers of steel wire meshes (instead of three layers of woven fiber nets); T: high panel thickness; S: Ordinary fireproof coating; Q: Self-made fireproof coating.
2.3 Test program
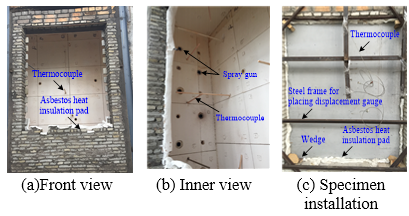
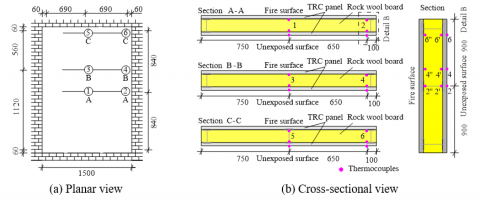
The test was carried out at the State Key Laboratory of Subtropical Building Science, South China University of Technology. As shown in Figure 3, the test device is a 4.0m×3.0m×1.5m furnace with 12 spray guns on each side. During the test, the furnace temperature was controlled by the spray guns according to the ISO standard heating curve (ISO 834), and was monitored by 18K thermocouples as per the Fire-Resistance Tests: Elements of Building Construction (GB/T 9978) [2]. As shown in Figure 4, the thermocouples were arranged on three sides: the fire surface, the core layer and the unexposed surface. The thermocouples on the three surfaces are respectively denoted as 2, 2' and 2''.
Figure 3. The test device
In light of the above standards, the fire-resistance limit of the specimens was determined based on thermal insulation and integrity. A specimen was considered below the fire resistance limit unless one of the following two conditions occurred: (1) the mean temperature surpassed 170℃ from the initial temperature of 30℃ or the temperature at any moment exceeded 210℃. Note that the initial temperature refers to the mean temperature of unexposed surface at the start of the test, and the temperatures were measured by a moving thermocouple; (2) The flame appeared on the unexposed surface or lasted for more than 10s.
Figure 4. Thermocouple arrangement
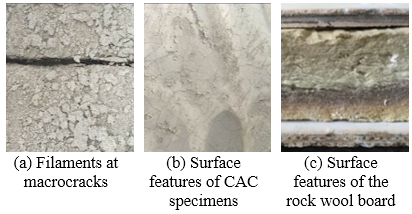
The failure phenomena of the specimens are recorded in Figure 5. The following common features can be seen from the failure modes of the cooled specimens. (1) The textiles of the fire surface were exposed; as a result, the glass filaments lost bearing capacity, and melted at the macrocracks. (2) The concrete based on ordinary Portland cement became loose and peeled off on the fire surface, speeding up the degradation of the filaments exposed to high temperature; hence, the fire resistance limit of the specimens was reduced. Meanwhile, the concrete based on aluminate cement maintained a high strength despite the surface cracking under high temperature. (3) After cooling, the rock wool board gradually turned from light yellow to black brown along the thickness direction, which reveals the degree of thermal damage.
Table 7 shows the fire resistance limits, failure criteria and failure phenomena of the cooled specimens. Among the tested specimens, PP-A, OPC-B, PP-B and PP-B (T) were tested in fire only for 1h, to see if they can reach the fire rating I for partition walls and non-load-bearing walls in the Code of Design on Building Fire Protection and Prevention (GB 50016-2014) [1]. According to the test data, the fire resistance limit of OPC-A (16 mm-thick panels and 90mm-thick core layer) was 203 min, much greater than the requirements on fire rating I in the said Code [1]: the fire resistance of partition walls should reach levels I and II, or the fire resistance limits of 0.75 h and 0.5 h. The fire resistance limit of CAC-A was merely 57 min, much shorter than OPC-A, but still meets the requirements on fire rating I.
Figure 5. Failure phenomena of specimens
Table 7. Failure modes of the specimens
|
Type |
Fire Resistance Limit/Min |
Failure Criterion |
Failure Phenomenon |
|
OPC |
17 |
Thermal insulation |
After testing, the whole specimen appeared inward shape. The width of the macro-crack on the unexposed surface was 2~3 mm, while the concrete appearance on the fire surface appeared gray-white, with the tendency of loose and peeling off. |
|
OPC-A |
203 |
Thermal insulation |
The panel on the fire surface was almost burned out except surrounding part remaining after testing, guessing that the panel may collapse during the fire. |
|
STEEL-A |
49 |
Thermal insulation |
Water drops were observed on the unexposed surface at 45min. After the test, partial concrete of the fire surface peeled off, and the delamination between steel wire mesh and concrete matrix can be observed obviously. The concrete present gray-white; the surface concrete appeared losing, simultaneously (Figure 5(b)). |
|
CAC |
19 |
Thermal insulation |
After testing, the integrity of the specimen remained well, and the concrete on fire surface cracked partially with its milky white color. |
|
CAC-A |
57 |
Thermal insulation |
The maximum temperature on the unexposed surface reached at 119.1 C at 30min. After testing, the integrity of the concrete on the fire surface kept well. Meanwhile, the concrete on the fire surface appeared milky white color with high strength and longitudinal multi-cracks. |
|
PP-A |
>60 |
- |
Several black spots appeared on the unexposed surface at 37min, and also the color around the black spots presented lighter. After testing, multi-cracks occurred on the unexposed surface. The middle part of the fire surface collapsed when removing the specimen from the furnace, which did not collapse during the fire test, though it lost its bearing capacity after cooling. |
|
PP-B |
>60 |
- |
At the end of the test, the panel on the unexposed surface maintains a certain integrity. However, there are many macro cracks, and the main crack is longitudinal through crack. The addition of polypropylene fibers has little effect on the morphology of the specimens after cooling. |
|
OPC-B |
>60 |
- |
After the test, three longitudinal main cracks appeared on the fire surface. However, the specimen kept still in the furnace and did not collapse. |
|
PP-B(T) |
>60 |
- |
After testing, the integrity of the specimens remained well except the concrete cover of the fire surface was peeled off by approximately 10%. The concrete presented grey-white with almost concrete cover falling off. |
|
OPC-B(T) |
140 |
Thermal insulation |
After the test, the panel on the fire surface panel was collapsed during the cooling process. |
|
S-OPC-B |
115 |
Thermal insulation |
After testing, the integrity of the concrete on the fire surface remained well. The concrete cover was with good adhesion between the coating and concrete after removing the coating. Only one small crack of the fire surface can be observed. Furthermore, the textiles kept still after cutting the panel of the fire surface. |
|
Q-OPC-B |
95 |
Thermal insulation |
After the test, the specimen was morphologically modified, and there were little micro-cracks on the fire surface. The excellent interfacial bonding between the concrete cover and the coating can be observed when removing the coating. |
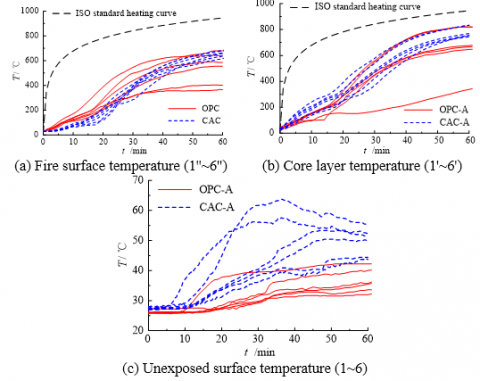
Figure 6. The effect of the type of cementitious material on the measured temperature
Figure 6 illustrates the relationship between the fire time and the temperature of OPC, CAC, OPC-A and CAC-A measured by 6 thermocouples in different locations. From Figures 6(a) and (b), it can be seen that each of the temperature-time curves contains a preheating segment, a development segment and a steady segment, which correspond to the early, middle and late phases of the test. Due to the absence/presence of the core layer, the division point between the early and middle phases appeared at about 10min in Figure 6(a) and at 20min in Figure 6(b). The following can be observed from the curves in Figure 6.
The OPC showed a less fluctuating and discrete temperature curve on the unexposed surface than CAC. With the increase in fire time, the CAC gradually surpassed OPC in terms of fire surface temperature. It is evident that the core layer temperatures of OPC-A and CAC-A were much higher than the fire surface temperatures of OPC and CAC, as the core layer hinders the dissipation of the inner heat of the specimens.
Moreover, the CAC-A maintained a higher temperature than OPC-A, although the latter kept a more stable curve shape. The difference may have arisen from the following facts: despite its good high-temperature resistance, Alumina cement has a higher heat transfer coefficient than Portland cement.
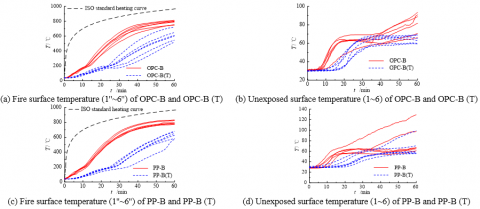
3.3 The effect of the thickness of the core layer
The time-variation of measured temperature with core layer thicknesses is displayed in Figure 7. Each of the temperature-core layer thickness curve could be divided into three egments as discussed above. Obviously, the temperature of OPC-B (6cm-thick core layer) increased slightly faster than OPC-A (9cm-thick core layer). Besides, the thickness difference affected the growth rate of unexposed surface temperature: OPC-B had a higher temperature on the unexposed surface than OPC-A. Hence, a thicker rock wool board may lower the unexposed surface temperature, enhancing the fire resistance limit.
Figure 7. The effect of core layer thickness on the measured temperature
3.4 Effect of TRC panel thickness
Figure 8. The effect of TRC panel thickness on the measured temperature
Figure 8 presents the time variation in temperature of the specimens with TRC panel thicknesses. As shown in the figure, the division point between the preheating and development segments appeared at 15 min in OPC-B, 10min earlier than in OPC-B (T), revealing the heat retardant effect of TRC panel thickness. As the thickness increased from 16mm to 26 mm, the fire surface temperature and the unexposed surface temperature both exhibited a declining trend, and the former plunged deeper than the latter. To sum up, the fire resistance limit and the failure mode can be improved by increasing the thickness of TRC panels.
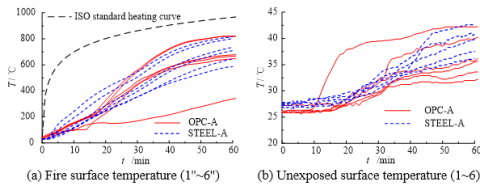
3.5 The effect of the type of reinforcing material
The temperature-time curves of OPC-A and STEEL-A are given in Figure 9. Unlike those of OPC-A, there is no obvious segmentation in the temperature-time curves of STEEL-A. The mean temperature of STEEL A increased at a clearly faster rate than that of OPC-A, but the difference became insignificant at 1h. Due to the existence of 9cm-thick core layer, the mean temperature and the temperature difference between the two specimens almost remained the same. However, it is observable that the peak temperature of STEEL-A, as measured by the moving thermocouple, was greater than that of OPC-A. Compared with OPC-A, STEEL-A saw its concrete matrix peeling off severely, which reduces the fire resistance limit. As stated above, the steel wire mesh is not favorable to fire resistance, i.e. the TRC panel is more resistant to fire.
Figure 9. The effect of the type of reinforcing material on the measured temperature
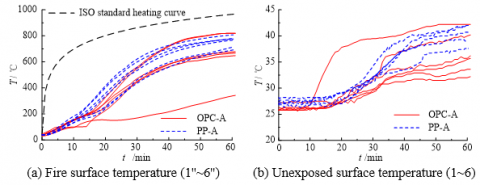
3.6 The effect of additional short fibers
The time variation in temperature with and without additional short fibers is illustrated in Figure 10. Comparatively, little difference can be observed between PP-A and OPC-A. On the mean temperature on the inside of the fire surface, PP-A had a slight edge over OPC-A early in the fire test, but the edge shrank with the elapse of time. Furthermore, the unexposed surface temperature varied very slightly for PPA and OPC-A. This means the addition of short PP fibers has no significant impact on the mean temperature. Neither does it greatly improve the failure mode.
Figure 10. The effect of additional short fibers on the measured temperature
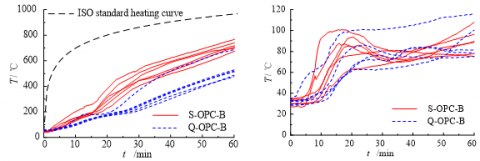
3.7 The effect of the type of fireproof coating
Figure 11. The effect of the type of fireproof coating on the measured temperature
Figure 11 describes the time variation in temperature with fireproof coatings. Each of the curves in Figure 11(a) could be divided into two segments, namely, the preheating segment and the development segment. Compared with the specimens without fireproof coating, the coated specimens lasted for a long time in the preheating phase and their temperature grew at a slow rate. Therefore, the two types of fireproof coatings in our test can effectively prevent heat transfer and reduce the absolute temperature on the fire surface. Moreover, the two types of fireproof coatings had a similar temperature trend. In the later phase, the ordinary fireproof coating slightly outperformed the self-made one in thermal insulation, according to the unexposed surface temperatures.
4.1 Effect of the type of fireproof coating
The heat transfer of the test materials has strong nonlinearity in fire, making it difficult to solve by analytical method. Therefore, ABAQUS 6.10 was introduced for finite-element simulation of the temperature field of TRC self-thermal insulation sandwich walls, and determine the heat transfer process of the wall in fire. The finite-element simulation model of the wall and the connectors are described in Figure 12. The various components were simulated by solid elements. Three parameters were included in the simulation: density ρ, thermal conductivity λ and specific heat c. The parameters of the simulated components are listed in Table 8. Only OPC-A, OPC-B and OPC-B(T) were subjected to the simulation, because the specific heat of fireproof coatings is unknown.
Figure 12. Finite-element model
Table 8. The parameters of the simulated components
|
Parameter |
Density ρ/(kg∙m-3) |
Thermal Conductivity λ/(W∙m-1∙K-1) |
Specific Heat c/(J∙m-3∙K-1) |
|
TRC panel |
2344 |
0.714 |
1050 |
|
Steel wire mesh |
7850 |
58.2 |
480 |
|
Rock wool board |
91 |
0.043 |
750 |
The fire surface was simulated with the third boundary condition, that is, under the known ambient temperature (ISO834 international standard heating curve) and the comprehensive heat transfer coefficient h between the air and the concrete. The relationship between heat transfer coefficient hand temperature in fire can be expressed as [30]:
h =1×10⁻⁷T(t)3 +1×10⁻⁵T(t)2+1×10⁻³T(t) +13.5 (1)
where h is the comprehensive heat transfer coefficient between the air and concrete at time t, (W∙m-2∙℃-1); T(t)is the mean ambient temperature at time t. The initial temperature was set to 30 ℃.
4.2 Calculated results on temperature field
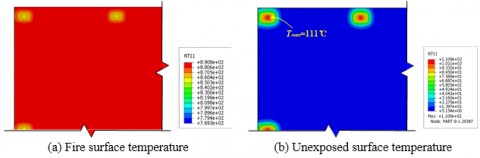
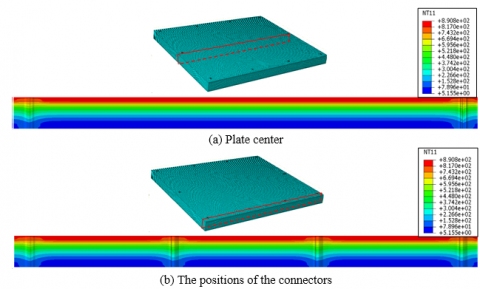
Different specimens have similar temperature fields. Thus, OPC-A was cited as an example for further analysis. The temperature distributions of OPC-A on the fire surface and the unexposed surface at 1h are provided in Figure 13. It can be seen that the lowest fire surface temperature and the highest unexposed surface temperature were measured at the positions of connectors during the fire. This is consistent with the actual situation. The unexposed surface temperature peaked at 111 °C at 1h, which is below the fire resistance limit and in line with the relevant regulations. This result is achieved thanks to the combined effects of rock wool board and TRC panels. In other words, the two components can work synergistically, giving full play to their excellence in thermal resistance.
Figure 13. Temperature distribution of TRC panels at 1h in the fire
Figure 14 shows the temperature distribution on the cross-section of the target walls in the longitudinal direction. As shown in the figure, the main weak points of heat transfer were right at the positions of the connectors, and the temperature declined rapidly along the thickness of the rock wool board. Hence, the TRC self-thermal insulation sandwich walls have a generally good thermal insulation.
Figure 14. Temperature distribution on the cross-section of the target walls at 1h
Figure 15. The temperature-thickness curves
Figure 15 depicts the temperature-thickness curves of OPC-A, OPC-B and OPC-B (T), and the peak temperatures at panel center and connectors. For the three specimens, the plate center temperature increasingly deviated from the peak temperature, with the increase in the distance to the fire surface; the deviations of OPC-A, OPC-B and OPC-B (T) were respectively 97.5℃, 136.5℃ and 51 ℃. Comparatively, the heat transfer rate was smaller at the plate center than at the connectors, which are the main channels of heat transfer and the weak points of heat insulation. The rapid heat transfer at the connectors greatly reduces the fire resistance limit of the walls. Furthermore, the temperature decreased slower at the plate center than in the core layer, indicating that the rock wool board has a greater impact on wall insulation than the panels. However, the temperatures of both the board and the panels changed linearly at the positions of the connectors, owing to the high thermal conductivity of metal. To enhance the fire resistance limit, the metal connectors need to be replaced with nonmetallic ones like the fiber-reinforced plastic (FRP) connectors.
4.3 Comparison between simulated and measured results
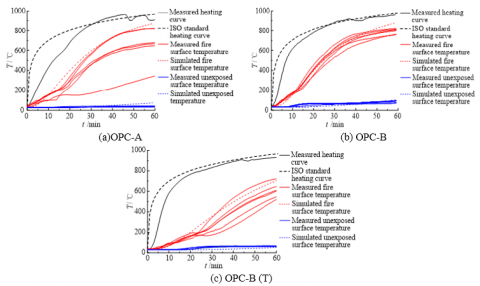
Figure 16 compares the simulated and measured temperature-time curves of OPC-A, OPC-B and OPC-B (T). It can be seen that the simulated results agree well with the measured values on the inside of the fire surface, but differ from the latter on the outside of the unexposed surface. The difference mainly comes from the assumption that the layers are closely connected in the finite-element simulation. In fact, there is inevitably some gaps between the panels and the core layer. Besides, the difficulty in measuring the exact thermal conductivity and specific heat capacity of rock wool board also contribute to the error between the simulated and measured data.
Figure 16. Comparison between simulated and measured temperatures
Referring to the relevant standard on fire resistance test, this paper carries out a fire test on full-scale TRC self-thermal insulation sandwich walls, and draws the following conclusions.
(1) For Portland cement-based specimens with 16mm-thick TRC panels and a 90mm-thick core layer, the fire-resistance limit is 203min, much longer than the requirement for partition walls and non-load-bearing walls of fire rating I. The failure features of the cooled specimens show that the full-scale TRC self-thermal insulation sandwich walls will not collapse after 1h into the fire.
(2) For the high alumina cement-based specimens, the fire resistance limit is 57min, which basically meets the requirement for partition walls and non-load-bearing walls of fire rating I. This type of specimens can maintain its integrity in the fire, although their thermal insulation is slightly weaker than the Portland cement-based ones.
(3) A thicker core layer helps to reduce the unexposed surface temperature, and enhance the fire resistance limit of the components. The core layer thickness should be selected according to the fire resistance provisions and the demand for the usable space. Meanwhile, thicker TRC panels may slightly contribute to the fire resistance limit and improve the failure features of the specimens.
(4) Neither the reinforcing material of TRC panels nor the addition of short PP fibers has a significant impact on the mean temperature on the unexposed surface. Both types of fireproof coatings in our test can effectively prevent heat transfer and reduce the fire surface temperature. The two types of coatings have similar fire resistance effects.
(5) The results of finite-element simulation agree well with the measured data on heat transfer process of the target walls. In addition, the positions of the connectors are the main channels of heat transfer, which greatly reduce the fire resistance limit of the said walls.
This research was funded by the National Natural Science Foundation of China, grant number 51708506 and 51578495, and the Foundation of Zhejiang Province Key Laboratory of Space Structure, grant number 201702
[1] National Standards of the People's Republic of China. GB 50016-2006 Code for fire protection design of buildings. (2006). China Planning Press: Beijing.
[2] Hegger J, Will N, Bruckermann O, Voss S. (2006). Loadbearing behaviour and simulation of textile reinforced concrete. Materials and Structures 39(8): 765-776. https://doi.org/10.1617/s11527-005-9039-y
[3] Yin S, Na MW, Yu YL, Wu J. (2017). Research on the flexural performance of RC beams strengthened with TRC under the coupling action of load and marine environment. Construction and Building Materials 132: 251-261. https://doi.org/10.1016/j.conbuildmat.2016.12.001
[4] Pourasee A, Peled A, Weiss WJ. (2011). Fluid transport in cracked fabric-reinforced-cement-based composites. Journal of Materials in Civil Engineering 23(8): 1227-1238. https://doi.org/10.1061/(ASCE)MT.1943-5533.0000289
[5] Peled A, Bentur A, Mobasher B. (2017). Textile Reinforced Concrete; CRC Press: Boca Raton.
[6] Hegger J, Voss S. (2008). Investigations on the bearing behaviour and application potential of textile reinforced concrete. Engineering Structures 30(7): 2050-2056. https://doi.org/10.1016/j.engstruct.2008.01.006
[7] Engberts E. (2006). Large-size facade Elements of textile reinforced concrete. ICTRC'2006 - 1st International RILEM Conference on Textile Reinforced Concrete: 309-318. https://doi.org/10.1617/2351580087.030
[8] Hegger J, Voss S, Scholzen A. (2008). TextileReinforced Concrete for Light Structures. International Concrete Abstracts Portal 251: 97-108.
[9] Schneider HN, Bergmann I. (2008). The application potential of textile-reinforced. International Concrete Abstracts Portal 250: 7-22.
[10] Cuypers H, Wastiels J. (2011). Analysis and verification of the performance of sandwich panels with textile reinforced concrete faces. Journal of Sandwich Structures & Materials 13(5): 589-603. https://doi.org/10.1177/1099636211408665
[11] Hegger J, Kulas C, Horstmann M. (2012). Spatial Textile Reinforcement Structures for Ventilated and Sandwich Facade Elements. Advances in Structural Engineering 15(4): 665-676. https://doi.org/10.1260/1369-4332.15.4.665
[12] Hegger J, Horstmann M. (2008). Light-weight TRC sandwich building envelopes. Excellence in concrete construction through innovation: 187-194.
[13] Hegger J, Will N, Scholzen A. (2008). Sandwich panels with thin-walled textile-reinforced concrete facings. International Concrete Abstracts Portal 251: 99-115.
[14] Shams A, Horstmann M, Hegger J. (2014). Experimental investigations on Textile-Reinforced Concrete (TRC) sandwich sections. Composite Structures 118(118C): 643-653. ttps://doi.org/10.1016/j.compstruct.2014.07.056
[15] Lee C, Lee S. (2013). Fire resistance of reinforced concrete bearing walls subjected to all-sided fire exposure. Materials and structures 46(6): 943-957. https://doi.org/10.1617/s11527-012-9945-8
[16] Kolarkar P, Mahendran M. (2012). Experimental studies of non-load bearing steel wall systems under fire conditions. Fire safety journal 53: 85-104. https://doi.org/10.1016/j.firesaf.2012.06.009
[17] Gara F, Ragni L, Roia D, Dezi L. (2012). Experimental tests and numerical modelling of wall sandwich panels. Engineering Structures 37: 193-204. https://doi.org/10.1016/j.engstruct.2011.12.027
[18] Chen W, Ye JH, Bai Y, Zhao XL. (2013). Improved fireresistant performance of load bearing cold-formed steel interior and exterior wall systems. Thin-Walled Structures 73: 145-157. https://doi.org/10.1016/j.tws.2013.07.017
[19] Zuo HL, Li YS, Di J, Guo N. (2018). Lateral performance of timber shear walls reinforced by prestressed diagonal cross bars. Annales de Chimie-Science des Matériaux 42(2): 233-243. https://doi.org/10.3166/ACSM.42.233-243
[20] Silva FA, Butler M, Hempel S, Filho RDT, Mechtcherine V. (2014). Effects of elevated temperatures on the interface properties of carbon textile-reinforced concrete. Cement and Concrete Composites 48: 26-34. https://doi.org/10.1016/j.cemconcomp.2014.01.007
[21] Rambo DAS, Silva FA, Filho RDT, Comes O. Effect of elevated temperatures on the mechanical behavior of basalt textile reinforced refractory concrete. Materials & design 65: 24-33. https://doi.org/10.1016/j.matdes.2014.08.060
[22] Xu S, Shen L, Wang J, Fu Y. (2014). High temperature mechanical performance and micro interfacial adhesive failure of textile reinforced concrete thin-plate. Journal of Zhejiang University-Science A: Applied Physics & Engineering 15(1): 31-38. https://doi.org/10.1631/jzus.A1300150
[23] Xu S, Shen L, Wang J. (2016). The high-temperature resistance performance of TRC thin-plates with different cementitious materials: Experimental study. Construction and Building Materials 115: 506-519. https://doi.org/10.1016/j.conbuildmat.2016.04.070
[24] Shen L, Xu S, Wang J. (2015). Mechanical behavior of TRC thin-plates exposed to high temperature: Experimental study. Magazine of Concrete Research 67: 1135-1149.
[25] Talaiji T, Xuan HV, Ferrier E, Larbi AS. (2018). Thermomechanical behaviour and residual properties of textile reinforced concrete (TRC) subjected to elevated and high temperature loading: Experimental and comparative study. Composites Part B: Engineering 144: 99-110. https://doi.org/10.1016/j.compositesb.2018.02.022
[26] Liu S, Zhu D, Ou Y, Yao Y, Shi C. Impact response of basalt textile reinforced concrete subjected to different velocities and temperatures. Construction and Building Materials 175: 381-391. https://doi.org/10.1016/j.conbuildmat.2018.04.193
[27] Raoof SM, Bournas DA. (2017). Bond between TRM versus FRP composites and concrete at high temperatures. Composites Part B Engineering 127: 150-165. https://doi.org/10.1016/j.compositesb.2017.05.064
[28] Al-Salloum Y, Almusallam T, Elsanadedy HM, Iqbal R. (2016). Effect of elevated temperature environments on the residual axial capacity of RC columns strengthened with different techniques. Construction and Building Materials 115: 345-361. https://doi.org/10.1016/j.conbuildmat.2016.04.041
[29] National Standards of the People's Republic of China. GB/T 9978.1-2008 Fire-resistance tests-Elements of building construction-Part 1: General requirements. (2009). China Standards Press: Beijing.
[30] Liao Y, Qi Y, Ma X. (2011). Nonlinear finite element analysis of reinforced concrete beams in fire. Industrial Construction 41: 31-37.